Transcription
The correct bibliographic citation for this manual is as follows: SAS Institute Inc. 2019. Exploring SAS Viya : Data Mining andMachine Learning. Cary, NC: SAS Institute Inc.Exploring SAS Viya : Data Mining and Machine LearningCopyright 2019, SAS Institute Inc., Cary, NC, USA978-1-64295-588-0 (Paperback)978-1-64295-587-3 (Web PDF)All Rights Reserved. Produced in the United States of America.For a hard-copy book: No part of this publication may be reproduced, stored in a retrieval system, or transmitted, in any formor by any means, electronic, mechanical, photocopying, or otherwise, without the prior written permission of the publisher, SASInstitute Inc.For a web download or e-book: Your use of this publication shall be governed by the terms established by the vendor at thetime you acquire this publication.The scanning, uploading, and distribution of this book via the Internet or any other means without the permission of the publisheris illegal and punishable by law. Please purchase only authorized electronic editions and do not participate in or encourageelectronic piracy of copyrighted materials. Your support of others’ rights is appreciated.U.S. Government License Rights; Restricted Rights: The Software and its documentation is commercial computer softwaredeveloped at private expense and is provided with RESTRICTED RIGHTS to the United States Government. Use, duplication,or disclosure of the Software by the United States Government is subject to the license terms of this Agreement pursuant to, asapplicable, FAR 12.212, DFAR 227.7202-1(a), DFAR 227.7202-3(a), and DFAR 227.7202-4, and, to the extent required underU.S. federal law, the minimum restricted rights as set out in FAR 52.227-19 (DEC 2007). If FAR 52.227-19 is applicable, thisprovision serves as notice under clause (c) thereof and no other notice is required to be affixed to the Software or documentation.The Government’s rights in Software and documentation shall be only those set forth in this Agreement.SAS Institute Inc., SAS Campus Drive, Cary, NC 27513-2414August 2019SAS and all other SAS Institute Inc. product or service names are registered trademarks or trademarks of SAS Institute Inc. inthe USA and other countries. indicates USA registration.Other brand and product names are trademarks of their respective companies.SAS software may be provided with certain third-party software, including but not limited to open-source software, which islicensed under its applicable third-party software license agreement. For license information about third-party softwaredistributed with SAS software, refer to http://support.sas.com/thirdpartylicenses.
ContentsAbout This Book . vChapter 1: Programming in SAS Studio and the Python Interface . 1Introduction. 1Programming in SAS Studio . 1Programming with the Python Interface . 10Conclusion. 22Resources . 23Chapter 2: Data Mining and Machine Learning Tasks in SAS Studio . 25Introduction. 25Decision Tree . 25Neural Network. 31Forest Model . 35Gradient Boosting . 39Resources . 43Chapter 3: Advanced Data Mining and Machine Learning Procedures . 45Introduction. 45Factorization Machines. 45Text Mining . 49Community Detection . 54Resources . 59Chapter 4: SAS Visual Data Mining and Machine Learning in Model Studio . 61Introduction. 61Impute Missing Values . 63Feature Engineering . 71Variable Selection . 78Gradient Boosting Model . 80Manage Variables . 87Add Custom Code . 88Save Data for Use in Other Applications . 93Resources . 97Chapter 5: SAS Visual Data Mining and Machine Learning in SAS Visual Analytics . 99Introduction. 99Factorization Machine . 101Forest . 103Gradient Boosting . 107Neural Network. 110Support Vector Machine . 113Model Comparison . 117Resources . 118
For more information on this topic,check out the books below in theSAS bookstore:For 20% off these e-books, visit sas.com\books and use code WITHSAS20.sas.com/booksfor additional books and resources.SAS and all other SAS Institute Inc. product or service names are registered trademarks or trademarks of SAS Institute Inc. in the USA and other countries. indicates USA registration.Other brand and product names are trademarks of their respective companies. 2019 SAS Institute Inc. All rights reserved. M1913158 US.0419
About This BookWhat Does This Book Cover?Data mining is the process of finding anomalies, patterns and correlations within large data sets to predictoutcomes. Using a broad range of techniques, you can use this information to increase revenues, cut costs,improve customer relationships, reduce risks and more. Machine learning is a method of data analysis that usesdata mining techniques to automate analytical model building. Using algorithms that iteratively learn from data,machine learning allows computers to find hidden insights without being explicitly programmed where to look.SAS Visual Data Mining and Machine Learning is a powerful analytical solution that enables you to solveyour most complex problems in a single, integrated solution powered by SAS Viya .SAS Viya is an open analytics platform that can handle any data type, volume, or speed. A cloud-enabled, inmemory analytics engine, it is elastic, scalable, and fault-tolerant. It contains a standardized code base thatsupports programming in SAS and other languages, such as Python, R, Java and Lua. In addition, it can deployseamlessly to any infrastructure or application ecosystem with support for cloud, on-site, or hybridenvironments. The high-performance processing power of SAS Viya is provided by SAS Cloud AnalyticsServices (CAS). CAS is an in-memory engine that can dramatically accelerate data management and analyticswith SAS.In this book, we will explore some of the features of SAS Visual Data Mining and Machine Learning,including: Programming in SAS Studio Programming in the Python interface Data mining and machine learning tasks New, advanced data mining and machine learning procedures available in SAS Viya Pipeline building in Model Studio Model building and comparison in SAS Visual AnalyticsThe extreme flexibility of SAS Visual Data Mining and Machine Learning means that users of all skill levelscan visually explore data on their own in these programs while drawing on powerful in-memory technologiesfor faster analytic computations and discoveries. These programs offer an easy-to-use self-service environmentthat can scale on an enterprise-wide level. You can manually program with custom code or use the features inSAS Studio, Model Studio, and SAS Visual Analytics to automate your data manipulation and modeling.The content in this book is based on SAS Viya Enablement, a free course available from SAS Education.This book covers how to explore, train, and model data in the SAS Studio, Model Studio, and SAS VisualAnalytics environments. This book only begins to show what these programs can do. More information isavailable in the documentation for specific procedures and features.If you want to learn more about the features of SAS Viya, how to load data into the CAS server, how to writenew code, and how to perform data management and administrative tasks, then you might be interested inreading Exploring SAS Viya : Programming and Data Management. You might also want to readExploring SAS Viya : Visual Analytics, Statistics, and Investigations, which introduces how to use datamining and machine learning tasks in SAS Studio and SAS Visual Analytics, as well as how to access all ofyour enabled features in SAS Viya and configure your home page.
vi About this BookIs This Book for You?SAS Data Mining and Machine Learning software is designed for anyone in your organization who wants touse and derive insights from data – data scientists, business analysts, management, and other analyticsprofessionals. From data management to model development and deployment, everyone works in the sameintegrated environment.SAS Visual Data Mining and Machine Learning automatically generates insights that enable you to identify themost common variables across all models, the most important variables selected across models, and assessmentresults for all models. Natural language generation capabilities are used to create a project summary written insimple language, enabling you to easily interpret reports. Analytics team members can add project notes to theinsights report to facilitate communication and collaboration among team members.Even if you don’t know SAS code, SAS Visual Data Mining and Machine Learning lets you embed opensource code within an analysis and call open-source algorithms seamlessly within a Model Studio flow. Thisfacilitates collaboration across your organization because users can program in the language of their choice.You can also take advantage of SAS Deep Learning with Python (DLPy), our open-source package on GitHub,to use Python within Jupyter notebooks to access high-level APIs for deep learning functionalities.What Should You Know about the Examples?The content in this book is based on SAS Viya Enablement, a free course available from SAS Education.You can follow along with the examples in real time by watching the videos if you prefer.This book includes tutorials for you to follow to gain hands-on experience with SAS Studio, Model Studio, andSAS Visual Analytics. Wherever possible, the source of the sample data or similar data is provided in a link.Some features shown might be available only if your site has licensed that feature in SAS Viya. Therefore, theoptions in your version of SAS might look different.We Want to Hear from YouDo you have questions about a SAS Press book that you are reading? Contact us at saspress@sas.com.SAS Press books are written by SAS Users for SAS Users. Please visit sas.com/books to sign up to requestinformation about how to become a SAS Press author.Learn about new books and exclusive discounts. Sign up for our new books mailing list today .html.
Chapter 1: Programming in SAS Studio and thePython InterfaceIntroduction .1Programming in SAS Studio .1Load and Explore Data . 2Partition Data . 3Impute Missing Values . 4Variable Selection . 5Model Building . 6Model Assessment . 8Score New Data . 10Programming with the Python Interface .10Import Packages . 11Connect to the CAS Server and Start CAS Session. 11Import Action Sets . 11Load Data into CAS . 11Explore Data . 12Impute Missing Values . 14Partition Data . 15Model Building . 15Model Assessment . 20Create ROC and Lift Plots Using Validation Data . 20Conclusion .22Resources.23IntroductionSAS Viya is a new product offering from SAS that showcases a rich set of data mining and machine learningcapabilities that run on a robust, in-memory distributed computing infrastructure. This product provides a singleenvironment for data scientists to perform necessary tasks associated with data preparation, feature engineering,model training, assessment, and deployment.With SAS Viya, you can access SAS analytics through programmatic actions written in SAS or throughinterfaces with other programming languages such as Python, Java, and Lua. In this section, we will look atsome of the capabilities of SAS Visual Data Mining and Machine Learning that can be programmed manuallyusing SAS Studio, then look at another example using the Python interface.The main interface for SAS Viya is SAS Studio, a web-based user interface that offers an array of utilities andconveniences for composing your applications in the SAS programming language. First, let’s look at some ofthe capabilities of SAS Viya through an example of programming in SAS Studio.Programming in SAS StudioIn this section, we will look at a simple, start-to-finish machine learning solution that can be programmedmanually in SAS Viya through the SAS Studio interface. This code loads and prepares the data, builds andcompares three models, and provides score code for new data. In the next chapter, we will look at how some ofthese steps can be automated using the Data Mining and Machine Learning tasks in SAS Studio.The data source used in this example contains a list of donors to an organization. This data source has a targetvariable, TARGET B, which is a binary variable that has the value 1 for a person who has donated during amailing. The example data is available to download from the SAS Visual Data Mining and Machine Learningdocumentation. See the link in the Resources section.
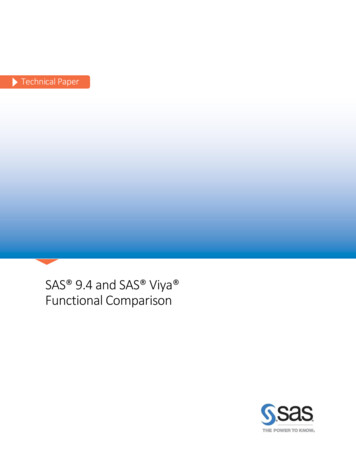
2 Exploring SAS Viya: Data Mining and Machine LearningLoad and Explore DataProgram 1.1 shows a program that loads the data into CAS, then runs PROC CARDINALITY to produce anoutput table that contains information about the levels of nominal variables, basic statistics, and an accountingof missing values.Program 1.1: Loading and Exploring Data/******************************//* Setup ns cashost ”&cashost.” casport &casport.; libname mylib “/opt/sasinside/DemoData”;%let outdir /opt/sasinside/DemoData;libname mycaslib cas “/opt/sasinside/DemoData”; /******************************//* Copy local data into CAS*//******************************/data mycaslib.donor raw data; Set mylib.donor raw data;run;/******************************//* Data Exploration*//******************************/proc cardinality data mycaslib.donor raw data outcard mycaslib.donor raw card;run; proc print data mycaslib.donor raw card(where( NMISS 0));run;data donor missing;set mycaslib.donor raw card(where ( nmiss 0) keep varname nmiss noobs );percentmiss ( nmiss / noobs )*100;Label percentmiss ‘Percent Missing’;proc sgplot data donor missing;vbar varname / response percentmiss datalabel categoryorder respdesc;run; As previously mentioned, SAS Viya runs on an in-memory distributed computing infrastructure, whichis called CAS. So the first things we need to do in Program 1.1 are to specify the host and portinformation to the CAS server and start a session, which creates a workspace for our code to run in. Inthe CAS environment, data must be loaded in a CAS data set to allow efficient distributedmanagement of the data. Here we specify a library location within our current session. Here we load a data set into CAS from an existing SAS data set on our local disk. There are numerousoptions for loading data from various file formats and data sources, including different datamanagement systems, such as Hadoop and Amazon S3. As with any data analysis project, we start by examining the data regarding the nature of the variablesthrough an analysis of all of the values. Executing PROC CARDINALITY produces an output tablethat contains information about the levels of nominal variables, basic statistics, and an accounting ofmissing values. Here we are specifically printing a table of all variables with missing values so that we can deal withthem properly. The results of the PROC PRINT and PROC SGPLOT are shown in Output 1.1.
Chapter 1: Programming in SAS Studio and the Python Interface 3Output 1.1: Results of Program 1.1Partition DataArmed with knowledge about the nature of our data from Output 1.1, we next use PROC PARTITION topartition the data set into training and validation subsets, specifying the target of interest in our modelingproblem to ensure appropriate stratification.Program 1.2: Partitioning into Training and Validationproc partition data mycaslib.donor raw data partition samppct 70;by target b;output out mycaslib.donor raw partind copyvars ( ALL );run;data mylib.donor raw partind;set mycaslib.donor raw partind;run;Program 1.2 creates a new data set with a partition index, as shown in Output 1.2. Note that some modelingprocedures have partitioning as an integrated option, so doing this up front might not always be necessary.Output 1.2: Results of Program 1.2
4 Exploring SAS Viya: Data Mining and Machine LearningImpute Missing ValuesBecause we have missing values, we next run PROC VARIMPUTE in Program 1.3 to impute the missingvalues through any of a number of methods. In this case, we are simply using the median. This creates scorecode that can then be run against the original data set or any future data set to impute the missing values, asshown in Output 1.2.We can also see by running PROC CONTENTS that a new variable, IM DONOR AGE, now represents thedonor age in our data set, as shown in Output 1.3.Program 1.3: Imputationproc varimpute data mycaslib.donor raw partind;input donor age /ctech median;code file ”&outdir./impute1.sas”;output out mycaslib.donor raw partind copyvars ( ALL );run;proc contents data mycaslib.donor rawOutput 1.3: Results of Program 1.3Because we will need to provide lists of variables as inputs in some of the procedures, it is convenient to definemacro variables to hold this information as shown in Program 1.4 for class in interval variables.
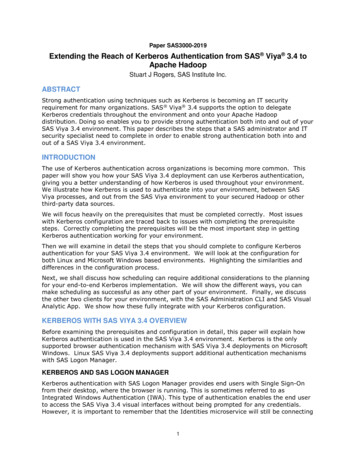
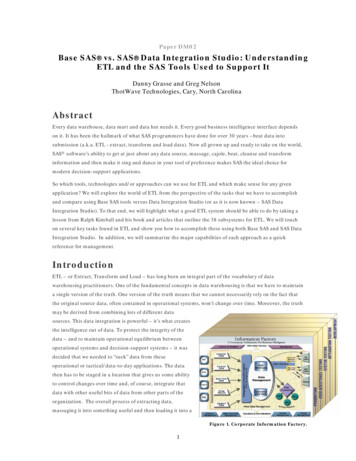
Chapter 1: Programming in SAS Studio and the Python Interface 5Program 1.4: Macro Variable Definition%let class var in house urbanicity ses cluster code home owner donor genderincome group published phone overlay source wealth rating pep starrecency status 96NK frequency stsatus 97NK%let interval var months since origin im donor age mor hit rate median home valuemedian household income pct owner occupied per capita income pct attribute1pct attribute2 pct attribute3 pct attribute4 recent star statusrecent response prop recent avg gift amt recent card respone proprecent avg card gift amt recent response count recent card response countmonths since last prom resp lifetime card prom lifetime prom lifetime gift amountlifetime gift count lifetime avg gift amt lifetime gift rangelifetime max gift amt lifetime min gift amt last gift amt card prom 12number prom 12 months since last gift months since first gift file avg giftfile card gift;Variable SelectionBefore proceeding to build models, we can run PROC VARRREDUCE to perform supervised variableselection that identifies the most important features relative to our specified target.Program 1.5: Variable Selectionproc varreduce data mycaslib.donor raw partind technique dsc/*Discriminant analysis for class target*/class target b &class var.;reduce supervised target b &class var. &interval var. /maxeffects 20;ods output selectionsummary summary;run;data out iter (keep Iteration VarExp Base Increment Variable);set summary;Increment dif(VarExp);If Increment ’.’ ThenIncrement 0;Base VarExp – Increment;run;proc transpose data out iter trans;label NAME ’Group’;by NAME ;run;title “Variance Explained by Interation”;proc sgplot data out iter trans;yaxis label ”Variance Explained”;vbar Iteration / response COL1 group NAME ;run;
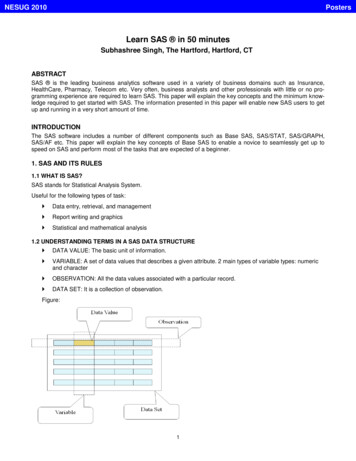
6 Exploring SAS Viya: Data Mining and Machine LearningOutput 1.5: Partial Results of Program 1.5Output 1.5 indicates the top 20 variables that are identified as significant and should be used as inputs formodeling.Model BuildingNow we are ready to build some models. We use PROC LOGSELECT to create a logistic regression model inProgram 1.6.Program 1.6: Logistic Regression Modelingproc logselect data mycaslib.donor raw partind;class target b &class var.;model target b (event ’1’) &class var. &interval var.;selection method forward /*(choose validate stop validate)*/partition rolevar partind (train ’1’ validate ’0’)code file ”&outdir./logselect1.sas”;*output data mycaslib.logselect scored copyvars ( ALL );ods output FitStatistics fitstats(rename (Ntrees Trees));run;/* Score the data using the generated model */data mycaslib.donor scored forest;set mycaslib.donor raw partind;%include “&outdir./forest1.sas”;p target b0 1-p target b;run;Next, we run PROC FOREST to generate a random forest model.Program 1.7: Random Forest Modelingproc forest data mycaslib.donor raw partind ntrees 50 intervalbins 20 minleafsize 5;input &interval var. / level interval;input &class var. / level nominal;target target b / level nomial;partition rolevar partind (train ’1’ validate ’0’);code file ”&outdir./forest1.sas”;*output data mycaslib.forest scored copyvars ( ALL );ods output FitStatistics fitstats(rename (Ntrees Trees));run;/*Score the data using the generated model */
Chapter 1: Programming in SAS Studio and the Python Interface 7data mycaslib.donor scored forest;set mycaslib.donor raw partind;%include ”&outdir./forest1.sas”;run;/* create data set from forest state output */data fitstats;set fitstats;label Trees ‘Number of Trees’;label MiscTrain ‘Training’;label MiscValid ‘Validation’;run;/*plot misclassification as function of number of trees */proc sgplot data fitstats;title “Training vs Validation”;series x Trees y MiscTrain;series x Trees y MiscValid/lineattrs (pattern shortdash thickness 2);yaxis label ’Misclassification Rate’;run;title;Output 1.7: Partial Results of Program 1.1GWe also run PROC GRADBOOST to create a gradient boosting model.Program 1.8: Gradient Boosting Modelingproc gradboost data mycaslib.donor raw partind ntrees 50 intervalbins 20 maxdepth 5;input &interval var. / level interval;input &class var. / level nominal;target target / level nominal;partition rolevar partind (train ’1’ validate ’0’);code file ”&outdir./gradboost.sas”;run;/*Score the data using the generated model */data mycaslib.donor scored gradboost;set mycaslib.donor raw partind;%include ”&outdir./gradboost1.sas”;run;
8 Exploring SAS Viya: Data Mining and Machine LearningNotice that in each case, we generate score code that can be used to score future data, which of course is thewhole goal of our application.Model AssessmentNow that we have trained some models, we can assess them using PROC ASSESS to provide fit statistics,specifying that it should write output to specific data sets that can then be used for graphing.Program 1.9: Model Assessment%macro assess model(prefix , var evt , var nevt );proc assess data mycaslib.donor scored &prefix.;input &var evt.;target target b / level nominal event ’1’;fitstat pvar &var nevt. / pevent ’0’;by partind ;**ods select fitstat rocinfo liftinfo;ods html exclude fitstat rocinfo liftinfo;ods outputfitstat mylib.&prefix. fitstatrocinfo mylib.&prefix. rocinfoliftinfo mylib.&prefix. liftinfo;run;%me
In this book, we will explore some of the features of SAS Visual Data Mining and Machine Learning, including: Programming in SAS Studio Programming in the Python interface Data mining and machine learning tasks New, advanced data mining and machine learning procedures available in