Transcription
DAAAM INTERNATIONAL SCIENTIFIC BOOK 2013pp. 857-872CHAPTER 52GEOMETRICAL TOLERANCESTACK UP TECHNIQUESSAHANI A.K.; JAIN P.K. & SHARMA SATISH C.Abstract: Tolerance design has become a very sensitive and important issue inproduct and process development because of increasing demand for quality productsand the growing requirements for automation in manufacturing. This chapterpresents tolerance stack up analysis of dimensional and geometrical tolerances.The stack up of tolerances is important for functionality of the mechanicalassembly as well as optimizing the cost of the system. Many industries are awareof the importance of geometrical dimensioning & Tolerancing (GDT) of theirproduct design. Conventional methods of tolerance stack up analysis are tediousand time consuming. Stack up of geometrical tolerances is usually difficult as itinvolves application of numerous rules & conditions. This chapter introduces thevarious approaches viz. Generic Capsule, Quickie and Catena methods, usedtowards tolerance stack up analysis for geometrical tolerances. Automation ofstack up of geometrical tolerances can be used for tolerance allocation on thecomponents as well as their assemblies considering the functionality of the system.Stack of geometrical tolerances has been performed for individual components aswell as assembly of these components.Key words: GDT, Tolerance stack up, Generic Capsule, Quickie, Catena Method.Authors data: Sahani, A[jai] K[umar]; Jain, P[ramod] K[umar]; Sharma, S[atish]C., Mechanical & Industrial Engineering Department, Indian Institute of TechnologyRoorkee, India, sahaniak@yahoo.comThis Publication has to be referred as: Sahani, A[jai] K[umar]; Jain, P[ramod]K[umar] & Sharma S[atish], C. (2013) Geometrical Tolerance Stack Up Techniques,Chapter 52 in DAAAM International Scientific Book 2013, pp. 857-872, B. Katalinic& Z. Tekic (Eds.), Published by DAAAM International, ISBN 978-3-901509-94-0,ISSN 1726-9687, Vienna, AustriaDOI: 10.2507/daaam.scibook.2013.52
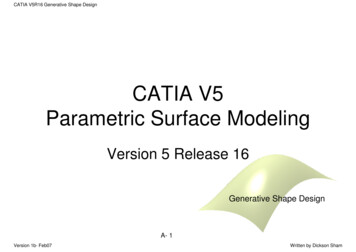
Sahani, A.K.; Jain, P.K. & Sharma Satish, C.: Geometrical Tolerance Stack Up Tec.1. IntroductionThe technology has undergone major changes over the centuries to meet thechanging requirement of the society. During World War II, the United Statesmanufactured and shipped spare parts overseas for the war effort. Many of these partswere made to specifications but would not assemble. The military recognized thatproducing parts that do not properly fit or function is a serious problem since livesdepend on equipment that functions properly. After the war, a committee representinggovernment, industry, and education spent considerable time and effort investigatingthis defective parts problem; this group needed to find a way to insure that partswould properly fit and function every time. The result was the development of GDT.Features toleranced with GDT reflect the actual relationship between matingparts. Drawings with properly applied geometric tolerancing provide the bestopportunity for uniform interpretation and cost-effective assembly. GDT was createdto insure the proper assembly of mating parts, to improve quality, and to reduce cost.Before designers can properly apply geometric tolerancing, they must carefullyconsider the fit and function of each feature of every part. Properly applied geometrictolerancing insures that every part will assemble every time. Geometric tolerancingallows the designers to specify the maximum available tolerance and consequentlydesign the most economical parts.There are 14 different types of geometric tolerances, mainly divided into threetypes for individual features, for related features, or for both individual and relatedfeatures. It is shown in Table 1and symbols of these types of tolerances are shown inFigure 1.Fig. 1. Symbols for geometric feature control [ANSI Y 14.5M-1982]The purpose of stack up analysis is to establish the dimensional relationshipswithin a part or assembly. It enables part tolerance to be optimized while maintainingfunctionality and maximum part interchangeability and allowing minimummanufacturing cost to be achieved. One of the most important reasons for using stackanalysis is that problems can be discovered and solved on paper rather than in theprototype or production, and thus evaluation and modification can be done at theearly stage of design.
DAAAM INTERNATIONAL SCIENTIFIC BOOK 2013Type of ToleranceForIndividualFeaturesFormFor Individual orRelated FeaturesProfileOrientationFor Related FeaturesLocationRunoutpp. 857-872CHAPTER indricityProfile of a LineProfile of a onSymmetryConcentricityCircular RunoutTotal RunoutTab. 1. Types of Geometric TolerancesThis chapter introduces different graphical approaches like the Catena, Quickieand Generic Capsule methods to perform assembly tolerance stack analysis forvarious geometrical tolerances. There are many methods to calculate the cumulativeeffect of tolerance stack ups at specific points of a mechanical assembly with knownindividual tolerances (both type and value). The worst case and root sum squaremethods of tolerance stack up are commonly used methods. The worst case approachis applicable when the number of constituent dimensions in assembly is very small,the volume of production is very small and 100 per cent acceptance is required. Theweakness of the method is that its predictions become too conservative, because asthe number of components in the assembly increases then the chances of all theindividual tolerances occurring at their worst case limits reduce. The Root SumSquare Approach is applicable when the number of constituent dimensions inassembly is sufficiently large; the volume of production is very high and finiterejection of the product assembly is acceptable.2. Overview of TolerancingEngineering, as a science and a philosophy, has gone through a series of changesthat explain and justify the need for a new system for managing dimensioning andtolerancing activities. The evolution of a system to control the dimensional variationof manufactured products closely follows the growth of the quality controlmovement. During the 1960s and 1970s, the trend in engineering education in theUnited States shifted away from a design-oriented curriculum toward a moretheoretical and mathematical approach. Concurrent with this change in educationalphilosophy was the practice of issuing contracts between customers and suppliers thatincreased the physical separation of engineering personnel from the manufacturingprocess. These two changes, education and contracts, encouraged the development of
Sahani, A.K.; Jain, P.K. & Sharma Satish, C.: Geometrical Tolerance Stack Up Tec.several different product design philosophies. The philosophies include engineeringdriven design, process driven design, and inspection driven design.2.1 Engineering Driven DesignAn engineering driven design is based on the premise that the engineeringdesigner can specify any tolerance values deemed necessary to ensure the perceivedfunctional requirements of a product. Traditionally, the design engineer assignsdimensional tolerances on component parts just before the drawings are released.These tolerance values are based on past experience, best guess, anticipatedmanufacturing capability or build-test-fix methods during product development.When the tolerances are determined, there is usually little or no communicationbetween the engineering and the manufacturing or inspection departments. Thismethod is sometimes called the “over-the-wall” approach to engineering designbecause once the drawings are released to production, the manufacturing andinspection personnel must live with whatever dimensional tolerance values arespecified.2.2 Process Driven DesignA process driven design establishes the dimensional tolerances that are placedon a drawing based entirely on the capability of the manufacturing process, not on therequirements of the fit and function between mating parts. When the manufacturedparts are inspected and meet the tolerance requirements of the drawings, they areaccepted as good parts. However, they may or may not assemble properly. Thiscondition occurs because the inspection process is only able to verify the tolerancespecifications for the manufacturing process rather than the requirement for design fitand function for mating parts.2.3 Inspection Driven DesignAn inspection driven design derives dimensional tolerances from the expectedmeasurement technique and equipment that will be used to inspect the manufacturedparts. Inspection driven design does not use the functional limits as the assignedvalues for the tolerances that are placed on the drawing. The functional limits of adimensional tolerance are the limits that a feature has to be within for the part toassemble and perform correctly. One inspection driven design method assignstolerances based on the measurement uncertainty of the measurement system that willbe used to inspect finished parts.3. Previous ResearchA lot of work has been done in the field of conventional tolerancing.Conventional tolerancing methods do a good job for dimensioning and tolerancingsize features and are still used in good capacity today, but conventional tolerancingdo not cater precisely for form, profile, runout, location and orientation features.Geometric Dimensioning and Tolerancing is used extensively for location, profile,runout, form and orientation features. The stack of geometrical tolerances has beendone by Ngoi et al. In his research, a generic approach has been presented which is
DAAAM INTERNATIONAL SCIENTIFIC BOOK 2013pp. 857-872CHAPTER 52simple and systematic process of tolerance stack analysis. The model is constructed,representing the given and the unknown dimensions. The proposed method uses, asthe name implies, a generic capsule, which takes into account all the related aspectsof the axis and surface type of tolerance. Ngoi et al. presented an elegant approach byusing the ‘Quickie’ technique towards tolerance stack analysis for GDT. Theproposed approach has the potential to significantly reduce the amount of workrequired and computerization is proving to be promising. The ‘Quickie’ GDT methodis applicable to all geometric characteristics. However, due to different treatments invarious families of geometric characteristics, the ‘Quickie’ GDT approach analysedrunout and concentricity tolerances. Ngoi et al. presented a straightforward, easy-touse graphical approach known as the “Catena” method for tolerance stack analysis,involving geometric characteristics in form control – flatness, straightness, circularityand cylindricity. No complicated mathematical formulae are required in deriving thesolution. Ngoi et al. suggested Nexus method for stack up of position toleranceinvolving bonus and shift tolerances. The method constructs graphical representationsof features termed Nexus cells. The cells contain all geometric information of thefeatures in numerical values. After each feature is represented by a Nexus cell, thecells are linked up to form the Nexus model for the part. Once the model iscompleted, it can be used to evaluate GDT problems associated with the part. Themethod is also applicable for assembly. The "Noded graph" model by Ngoi et al. isconstructed, representing the given and the unknown dimensions. Links are thenestablished, using the model, which help to formulate the stack path of interest into alinear equation. The equation is used to complete the tolerance stack analysis module.Swift et al. introduced a knowledge-based statistical approach to tolerance allocation,where a systematic analysis for estimating process capability levels at the designstage is used in conjunction with statistical methods for the optimization of tolerancesin assembly stacks. The method takes into account failure severity through linkagewith failure mode and effects analysis (FMEA) for the setting of realistic capabilitytargets. Ngoi et al. presented a simple graphical method to represent the process linksbetween surface planes, and leads to ease in performing the validity of a process plan.The approach used the linear optimisation software, LINDO, to solve the respectivelylinear working dimension and manufacturing tolerance equations. Ngoi et al.presented a simplified approach of model construction directly from the process plan.With the model constructed, the relevant process links between any two surfaces canbe easily determined. Unlike other methods, it does not require transcribing the linkinformation into constraint equations. The formation of the constraint equations ismade easier by direct read-out from the model. He JR described an extension of amodel which determines an optimum set of dimensions and tolerances for machiningprocesses at minimum manufacturing cost. This optimisation minimizes the cost ofscrap, which is a function of manufacturing tolerances, as the objective function.Requirements of design sizes, geometrical tolerances (both form and position) andmachining allowances are expressed mathematically as constraints for theoptimization. Singh et al. reviewed different methods of tolerances allocation andfound mean shift models. The combination of the basic approaches can appropriatelybe considered more useful because of simplicity of application and improved
Sahani, A.K.; Jain, P.K. & Sharma Satish, C.: Geometrical Tolerance Stack Up Tec.precision over the plain basic. Numerical integration and experimental designmethods are relatively less complicated, and are useful especially when it is difficultto express the assembly response function analytically or when computation of thepartial derivatives is difficult. Singh et al. reviewed tolerance synthesis approachesfor tolerance stack-up i.e. the worst-case and the root sum square approaches, or acombination of the aforementioned basic approaches, viz. the Spotts criteria and theGreenwood and Chase criteria, used in an estimation of the tolerance build-up. Thereis a need to have properly estimated mean-shift factors to get precise results. Zhangand Wang used the exponential cost-tolerance model for the various machiningprocesses for the allocation of design and machining tolerances based on the leastmanufacturing cost criterion using simulated annealing as the optimization method.Ahluwalia et al. developed a computer aided tolerance control (CATC) system basedon the tolerance chart technique. The selection of manufacturing processes andsequence of processes affects process tolerance stacking. The system can be used forcomputer aided process planning (CAPP) and for CAD/CAM integration. Chase et al.described a procedure for tolerance specification based on quantitative estimates ofthe cost of tolerances, which permits the selection of component tolerances inmechanical assemblies for minimum cost of production. Chase et al. describedseveral algorithms for performing tolerance allocation automatically, based onoptimization techniques. A cost vs. tolerance function is used to drive theoptimization to the minimum overall cost. The methods provide a rational basis forassigning tolerances to dimensions. Sahani et al. compared different methods forstack up of geometrical tolerances.4. Methods for Tolerance Stack UpIn this section, methods have been presented, that can calculate the cumulativeeffect of tolerance stack ups at specific points of a mechanical assembly. It isassumed that individual tolerances are known (both type and value). The differentmethods are as follows:4.1 Worst Case AnalysisThis method, also known as linear stack-up, is the most basic method forpredicting the effect of individual tolerances on the whole assembly. In this method,tolerance analysis is done by assuming that all the individual tolerances occur at theirworst limits or dimensions simultaneously. The accumulated tolerance (ΔY)can be written as Y n ii 1Where,n Number of constituent dimensions in the dimension chain i Tolerance associated with dimension.This approach is applicable when(1)
DAAAM INTERNATIONAL SCIENTIFIC BOOK 2013pp. 857-872CHAPTER 52(a) The volume of production is very small(b) 100 per cent acceptance is required(c) The number of constituent dimensions in assembly is very smallThe weakness of the method is that its predictions become too conservative,because as the number of the parts in the assembly increases then the chances of allthe individual tolerances occurring at their worst case limits reduce. This method canbe used in designing fixtures and also used for collision avoidance by robots.4.2 Statistical Tolerance AnalysisThis method assumes a probability distribution function (pdf) for the variationof tolerances and then uses this function to predict the assembly variability in thesystem. A standard procedure for tolerance analysis is to determine the first fourmoments of this function and use these to choose a distribution that describes thesystem variability. The main techniques for statistical tolerance analysis are describedbelow.4.2.1 Root Sum Squares Method (RSS)It is the most general form, assuming a Normal or Gaussian distribution forcomponent variations. This case is very popular and frequently used in mechanicalassemblies because of its simplicity. It has been found that it is very optimistic andmany times the number of rejections in the assembly is more than predicted. Totaltolerance of assembly can given as Y n i 12i(2)Where,n Number of constituent dimensions in the dimension chain i Tolerance associated with dimension.This approach is applicable when(a) The volume of production is very high(b) Finite rejection of the product assembly is acceptable(c) The number of constituent dimensions in assembly is sufficiently large4.2.2 Estimated Mean Shift ModelIt is a slight modification of the RSS analysis. In RSS we assume that thevariation of each component dimension is symmetrically distributed about the meanor nominal dimension, which in real processes, is shifted due to setup errors or driftsdue to time- varying parameters such as tool wear. In this method the mean isshifted to accommodate the variations.
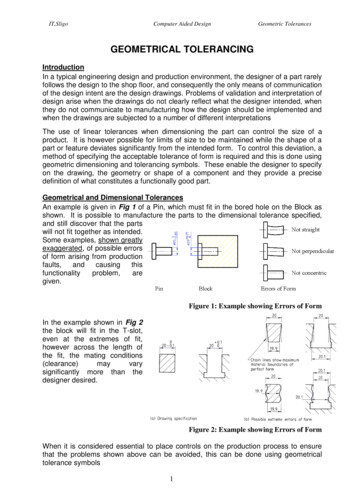
Sahani, A.K.; Jain, P.K. & Sharma Satish, C.: Geometrical Tolerance Stack Up Tec.n Y i i z / 3i 1n (1 i 12i) i2(3)Where, i mean shift factor associated with the manufacturing process fordimension XiZ 3.00, corresponding to 99.73 percent yield this value is most commonlyused in an analytical treatment4.2.3 Taguchi’s MethodThe general idea of Taguchi's method is to use fractional factorial ororthogonal array experiments to estimate the assembly variations due to thecomponent variations. This means that the modified Taguchi method is a productGaussian Quadrature method that gives correct values of the moments up to thefifth moment for linear functions. This method is similar to the Quadraturemethod.4.2.4 Reliability Index MethodThis method calculates the yield or the probability of successful assembly basedon the Hasofer-Lind reliability index. Given the moments of the componentparameters, each of these random variables is transformed into a standard normalrandom variable.4.2.5 Motorola Six Sigma ModelIt is a modification for the RSS method, developed by the Motorola Corp, wherea process capability index is assumed. The process capability index is six times thevariance of the process. It is a modification of the estimated mean shift model thatassumes that the mean of a process shifts due to process variations due to tool wear.In order to achieve high quality in a complex product comprised of manycomponents and processes, each component and process must be produced atsignificantly higher quality levels in order for the composite result to meet finalquality standards.4.3 Monte Carlo SimulationMonte Carlo Simulation is a powerful tool for tolerance analysis ofmechanical assemblies. It can be used for both nonlinear assembly functions andnon-normal distributions. It is based on the use of a random number generator tosimulate the effects of manufacturing variations on assemblies as shown in Figure 2.
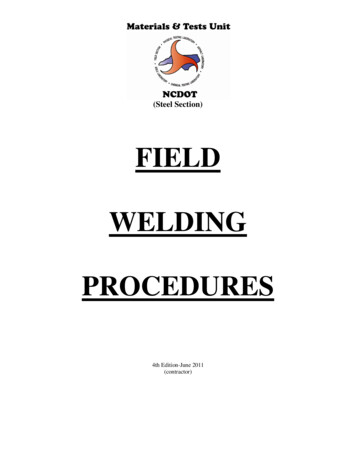
DAAAM INTERNATIONAL SCIENTIFIC BOOK 2013pp. 857-872CHAPTER 52Fig. 2. Monte Carlo distribution5. MethodologyA case is taken up for the tolerances stack up of an assembly by proposedmethods. The assembly consists of two components: I and C section as shown inFigure 3a. The drawings of both the components are shown in the Figure 3b andFigure 3c.In this case, extremum of X is to be calculated.(a)(b)(c)Fig. 3. (a)Assembly of I & C section; (b) I section; (c) C section5.1 Generic CapsuleIn this method, the steps to be followed are labelling‚ modeling, formulation andevaluation. Firstly, the surfaces dimensioned are labeled as shown in Figure 4. Here,surfaces with bilateral flatness tolerance specifications are labelled twice. Thoselabels that have an asterisk (*) suffixed to the alphabets represent the virtual surfacecreated by the presence of the geometrical tolerance. Those surfaces that do not havethe asterisk represent the basic surfaces i.e. surfaces that are separated apart by basicdimensions. The part number for the I is 1 while the part number for the C is 2.Having completed the labelling phase, the graphical model can then beconstructed as shown in Figure 5. In the case of an assembly, the graphical model isconstructed part by part. The two part models are then linked together by dashed linethat represent surface contact.
Sahani, A.K.; Jain, P.K. & Sharma Satish, C.: Geometrical Tolerance Stack Up Tec.Fig. 4. Labelling of assemblyFig. 5. Graphical ModelUpon the completion of the model, the stack path is identified which passesthrough the dashed line that connects between 1D* and 2C* . The expression derivedfrom the stack path is1A*2D* 2D*2D – 2C2D 2C2C* 2C*1D* 1D*1D – 1C1D – 1B1C – 1A1B 1A1A* 0Upon substitution and simplification,X 25.0 0.66Xmax 25.66Xmin 24.345.2 The Quickie MethodThe surfaces are numbered in sequence from top to bottom. Referring to Figure6, the ‘Quickie’ GDT graphical model is developed and shown in Figure 7.
DAAAM INTERNATIONAL SCIENTIFIC BOOK 2013pp. 857-872CHAPTER 52Fig. 6. Surface numbered from top to bottom of assemblyFig. 7. Quickie GDT model for assemblyPathDimension1a1b 5.01b1c 10.01c1d 5.01d2c02c2d 5.01a2d 25.0Tab. 2. Tabulation for assemblyTolerance 0.110 0.300 0.100 0.010 0.140 0.66The results in a closed loop being formed and the data are tabulated in Table 2.From Table 2, Xmax 25.0 0.66 25.66 and Xmin 25.0-0.66 24.34 respectively.5.3 The Catena MethodThe “Catena” methodconsists of establishing a closed-loop stack path between apair of nodes and summing up the values in the closed-loop using the vector principleto obtain the solution.The surfaces of each part are labelled from top to bottom(Figure 8). Theassignment of identity is dependent on the availability of dimensions between anytwo surfaces. All tolerances available in the assembly are converted to the bilateralform.
Sahani, A.K.; Jain, P.K. & Sharma Satish, C.: Geometrical Tolerance Stack Up Tec.(a)(b)Fig. 8. (a)Labelling for I section; (b) Labelling for C sectionWith this information, a nodal representation for a surface of a part can beconstructed. Surface B4 of the “C Section” part in Figure 9 is used as an example,and the nodal representation is shown in Figure 10. The surface node consists of threeportions. The semi-circular portions identify the part and its surface. The upper-rightportion is catered for in the “Offset” case, whereas the bottom-right portion is cateredfor in the “Adjacent” case. The geometric tolerances for offset and adjacent casesused in the stack calculation are ( GT) and (-GT/2 GT/2) respectively. The CatenaModel is shown in Figure 10.Fig. 9. Nodal representation of surfaceFig. 10. Nodal representation of surfaces in assembly
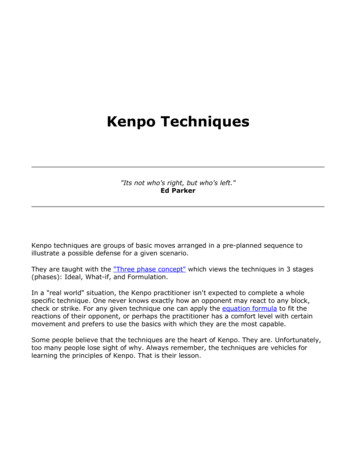
DAAAM INTERNATIONAL SCIENTIFIC BOOK 2013pp. 857-872CHAPTER 52Upon the completion of the Catena model, the stack path is identified whichshould pass through the dashed line that connects between B3 and A4. The closedloop path will be A1-B4-B3-A4-A3-A2-A1 and the expression derived isX 0.015 – (5.0 0.1) 0.025 0.01 – (5.0 0.1) – (10.0 0.3) – (5.0 0.1) 0.01 0X 25.0 0.66Xmax 25.66Xmin 24.345.4 Conventional MethodThe extremum of X are calculated asX Flatness at 2D 2C2D Flatness at 2C Flatness at 1D 1C1D 1B1C 1A1B Flatness at 1A ( 0.015) (5.0 0.1) ( 0.025) ( 0.01) (5.0 0.1) (10.0 0.3) (5.0 0.1) ( 0.01) 25.0 0.66So,Xmax 25.66Xmin 24.34However, it is difficult to computerise the conventional method for tolerancestack up. So, this method is not useful for large assemblies where as graphicalapproach techniques provide an opportunity to handle large assemblies by writing acomputer program.6. Logic for ComputationFor calculation of distances between one surface to another, a system has beendeveloped (Figure 11) for the orientation based geometrical tolerance. While runningthe system, it asks for which type tolerance you want to cater for. After key in theproper tolerance type, it asks the number of components. For each component, wehave to give the input that includes number of surfaces, the distance between onesurface to another. While providing the distances, it also asks for the dimensionaltolerance. Once the above step is completed, the input required is the referencesurface and the parallelism on each surface. After inputting all these details, thegeometrical tolerances are divided by 2 because of bilateral in nature. Same types ofinput should be provided for all other components. After that the system asks whetheryou want to carry out the assembly of these components. If the answer is no, then theoutput is displayed in form of resultant matrix which provide the distance betweenone surface to another of same component. The stack up of tolerances has been doneby both technique i.e. worst case and root sum square approach. Hence for each
Sahani, A.K.; Jain, P.K. & Sharma Satish, C.: Geometrical Tolerance Stack Up Tec.component, there are four matrices i.e. maximum and minimum values by both WCand RSS approach.If the selection of whether you want to carry out the assembly is yes, then it askshow many components you want to assemble. The number of the components beingassembled is keyed in. Then it asks the component numbers of top and bottomfollowed by the mating surface. Now, automatically the bottom component ofprevious assembly is taken as top component for next mating assembly, it asks for thebottom one and so on. The resultant matrix is generated of the order of total numberof surfaces. The order of resultant matrix is nxn, where n is the total number ofsurfaces in the assembly. Now Results of assembly can be shown in form of matrixR given belowR Assem(i, j )i, j 1, , n7. ConclusionThis chapter presents efficient and effective graphical methods for evaluatingtolerance stack up problems. These methods are simple, straightforward and easy toapply. The user does not need to remember the numerous rules regarding tolerancestack up analysis. The models constructed are graphical replica of the geometricalrelationship between the features and parts in the assembly. Using these models, thestack up can be done. These stacks up will assist the designers in evaluating therelative effect of individual tolerances and making necessary changes in early stageof design. The systematic tolerance analysis algorithm is suitable for both manualcalculation and computer programming.An automatic system has been developed. The developed system is capable ofcalculating the unknown distance for the components as well as their assemblies withn number of components having m number of surfaces. This system can be used fororientation geometrical tolerances i.e. parallelism, perpendicularity and angularity.This system is based on WC and RSS approaches. The system helps the designer toreallocate the tolerances in very complex mechanical assemblies without affecting thefunctionality as well as manufacturability. The process of manufacturing can bedecided based on reallocated tolerances. The manufacturing process of individualcomponent is decided so as to minimize the overall cost of the system. However thesystem has a limitation of catering for only one type of tolerance at a time. To date,no single tolerancing software is able fully to automate such analysis. Tolerancingsoftware can be developed using the computational methodologies of these methodsto evaluate geometric tolerance stack problems. Further these accumulated tolerancescan be distributed on different components for optimization of cost.
DAAAM INTERNATIONAL SCIENTIFIC BOOK 2013pp. 857-872CHAPTER 52StartEnter type of toleranceEnter Number of components in assembly: NFor each component:Enter the no of surfaceEnter length between each surface with dimensional toleranceEnter reference surfaceCalculate WCmax, WCmin, RSSmax & RSSminWeight Matrix for individual componentEnter geometrical tolerance on each surfacePrint theNoWant to Assemble?weight matrixYesEnter No. of components to be Assembled (AY)YesIf AY 2NoIfYesError!AY NNoAsk for AY tillEnter the 1st component number from top2 AY NEnter the 2nd component number from topEnter the mating surface of 1st componentndst2Entercomponentbecomethe matingsurfacetheof 12ndcomponentcomponentEnter the 2nd component number to be mateEnter the mating surface of 1st componentEnter the mating surface of 2nd componentPrint the weightAnd so onmatrix AssemblyTill last component(n x n)StopFig. 11. Flow chart for tolerance stack up program
Sahani, A.K.; Jain, P.K. & Sharma Satish, C.: Geometrical Tolerance Stack Up Tec.7. ReferencesAhluwalia, R.S. & Karolin, A.V. (1984). CATC – A computer aided tolerance controlsystem. Journal of manufacturing system, 3(2), pp.153-160Chase, K.W. (1999). Minimum cost tolerance allocation, ADCATS Repo
DAAAM INTERNATIONAL SCIENTIFIC BOOK 2013 pp. 857-872 CHAPTER 52 GEOMETRICAL TOLERANCE STACK UP TECHNIQUES SAHANI A.K.; JAIN P.K. & SHARMA SATISH C. Abstract: Tolerance design has become a very sensitive and important issue in product and process development because of