Transcription
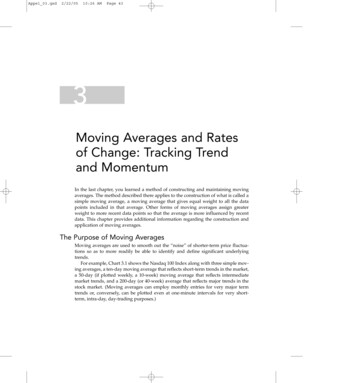
Moving Man – LAB #2Total Time:Start Time:Finish Time:Name:Date:Period:PRINT THESE PAGES AND TURN THEM IN BEFORE OR ON THE DUE DATE GIVEN INYOUR EMAIL.POSITIONBackground – Graphs are not just an evil thing your teacher makes you create, they are a means ofcommunication. In this activity you will learn to speak and read “graph”.Learning Goals – The students will: Develop a general knowledge of distance time graphs.o What a graph of a person standing still would look likeo What a graph of a person moving away from an observer would look like.o What a graph of a person moving towards an observer would look like.o How differences in speed appear on the graphProcedure – do the following activity using this web sim The Moving ManThen click on “Run Now!”1. Getting started. After “Moving Man” is open leave the positiongraph open but close all of the other graphs, velocity andacceleration. Your screen should look like screen 1.2. Making observations. By either clicking on the man or the slidercause the man to move back and forth and observe what shows up onthe graph. Using the axes provided below make a sketch of thegraph that is produced by each action described next to each axis.10Distance (m)A man moving from 0m to 10m at a slow steadypace.Screen 150Time(s)-5-1010Distance (m)A man moving from 0m to 10m at a fast pace.50-5-101Time(s)
10Distance (m)A man standing still at 4m.50-5-1010Distance (m)A man moving from 0m to 10m at a slow steadypace, then moving back to 0m at a fast pace.5Time(s)0-5-1010Distance (m)A man moving from 0m to 5m at a slow steadypace, then moving back to 0m at a slow steadypace.5Time(s)0-5-1010Distance (m)A man moving from 0m to -10m at a slowsteady pace.5Time(s)0-5-10Apply what you learned. Look at the graph below and for the different parts of the graph that aremarked write a statement about what is happening. Be sure to include the direction of motion and thespeed of motion.Part CPart DPart BPart A2Part EPart F
PartABCDescription of direction and speedDEFVELOCITYBackground – Remember graphs are not just an evil thing your teacher makes you create, they are a meansof communication. Graphs are a way of communicating by using pictures and since a picture is worth a thousandwords knowing how to make and interpret graphs will save you a lot of writing.Learning Goals – The students will: Develop a general knowledge of “Velocity vs. Time” graphs and“Distance vs. Time” graphso What graphs of a person standing still would look likeo What graphs of a person moving away from an observer ata constant speed would look like.o What graphs of a person moving towards an observer at aconstant speed would look like.o How differences in speed appear on the graphsProcedure – Do the following activity using this web siteScreen base.htmlThen click on “Run Now!”3. Getting started. After “The Moving Man” is open leave the position graph and the velocity graphopen but close the acceleration graph. Your screen should look like screen 1.4. Making observations. By either clicking on the man or the slider cause the man to move back andforth and observe what shows up on the graphs. Using the axis provided below make sketches ofDistance vs. Time and Velocity vs. Time graphs for the actions described next to each axis.10Time(s)Velocity (m/s)Distance (m)A man moving from 0 to10 at a fast pace themoving back to 0 at a slowpace.0Time(s)-5-1010-5-10Time(s)Velocity (m/s)3Distance (m)A man moving from 0 to 10 at a fast pace themoving back to 0 at a slowpace.50-5-10Time(s)
1050Time(s)-5-10Velocity (m/s)Distance (m)A man moving from 10 to0 at a fast pace.1010Time(s)-5-10Velocity (m/s)Distance (m)50Time(s)-5-10-5-104Time(s)10Time(s)Velocity (m/s)Distance (m)5050-5-1010A man standing still at 4mTime(s)10Velocity (m/s)Distance (m)5050-5-1010A man moving from 0 to10 at a fast pace.Time(s)-5-1010A man moving from 0 to10 at a slow steady pace.5050-5-10Time(s)
Apply what you learned. Look at the Distance vs. Time graph below and for the different parts of thegraph that are marked by the dotted lines make the corresponding Velocity vs. Time graph directlybelow each part.DistanceTime10Velocity50-5-105Time
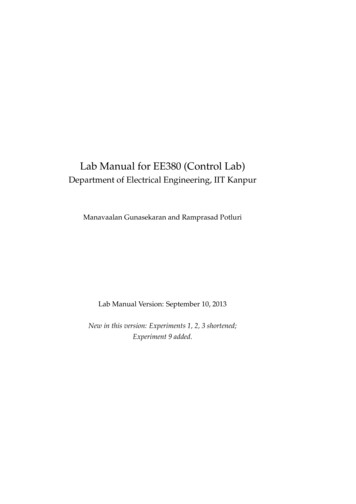
QuestionsYou will need to use the Moving Man Exploration se.html . As you work through these problems focus on making sense of the motion graphs anddiscuss your reasoning with your peers! What is the graph really telling you about the motion? Graphsare used in science and many other areas to record and convey a whole lot of information, just like aphoto of the foothills conveys a whole lot of information about the area we live in. They provide acompact way to tell the whole history of an object's motion. In the space below write your discussion.1) (0.5 pts) First, orient yourself to the Moving Man tool by selecting the “accelerate” motion from thechoose motion list. With the moving man starting at a position of -8 m, set him to “accelerate” at 1 m/s2from an initial velocity of 0. Observe the motion. Also notice that the tool comes equipped with aplayback feature and a double-bar cursor that you may move with the mouse to probe position,velocity, and acceleration along the graph.What is his velocity when he crosses the origin (the position of 0 meters)?2) (0.5 pts) Below is a graph of a balls motion. Use the Moving Man Applet to reproduce the shape ofthis graph. Which of the following sentences gives the best interpretation of the ball’s motion?The ball moves along a flat surface. Then it moves forward down a hill, and then finally stops.The ball doesn't move at first. Then it moves forward down a hill and finally stops.The ball is moving at constant velocity. Then it slows down and stops.The ball doesn't move at first. Then it moves backwards and then finally stops.The ball moves along a flat area, moves backwards down a hill, and then it keeps moving.Not answered6
3) (1 pt) In class, we looked at how human motions could be represented on position versus time andvelocity versus time graphs by using a motion detector to collect data. Use Moving Man to simulate thefollowing scenario: A man starts at the origin, walks towards the tree slowly and steadily for 6 seconds,then stands still for 6 seconds, and then turns around and walks towards the house steadily about twiceas fast for 6 seconds.a) Which of the following velocity versus time graphs conveys this type of motion:ABCDEFGHNot answeredb) Which of the following position versus time graphs also conveys this motion?A7BCDEFGHNot answered
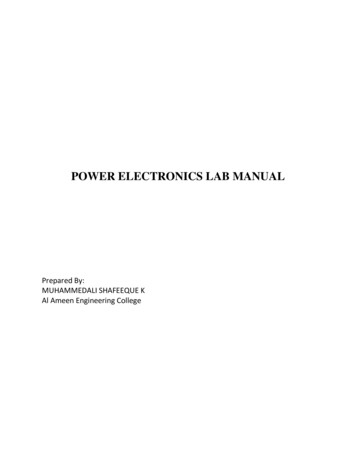
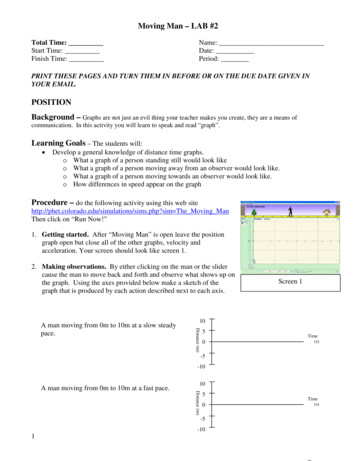
4) (4.5 pts total) A car is traveling along a road. Its velocity is recorded as a function of time and isshown in the graph below.Use the Moving Man Simulation to reproduce the shape of this graph. You’ll find that there are a varietyof approaches for recreating this type of motion within the applet, these include among others: reproducing the motion using the walk motion and the velocity slider control, reproducing the motion using the accelerate motion and acceleration slider control, or reproducing the motion using direct mouse control over the walking man. Note: This method is hard!a) (1 pt) Describe in your own words the motion of the car and give a everyday life scenario inwhich the car’s velocity would resemble the plot shown above. Explain your reasoning byrelating your description to what you see in the graph of the velocity vs time.b) (0.5 pts) From this graph, what do you know about the position of the car at time equals 0seconds?c) (0.5 pts) How far does the car travel between 0 and 3 seconds?8
d) (0.5 pts) The graph of the velocity of the car over this time period tells you how fast the car isgoing and what direction it is traveling at any time during this period. This information also tells youhow the position of the car is changing during over that time period. Which of the following graphsof position versus time of the car is consistent with the velocity of the car as a function of time?ABCDEFNot Answerede) (1 pt) During which of the following times is the car accelerating? (Check all that apply)between 0 and 3 secondsfor only a brief instant at 3 secondsbetween 8 and 13 secondsfor only a brief instant at 13 secondsbetween 13 and 17 secondsfor only a brief instant at 17 secondsbetween 17 and 20 seconds9
f) (1 pt) What is the.i)average acceleration between 0 and 3 secondsii)average acceleration between 3 and 8 seconds:5) (2 pts) The moving man applet allows you to set him into “Walk” mode and control the velocity atwhich the man walks. Play around with this control until you gain an intuition as to how the motion ofthe moving man relates to the velocity setting.TrueFalsetree under all conditions.Not answered If the velocity is negative, the man is walking towards theTrueFalsegreater than zero.Not answered If the velocity is positive, the man’s position is always10TrueFalseNot answered If the velocity is negative, the acceleration is negative.TrueFalseNot answered A negative velocity means the man is slowing down.TrueFalseNot answered If the velocity is zero, the moving man is at the origin.
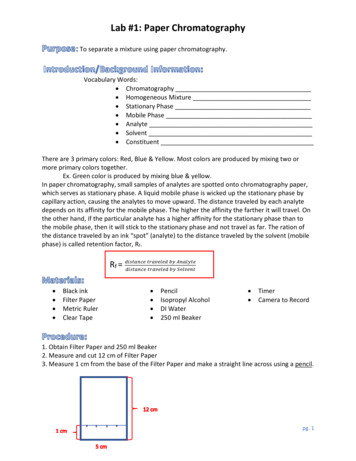
6) (3.5 pts total) Two cars (A and B) are moving along the same stretch of road. The figure below showsa position versus time graph for the motions of the cars.a) (0.5 pts) Which of the following pictures best represents a snapshot of the road way at t 0 sec.ABCDENot answeredb) At the instant time 2sec,i) (0.25 pts) Car A is Car Bahead ofbehindalong side .Not answeredii) (0.25 pts) The speed of Car A is Car Bfaster thaniii)11slower thanequal to .Not answered(1 pt) Explain your reasoning for your answers to i and ii.
c) (0.5 pts) At the instant t 6sec,i) Car A is Car Bahead ofbehindalong side .ii) The speed of Car A is Car Bfaster thanslower thanNot answeredequal to .Not answeredd) (0.5 pts) Which of the following statements best describes the situation depicted in the positionversus time graph?Car A speeds up and passes Car B, which is traveling at a constant speed.Car B slows down and is passed by Car A, which is traveling at a constant speedCar A, traveling at a constant speed, approaches and passes Car B, which is also traveling at aconstant speed.Car A speeds up, Car B slows down, and Car A passes Car B.Not answerede) (0.5 pts) What is the velocity of Car B at t 2 seconds?7) (3.4 pts total) The motion of a walking man is recorded on the position vs time graph below. Use theMoving Man Applet in the “Walk” mode to reproduce this position vs time graph by adjusting thevelocity slider as the man is walking.a) (2.4 pts) At which of the lettered points on the graph: (Choose all that apply)i) is the man’s motion slowest?ii) is the man speeding up?iii) is the man slowing down12aabbaccbcdefdefdef
iv) is the man turning around?abcdefb) (1 pt) Your friend is not taking physics, but wants to know how you can tell from just looking atthis graph of position vs time when the man is slowing down and when he is speeding up. Howwould you explain it to him so that he could make sense of it (without using technical terms likeslope)?13
(0.5 pts) First, orient yourself to the Moving Man tool by selecting the “accelerate” motion from the choose motion list. With the moving man starting at a position of -8 m, set him to “accelerate” at 1 m/s. 2. from an initial velocity of 0. Observe the motion. Also notice that the tool comes equipped with a . playback. feature and a double-bar