Transcription
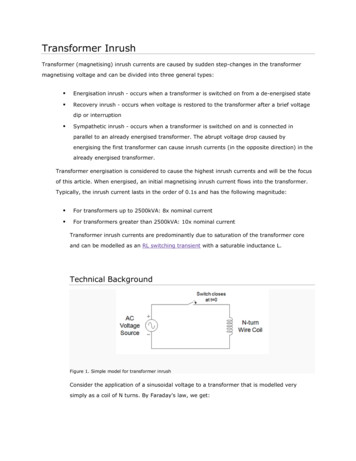
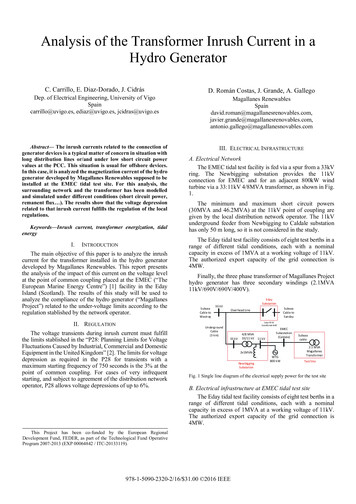
Analysis of the Transformer Inrush Current in aHydro GeneratorC. Carrillo, E. Diaz-Dorado, J. CidrásD. Román Costas, J. Grande, A. GallegoDep. of Electrical Engineering, University of VigoSpaincarrillo@uvigo.es, ediaz@uvigo.es, jcidras@uvigo.esMagallanes allego@magallanesnovables.comAbstract— The inrush currents related to the connection ofgenerator devices is a typical matter of concern in situation withlong distribution lines or/and under low short circuit powervalues at the PCC. This situation is usual for offshore devices.In this case, it is analyzed the magnetization current of the hydrogenerator developed by Magallanes Renewables supposed to beinstalled at the EMEC tidal test site. For this analysis, thesurrounding network and the transformer has been modelledand simulated under different conditions (short circuit power,remanent flux ). The results show that the voltage depressionrelated to that inrush current fulfills the regulation of the localregulations.III. ELECTRICAL INFRASTRUCTUREKeywords—Inrush current, transformer energization, tidalenergyI.INTRODUCTIONThe main objective of this paper is to analyze the inrushcurrent for the transformer installed in the hydro generatordeveloped by Magallanes Renewables. This report presentsthe analysis of the impact of this current on the voltage levelat the point of common coupling placed at the EMEC (“TheEuropean Marine Energy Centre”) [1] facility in the EdayIsland (Scotland). The results of this study will be used toanalyze the compliance of the hydro generator (“MagallanesProject”) related to the under-voltage limits according to theregulation stablished by the network operator.II. REGULATIONThe voltage transients during inrush current must fulfillthe limits stablished in the “P28: Planning Limits for VoltageFluctuations Caused by Industrial, Commercial and DomesticEquipment in the United Kingdom” [2]. The limits for voltagedepression as required in the P28 for transients with amaximum starting frequency of 750 seconds is the 3% at thepoint of common coupling. For cases of very infrequentstarting, and subject to agreement of the distribution networkoperator, P28 allows voltage depressions of up to 6%.A. Electrical NetworkThe EMEC tidal test facility is fed via a spur from a 33kVring. The Newbigging substation provides the 11kVconnection for EMEC and for an adjacent 800kW windturbine via a 33:11kV 4/8MVA transformer, as shown in Fig.1.The minimum and maximum short circuit powers(30MVA and 46.2MVA) at the 11kV point of coupling aregiven by the local distribution network operator. The 11kVunderground feeder from Newbigging to Caldale substationhas only 50 m long, so it is not considered in the study.The Eday tidal test facility consists of eight test berths in arange of different tidal conditions, each with a nominalcapacity in excess of 1MVA at a working voltage of 11kV.The authorized export capacity of the grid connection is4MW.Finally, the three phase transformer of Magallanes Projecthydro generator has three secondary windings (2.1MVA11kV/690V/690V/400V).SubseaCable toWestrayEdaySubstation33 kVSubseaCable toSandayOverhead LineLoop 33 kV(usually opened)UndergroundCable(3 km)33 kV4/8 MVA33/11 kV11 ionWTG800 kWSubseacable2.1 MVAMagallanesTransformerTest SiteFig. 1 Single line diagram of the electrical supply power for the test siteB. Electrical infrastructure at EMEC tidal test siteThe Eday tidal test facility consists of eight test berths in arange of different tidal conditions, each with a nominalcapacity in excess of 1MVA at a working voltage of 11kV.The authorized export capacity of the grid connection is4MW.This Project has been co-funded by the European RegionalDevelopment Fund, FEDER, as part of the Technological Fund OperativeProgram 2007-2013 (EXP 00064842 / ITC-20133119).978-1-5090-2320-2/16/ 31.00 2016 IEEE
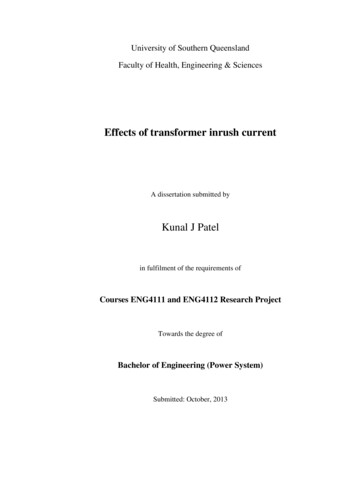
The values of RFE and Xm determine the transformer noload current, whereas the current which flows through Xm iscalled the magnetizing current. Usually, saturation ismodelled by means a non-linear behavior of the magnetizingreactance.TABLE 1. MAIN CHARACTERISTICS OF SUBSEA CABLES AT THE DIFFERENTTEST BERTHS (SOURCE: 2326TypeAs-InstalledCapacitySupplier120mm2EPR178 A3.4 MVA@11 kVPirelli(Prysmian)120mm2XLPE284 A5.4 MVA@11kVDrakaNorskKabelTABLE 2. ELECTRICAL DATA FOR THE PIRELLI CABLESCross sectionDC Resistance (20ºC)AC Resistance (20ºC)Star ReactanceStar CapacitancePositive sequence impedanceZero sequence resistanceZero sequence reactanceZero sequence m2 /km /km /kmȝF/km /km /km /km /kmC. Transformer dataThe three phase transformer of Magallanes Project hydrogenerator has been made by ABB and has three aracteristic of the transformer have been provided by themanufacturer and are illustrated from Table 3 to Table 5.IV. TRANSFORMER MODELLING AND INRUSH CURRENTCALCULATIONTo carry out the calculation of the energization inrushcurrent, a transformer model including saturation is required.The saturation provokes the magnetic core to lose the capacityof increasing its magnetization and the windings of thetransformer to behave almost like an air core reactance. Dueto the hysteresis of the magnetic core, once the transformer isdisconnected from the electrical network it can remainmagnetized (remanent magnetization), which canconsiderably affect to the inrush current.The typical model of the transformer [3] has the followingelements: Xsc, Rsc are the equivalent values for the windingresistance and reactance. These values are usuallyobtained by means a short circuit test. RFE represents the core losses Xm is the magnetizing reactanceTABLE 3. MAIN CHARACTERISTICS OF THE TRANSFORMER2100Rated power (kVA)50Frequency (Hz)Copper losses (pu) 0.00921No load losses (pu) 0.001460.4Primary air core reactance (pu)0.3Magnetizing current (%)TABLE 4. SHORT CIRCUIT VALUESShortcircuit Shortcircuit ShortcircuitSupplyvoltagevoltage Xvoltage circuitWinding2U2V2W3U3V3W4U4V4WALLTABLE 5. SATURATION CURVE (VOLTAGE V VERSUS MAGNETIZINGCURRENT 1.1011.1321.1641.1951.226ͳǤ ͳǤʹ ȋ ȌThe main characteristics of the subsea cable installed inthe different berths are shown in the Table 1. The electricparameters for the Pirelli cable used at EMEC are shown inTable 2.ͳǤͳͳͲǤͻͲǤͺͲǤ ͲǤ ͲͲǤͷͳͳǤͷʹ Ͳ ȋΨȌʹA. Saturation modellingIn order to obtain the transformer saturation parameters,the saturation curve of the transformer provided by themanufacturer ABB, as shown in Table 5, is fitted using thefollowing expression [4], [5]: ܫ ൌ ܦ ඥሺȰௌ െ Ȱ ሻଶ Ͷ ܮܦ Ȱௌ െ Ȱ െ Ȱʹ ܮ (1)Where A, B, C and D coefficients can be obtained in thefollowing way: ܣ ൌ ಲ మ಼; ܤ ൌ ಲ ூಾ ି ಾ ಼; ܥ ൌ ܫ ெ ሺ ܮ ܫ ெ െ Ȱெ Ȱ ሻ;െ ܤ െ ξ ܤ ଶ െ Ͷ ܥܣ ܦ ൌʹ ܣ Furthermore: I0 is the magnetizing current(2)
ΦS is magnetic flux in the transformer core E is the RMS value of the supply voltage IM y ΦM represent the values of current and magneticflux that define the knee saturation point Rsc is the equivalent winding resistance LA is the air core reactance or the saturated corereactance LA is the air core inductance ΦK is the intersection with flux axis of the asymptote,ω is the frequency of the supply voltage (2π·50 rad/sin Europe) ψ is the phase difference between voltage and currentwhose slope is defined by the air core reactance, to thesaturation curveIn order to obtain the values of the saturation knee point aswell as the entire saturation curve, the data provided by ABBhave been fitted by (1. The results are given in Fig. 2 and inTable 6.when the steady estate is reached:߰ ൌ ܽ ݊ܽݐ ൬ ߠ ൌ ܤ ܤ െ ܤ ௦ ܤ ȋ ȌͳǤʹRSC ͲǤͺEͲǤ ͲǤͶFig. 3. Simplified model for the transformer inrush current ͲǤʹ ͲͲͲǤͷͳͳǤͷ ȋΨȌʹʹǤͷFig. 2. Saturation curve (given by ABB and fitted) and asymptoteB. Simplified model for the inrush current calculationIn order to obtain a preliminary estimation of the inrushcurrents, it is used a simplified model of the transformer whichconsists in: a series circuit with a resistance that represents theequivalent electrical resistance of the windings and areactance whose value is the air core reactance, as shown inFig. 3 [6]. In this model, the air core inductance simulates thebehavior of the transformer winding when the core is saturatedwhose value is much lower than the unsaturated magnetizinginductance. The transition between the saturated andunsaturated state is simulated by means of a switch which isclosed when the flux reaches the saturation value. As aconsequence, the analytical equation for the peak value of theinrush current is obtained [6]: ܫ ǡ ௫ ൌξʹ ܧ ଶඥܴ௦ ߱ ଶ ܮ ଶ െ ͳିோ ഏ݁ ఠ ൫ మ షഗషഇ൯ ݊݅ݏ ሺߠ(3)െ ߰ሻ൨ Where: (5)Where Brn is the remanent magnetic intensity, Bm is themagnetic intensity when the transformer is working atits rated supply voltage and Bs is the magnetic intensitywhen the core is saturated.LAͳ(4)θ is the voltage phase when the core starts to besaturated. It can be obtained from:TABLE 6. PARAMETERS OF THE SATURATION CURVEParameter ValueSourceAir core inductance LA (pu)0.4ABBMag. current at the knee point Im (%)0.3 ABB/EstimatedFlux ΦK (Hz)1.25EstimatedMag. flux at the knee point Φm (pu) 1.000Estimated߱ ܮ ൰ܴ௦ Ip,max is the peak maximum value of the inrush currentC. Transient Model for the TransformerA transient model for the transformer has been developedin order to obtain the waveforms of electrical variables duringthe process of energization. In this case, the transformer hasbeen modeled using a non-linear model where saturation issimulated introducing a current source in one of the windings.The value of this current is obtained from the magnetic fluxwhich is firstly calculated from the voltage integral using thelinearized and simplified saturation curve. This transformermodel is available in the PSCAD program which is used tosimulate the transient behavior of electrical systems [5].V. RESULTSFirstly, the transformer in connected using a zeroimpedance voltage source in order to obtain the inrush currentwith different models, the simplified model and the transientmodel, so their results can be compared and validated in acertain way. Next, the simulation is performed including thewhole electrical network at EMEC with the objective ofobtaining both the inrush current and the under-voltage valueprovoked by that current.All simulations have been carried out considering theworst connection conditions that means both, zero voltage inone phase and the maximum residual flux at the moment oftransformer energization.
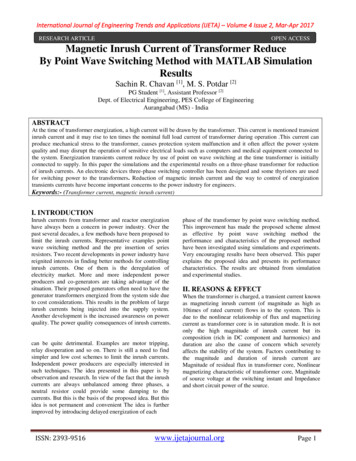
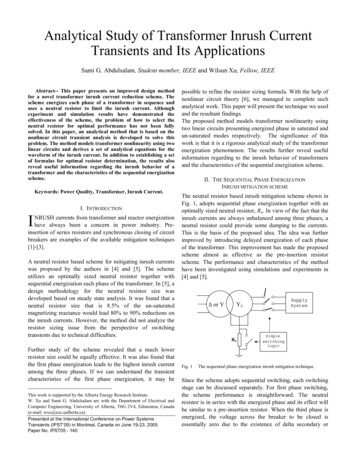
Approximated model with the parameters shown inTable 7. Three-phase transient model. In this model the 4windings transformer has been modeled as a DYthree-phase transformer using the HV windingparameters (winding 1) and one of the LV winding(690V) parameters (winding 2). The parameters forthis model can be seen in Table 8. Transient single-phase equivalent model modeledusing the HV winding (winding 1) and the one of theLV winding (winding 2) parameters.TABLE 7: PARAMETERS FOR THE SIMPLIFIED TRANSFORMER MODEL1LA 0.4BmRCC 0.007Bs 1.25ψ 1.554Br 0 - 11cos θs -0.25Esource is lower than 5 times the rated current. The inrushcurrent when energizing the transformer at EMEC facility willreach lower values than those obtained in this study.The wave form of the inrush current for the differentmodels three-phase and monophasic can be seen in Fig. 5. A. Inrush currentIn this section, the inrush current results based on the threemodels are shown: Fig. 4. Values obtained with different models for the maximum peak currentduring the energization of the transformerTABLE 8: PARAMETERS FOR THE PSCAD TRANSIENT MODEL2.1Rated Power (MVA)Rated Voltage 11kV/690VDYnConfiguration0.0267Leakage reactance (pu)0.00146No-load losses (pu)0.003Copper losses (pu)0.4Air core reactance (pu)1Knee voltage for the saturation curve (pu)0.3Magnetizing current (%)1.1Inrush decay time constant (s)0-1Remanent flux (pu)-0.25cos θsWith reference to the LV winding selected for thesimulations, it has been observed that the results don t varysignificantly when another LV winding is chosen to model thetransformer behavior.All the simulations have been carried out supposing thatthe transformer is connected against an ideal zero impedancesource or ideal source. The main objective of the simulationsis to establish the maximum value of the inrush current as wellas validate the models in a certain way.The inrush current calculation results for different valuesof residual flux can be seen in the Fig. 4. As can be seen, theresults show high concordance between the single-phaseequivalent and the simplified models. Due to the existence ofthe triangle winding, the maximum pick value of the inrushcurrent for the three-phase model is slightly lower (between10 to 25%), which is usual for this type of transformers [7].Based on the simulations carried out, it is possible toconclude that the maximum peak value of the inrush currentwhen connecting the transformer to an ideal zero impedanceFig. 5. Inrush current waveform for the three-phase model (Phase A, B andC) and the single phase model (remanent flux 1 pu)B. Inrush current at EMECIn this section, the electric network at EMEC is modelled.This model include: the equivalent circuit of the distributionnetwork at 11 kV level and the cables between the test berthsand the substation onshore. The single line diagram of thenetwork used to carry out the simulation and the mainparameters can be seen in the Fig. 6.The electrical network at 11kV level has been modeled bymeans of the Thevenin equivalent circuit using the shortcircuitpower data given by EMEC.Subsea cables have been modeled by using the pi model(series impedance with parallel capacitance). It has beenobserved that the influence of the cable series impedance incomparison with the transformer impedance and the networkshort circuit impedance doesn t affect significantly to theresults.Finally, according to Sections C and A, the Magallanestransformer has been modeled by means of a two windingthree-phase transformer. In order to consider the worst caseused for the remanent flux it was set to 0.85pu [4].
EMECSubstationScc 30-46 MVAZcc 0.22-0.33 puSubseaCableLong. 2-4 kmZ 0.01-0.03 puXcap 169-85 puMagallanesGeneratorSn 2.1 MVAZcc 0.131-0.199 puvoltage depression values lower than 3% it would benecessary that the short circuit power at the 11KV connectionpoint to be higher than 60 MVA.In order to reduce the inrush current, different method canbe used: pre-insertion resistors of pre-magnetization,synchronized breakers Sbase 4 MVAFig. 6. Main parameters and scheme for the complete modelDuring simulations, it has been supposed that theMagallanes transformer is energized at the moment t 0.2seconds, provoking current transients (inrush current) andvoltage transients (under-voltage) as shown in Fig. 7. 11 kVͶǤͲͲ ǤͷͲ ǤͲͲ Ȁ αʹǤʹ Ȁ αͳǤ ͻʹǤͷͲ αͶ Ǥʹ ǡ Ȁ αʹǤʹ α ͷ ǡ Ȁ αͳǤ ͻʹǤͲͲͲʹͲͶͲ ͲͺͲͳͲͲ ̷ ͳͳ ȋ Ȍ Fig. 8. Peak maximum value for different values of shortcircuit power andX/R ratio at the 11 kV level (marked values are those given by EMEC).ͲǤͻ ͲǤͻͷͲǤͻ Ȁ αʹǤʹͲǤͻͳ Ȁ αͳǤ ͻEMECDatosͲǤͺͻ αͶ Ǥʹ ǡ Ȁ αʹǤʹͲǤͺ α ͷ ǡ Ȁ αͳǤ ͻͲǤͺͷAs the short circuit power at the point of common couplingat 11kV is the parameter whose variation has the greatestinfluence on the inrush current, several simulations have beencarried out to determine this dependence with the followingvalues: Maximum peak value of the inrush current in phase(as shown in Fig. 8) Minimum value of the RMS voltage between phasesat the point of common coupling in the EMECsubstation (as shown in Fig. 9) Maximum voltage drop at the point of commoncoupling in the EMEC substation (as shown in Fig.10).The inrush current peak value has a maximum value from3.4 to 3.7 times the rated current of the transformer when theEMEC network conditions are taken into account.Consequently, the voltage depression at the point of commoncoupling varies from 4% to 5.4% of the nominal voltage.By analyzing the results it can be concluded that thevoltage depression value is higher than the 3% of the nominalvoltage required in the Engineering Recommendation P28 fortransients with a maximum starting frequency of 750 seconds.This value is below the limits for cases of infrequent startingwhich is rated at 6% of the nominal voltage. In order to getͲʹͲͶͲ ͲͺͲͳͲͲ ̷ ͳͳ ȋ ȌFig. 9. Minimum voltage value for different values of shortcircuit power andX/R ratio at the 11 kV level (marked values are those given by EMEC).ͳʹΨ ΨFig. 7. Voltage and current during the energization of the transformer(Network shortcircuit power 46.2 MVA). Ȁ αʹǤʹͳͲΨ Ȁ αͳǤ ͻͺΨ αͶ Ǥʹǡ Ȁ αʹǤʹ α ͷ ǡ Ȁ αͳǤ ͻ ΨͶΨʹΨͲΨͲʹͲͶͲ ͲͺͲͳͲͲ ̷ ͳͳ ȋ ȌFig. 10. Maximum voltage drop value for different values of shortcircuitpower and X/R ratio at the 11 kV level (marked values are those given byEMEC).C. Effect of remanent fluxIn this section it is analyzed the influence of the remanentmagnetization flux supposing the worst short circuitconditions provided by the Distribution Network Operator. Ashortcircuit power equal to 30.3 MVA at 11kV level has beenconsidered for this purpose. As a result, the maximum valuesfor the inrush current peak and voltage depression have beenobtained, as shown in Fig. 11 and Fig. 12.
starting frequency of 750 seconds. This value is belowthe limits for cases of very infrequent starting which israted at 6% of the nominal voltage. To achieve voltage depressions lower than 3% ashortcircuit power of at least 60MVA would benecessary. When the remanent flux is near to zero, the voltagedepression values are lower than 3% for a shortcircuitpower equal to 30.3MVA. According to this, the useof pre-insertion resistors of pre-magnetization wouldbe very useful in order to reduce inrush currents.Fig. 11. Maximum peak current for different remanent flux values (Scc 30MVA @11kV)ͺǤͲΨ Ψ ǤͲΨACKNOWLEDGMENTThe authors would like to thank the personnel of EMECfor their contribution and for their accessibility to the technicaldata of the test site. ǤͲΨREFERENCESͷǤͲΨ[1]EMEC, “The European Marine Energy Centre LTD (EMEC).”[Online]. Available: http://www.emec.org.uk/. [Accessed: 14-Apr-2016].[2]System Utilisation Consultancy Group, “EngineeringRecommendation P28: Planning Limits for Voltage Fluctuations Caused byIndustrial, Commercial and Domestic Equipment in the United Kingdom,”Electricity Council Engineering Management Conference. 1989.[3]M. Salimi, A. M. Gole, and R. P. Jayasinghe, “Improvement ofTransformer Saturation Modeling for Electromagnetic Transient Programs,”in International Conference on Power Systems Transients, 2013, pp. 1–6.[4]Manitoba HVDC Research Centre Inc., “Applications ofPSCAD/EMTDC.” Manitoba.[5]Manitoba-HVDC Research Centre, “USER’S GUIDE: EMTDC(v. 4.7).” Manitoba, pp. 1–248, 2010.[6]J. E. HOLCOMB, “Distribution Transformer Magnetizing InrushCurrent,” Trans. Amer. Inst. Elect. Eng. (Power App. Syst.), vol. 80, no. 3,pp. 697–702, 1961.[7]N. Chiesa and H. K. Høidalen, “Novel Approach for ReducingTransformer Inrush Currents: Laboratory Measurements, AnalyticalInterpretation and Simulation Studies,” IEEE Trans. Power Deliv., vol. 25,no. 4, pp. 2609–2616, 2010.ͶǤͲΨ Ǥ ȋ ȌͲǤͺFig. 12. Maximum voltage drop for different remanent flux values (Scc 30MVA @11kV) Considering the hypothesis above, in order to keep thevoltage depression lower than the P28 requirements, theremanent flux should be nearly null when energizing thetransformer. Supposing this, the maximum peak value of theinrush current would be 1.65 times the nominal current andthe voltage depression would remain lower than the 3%.VI. CONCLUSIONSThe aim of this paper is to analyze the under-voltagevalues at the point of common coupling (11kV level of theEMEC substation) related to the inrush current of thetransformer to be installed in the Magallanes Project hydrogenerator. The main results obtained in the simulations are: The maximum peak value of the inrush current whenenergizing the transformer and supposing the worstconditions, i.e. a zero impedance power source, islower than 5 times the rated current. The maximum peak value of the inrush currentsupposing it being installed at the EMEC facilitywould be between 3.4 and 3.7 times the rated current. The voltage depression at the point of commoncoupling would be between the 4% and the 5.4% of thenominal voltage. The voltage depression value is higher than the 3% ofthe nominal voltage required in the EngineeringRecommendation P28 for transients with a maximum
characteristic of the transformer have been provided by the manufacturer and are illustrated from Table 3 to Table 5. IV. TRANSFORMER MODELLING AND INRUSH CURRENT CALCULATION A. To carry out the calculation of the energization inrush current, a tra