Transcription
NASATP1012c. 1NASA Technical Paper 1012,'An Optical Profilometerfor Spatial Characterizationof Three-Dimensional SurfacesW. Lane Kelly IV, Ernest E. Burcher,and Milton W. Skolaut, Jr.SEPTEMBER 1977i
TECH LIBRARY KAFB,0134300NASA TechnicalPaper1012An Optical Profilometerfor Spatial Characterizationof Three-Dimensional SurfacesW. Lane Kelly IV, Ernest E. Burcher,and Milton W. Skolaut, Jr.Langley Research CenterHarnpton, VirginiaNational Aeronauticsand Space AdministrationScientific andTechnicalInformation Office1977NM
SUMMARYA technique is described for obtaining spatial characterizationof threea noncontactdimensional surfaces with uniform near-Lambertian reflectance usingoptical profilometer. The design concept and system operationare discussed, anda preliminary evaluationof a breadboard systemis presented to demonstrate thefeasibility of the optical profilometer technique. Measurement resultsare presented for several test surfaces; and to illustrate a typical application,results are shown fora cleft palate cast used by dental surgeons.Finally,recommendations are made for future developmentof the optical profilometer technique for specific engineeringor scientific applications.INTRODUCTIONIn manufacturing, engineering, and medical research, spatial characterization of a three-dimensional surface is often required. An electromechanicalprobe which rides on the surfaceof the sample is usually used. Occasionally,a noncontact methodis required to prevent damage to the surface to be measured.Optical techniques can be used to provide noncontact surface characterization. Drawing contour lines from a pairof stereo pictures with the aidof adrawing machineis most commonly used, but this methodis not direct and requiresexpensive instruments. Another optical technique, called moire/ topography(ref. I ) , produces a contour line system on the sample surface. These opticaltechniques require additional processing to convert the contour lines to surfacedepths in digital form when the surface characterizationis to be storedor manipulated in a computer.The purpose of this paper is to describe a relatively simple and inexpensiveelectrooptical technique which provides digital information for the spatial characterization of three-dimensional surfaces. The optical profilometer concept consists of an optical system and photodetectors which observe the change in theenergy distribution of an image spotof light as a functionof the depth of thesample surface at the measurement point. The sample surfaceis scanned to provide measurement information over the complete surface. Changes in the outputsignal due to variations in surface slope, surface reflectance, and lamp intensity are greatly reduced by taking the ratio of the sample photodetector outputto a reference photodetector output. Since the profilometer observes thereflected light from the test surface, its isuselimited to sample surfaceswhich have a uniform near-Lambertian reflectanceor which can be temporarilycoated.A breadboard optical profilometer has been developed and tested to demonstrate the feasibilityof the optical profilometer concept. Measurement resultsare presented for several test surfaces to illustrate the operation and performance. To illustrate a typical application, measurement results are presented fora cleft palate cast used by dental surgeons to inaidthe surgical reconstruction
of the palate. In addition, recommendations are made for further developmentofthe instrument concept to meet specific engineeringo r scientific requirements.SYMBOLSddepth, IPTION OF CONCEPTAs shown in figure1, the basic configuration of the optical profilometerconsists of an electrooptical system, a microprocessor, and a data recorder.Electrooptical SystemThe electrooptical system provides an output voltage which is a functithe sample depth at the point of measurement.A light source is imaged by thelens into a spot on the sample surface. As the surface depth increases, theimaged spot becomes defocused and the spot size increases. The spot is reimagedby the lens and directed bya beam splitter to two photodetectors to provide sample and reference signals.The sample detector, which acts as a field stop, is sufficiently smallview only the center portion of the spot and hence to observea decrease inenergy as the spot becomes defocused because of changes in sample depth. Theenergy reflected by the sample surface and observed by the sample detectorisalso dependent upon the illumination scattering function, which describes theangular dependence upon viewing and illumination geometry.2
Since the output voltage of the sample detector depends not only on the suface depth but also on the surface slope, a reference detector is used to obserthe entire spot. A field lens is positioned to image the imaging lens onto thereference detector. The reference detector, therefore, collectsall of theenergy of the defocused spot which is reflected into the solid angle subtendedby the imaging lens. This configuration almost entirely removes the referencedetector's dependence on surface depth but does not affect its dependence on theaverage surface slope and reflectivity. By dividing the sample detector outputby the reference detector output, the dependence on slope and surface reflectivity can be removed, since both detectors have the same viewing axis. The voltagedivider output can be describedaswhere Vs is the sample voltage, Vr the reference voltage, 0 the anglebetween the surface normal and the optical axis, d the depth, and p the surface reflectivity. The output of the voltage divider is then amplified, digitized, and read by the microprocessor.MicroprocessorThe microprocessor servesas the control unit, provides data storage, performs minimal data processing, and formats the output for the data recorder.Asimple 4-bit microprocessor with4000 k b i t word storage was used to provide aneconomical, yet flexible, control unit. Commands to the microprocessor areentered through a standard teletype, although several push-button switches wouldbe sufficient. The microprocessor sends control signals to two stepper motorswhich drive gear assemblies to move the sample platform alongX- andtheY-axisduring data acquisition.The microprocessor is used to command the analog-to-digital conversion(8 bits) and to read and store the digital data for each scan line along theX-axis. Data obtained from a scan line are compared with the data obtained during calibration to determine the appropriate output for representing surfacedepth at each measurement point. After each X-axis scan, digital data are outputto the data recorder.The microprocessor can also be used to automatically scan a calibration surface and store the data for comparison with subsequent sample data. This meansof simple data processing is used since the variation of voltage with depth isnot linear.Data RecorderThe electrooptical system and the microprocessor provide data pertaining tothe sample surface in several forms available for recording. Output data can berecorded in analog form by recording the motor step commands (forX and Yposition) and the output voltage of the voltage divider( Z information). Digital data can be recorded from the microprocessoras 8-bit raw dataor, after3
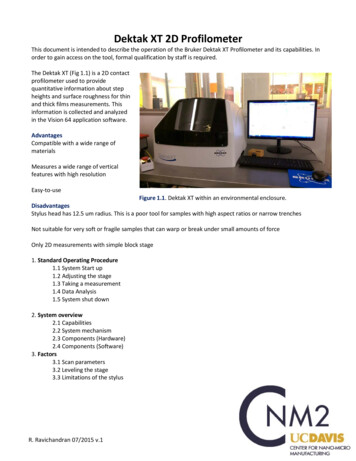
comparison with calibration data,as depth information. The breadboard systemdescribed in this paper compares the raw data with calibration data and asan alphabetical character to be typed on the teletype. More sophisticated outpdisplay features, suchas three-dimensional contour plots, surface areas, and suface slopes, could be obtained with additional storage and computational capity in the computer control unit.DEVELOPMENTAL SYSTEMA breadboard system was fabricated to evaluate the optical profilometer ccept as a technique for generating three-dimensional data for surface characzation. The breadboard system is shown in figure2, and pertinent design parameters are listed in tableI.OperationCalibration of the optical profilometeris initiated by a command from theteletype to the microprocessor. The sample platform is then automatically movedto position the calibration surface in the optical path. The calibration surfacconsists of a wedge which provides a linear change in depth along the AsX-axidata are taken, the sample platform is automatically moved in equal incremenalong the X-axis. These digital data, which are a function of surface depth, astored in tabular form by the microprocessor. With this calibration procedure,the slope of the calibration wedge determines the profilometer depth rangeresolution within the operating limits.Upon completion of calibration, the sample platform is automaticallyreturned to the initial position. Manually, the operator vertically positionsthe sample platformso that the highest point on the sample is slightly belowthe maximum calibration height. Data acquisitionis initiated by a teletypecommand, and the platform is moved in equal increments along the X-axis afteeach data point is taken and storedby the microprocessor. At the completionof each scan line the sample data are compared with the calibration data toselect an output character to represent vertical heightfor each measurementispoint. Output data are displayed for the entire scan line, and the platformreturned along the X-axis and incremented along the Y-axis for the next lineThe platform is returned to the initial position at the completionof all dataacquisition.The format selected for output data on the teletype consists26ofthecharacters of the alphabet with A representing the highest depth interval andZthe lowest. The symbol @ is used to indicate surface depths above the highest( . is used to indicate depths below the lowestcalibration point and the periodcalibration point. The surface depth interval represented by a character isdetermined by the slope of the surface used for calibration. Only26 calibrationpoints are needed to display the output data in this form. Additional displayoptions include printing only a single line of output characterso r printing boththe calibration and the sample datain hexadecimal format.4
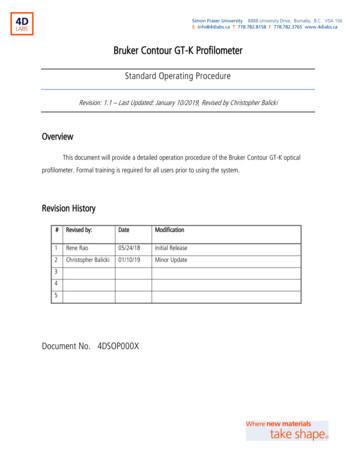
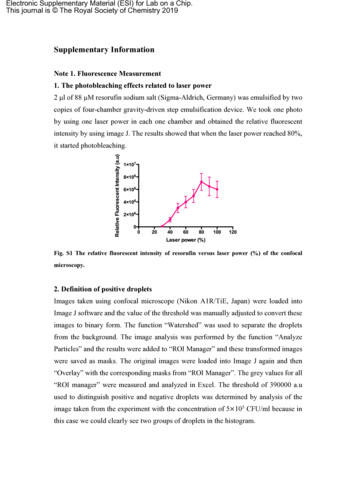
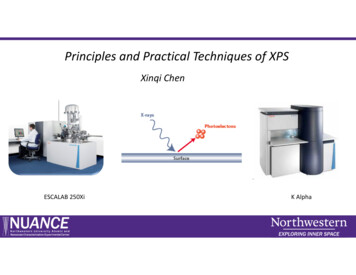
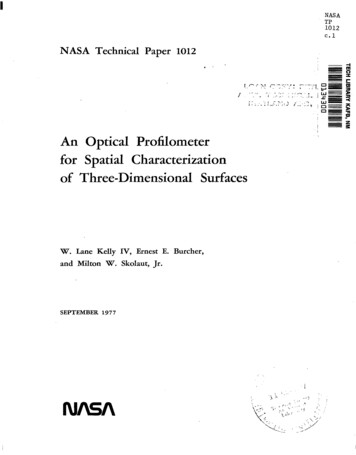
EvaluationData were obtained from several test surfaces to demonstrate the operationand evaluate the performanceof the breadboard optical profilometer. Figure3shows a plot of digitized voltage divider output for a calibration wedge providing a depth range of approximately14 mm. The output voltageis a nonlinear function of depth, with diminishing depth resolutionas the surface depthincreases. This nonlinear function is essentially linearized by the microprocessor by storing calibration data for equal depth intervals in a look-up tableTo define an approximate depth resolution limit for the breadboard electrooptical system, the wideband root-mean-square noise voltage was measured at theoutput of the voitage divider and found to1.9bemV. A s evident from thevoltage-depth curve shown in figure3, the poorest depth resolution occurs nearthe maximum depth, where the slope can be approximated0.165asV/mm. For a minimum analog signal-to-noise ratio 4,of the minimum detectable depth intervalwould be on the orderof 0.05 mm. Higher analog signal-to-noise ratios wouldoccur for smaller surface depths, and better depth resolution could be obtainedby reducing the total depth range. These resultsare, of course, dependent uponthe particular lens and apertures used in the breadboard system and could be modified by designing the optical system for a specific application.To test the performance of the breadboard system, the calibration wedgesdescribed in tableI1 were used as sample surfaces. WedgeC, which providesdepth resolution of0.53 mm over a 14-mm range, was used for calibration, anddata were obtained for wedgesA and B as sample surfaces. The sample platformwas lowered 1.9 mm for wedge A and 3.8 mm for wedgeB to place the sample surfaces in the’approximate center of the depth range. Output data, plotted infigures 4 and 5 , accurately characterize the sample surfaces. For actual operation using sample surfaces with small depth variations, more precise resultscould be obtained by using the appropriate calibration wedges. On bothwedges,the same line along the X-axis was scanned several times with identical outputcharacters produced on the teletype, indicating excellent measurementrepeatability.Data were obtained from a sectiona ofsphere with a known radius(33.1 mm)to verify that the profilometer output was not adversely affected by variationsin surface slope. Initial results, which did not reconstruct the sphere radiusto the accuracy expected, indicated that the slope dependence was not effectivelbeing removed. Further investigation revealed that both photodetector outputscontained offset voltages. While the sample detector offset was considered negligible, the reference detector offset was significant. The reference detector offset voltage resulted from radiation reflected from the surfaces of the severalelements in the imaging lens. Since this offset voltage was not a function ofsurface slope, proper operation of the division function (I))(eq.was notpossible.To provide a temporary solution, the reference detector offset voltage, dueto the surface reflections of the lens, was measured.A constant voltage equalto the offset was subtracted from the reference signal by an operational amplifier in a subtraction mode.5
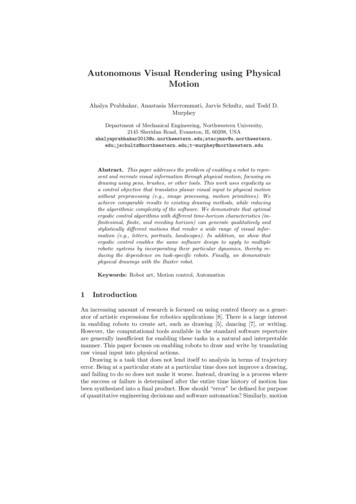
After completing t h i s m o d i f i c a t i o n , t h e p r o f i l o m e t e r was recalibrated andmeasurements were r e p e a t e df o r t h e s p h e r i c a ls u r f a c e .O u t p u tdata f o r t h e e n t i r es u r f a c e are shown i n f i g u r e 6. I n f i g u r e 7 , t h e c e n t e r l i n e o f o u t p u tdata i sp l o t t e d t o compare w i t h a c i r c u l a r arc o f t h e same r a d i u s as t h e s p h e r e . Dataare p l o t t e d as b l o c k s w i t h d i m e n s i o n s e q u a l t o t h e s a m p l e i n t e r v a l a l o n gt h e XandZ-axestoallowdirectcomparisonbetweenthe outputresultsandthe a c t u a ls u r f a c e c h a r a c t e r i s t i c s . The larger depthvaluesapproachtheworst-casemeasurement c o n d i t i o n sf o rd e p t hr a n g e ,s l o p ec h a n g e ,d e p t hr e s o l u t i o n ,a n dsmall s i g n a lo u t p u t f o r t h e breadboarddesign.The closeagreementbetweenoutputdata andthe actual surface illustratest h e f e a s i b i l i t y o f t h e o p t i c a l p r o f i l o m e t e r techn i q u ef o rc h a r a c t e r i z i n gt h r e e - d i m e n s i o n a ls u r f a c e s .To i l l u s t r a t e a t y p i c a l a p p l i c a t i o n ( r e f . 21, d a t ap a l a t e cast, which is used by d e n t a l r e s e a r c h e r s i nthef a c i a l d i s o r d e r s .C a l i b r a t i o nwas performed w i t h wedgei n f i g u r e 8 a l o n g w i t h a photographof t h e c l e f t p a l a t ewere o b t a i n e d f o r a c l e f tsurgicalrepairofcranioC , and r e s u l t s are showncast i n f i g u r e 9.It should be noted t h a t t h ep e r f o r m a n c eo ft h e breadboarddevelopmentalsyst h e o u t p u t data; t h e r e f o r e , t h et h e l i m i t i n g p e r f o r m a n c e of t h e e l e c t r o -tem was l i m i t e d by t h e 2 6 - c h a r a c t e rf o r m a to fr e s u l t s i l l u s t r a t e d here do n o t r e p r e s e n topticaldesign.POTENTIAL IMPROVEMENTSA breadboardsystem was developed t o d e t e r m i n e t h e f e a s i b i l i t y o f t h e o p t i c a l p r o f i l o m e t e rc o n c e p t .D u r i n gt h ed e v e l o p m e n t ,s e v e r a ld e s i g nareas werer e c o g n i z e d i n which performancecould be improved or t h e s y s t e m a d a p t e d t o meets p e c i f i cr e q u i r e m e n t s .O p t i c a lS y s t e mThe d e p t h r a n g e c o u l d b e i n c r e a s e dor decreased f o r a p a r t i c u l a r a p p l i c a t i o nby s e l e c t i n g t h e l e n sf o c a ll e n g t ha n dl e n sdiameter. To t a i l o r t h e o p t i c a lmade r e g a r d i n gd e s i g nt oa c h i e v e a s p e c i f i cd e p t hr a n g e ,t r a d e - o f f ss h o u l db et h e s i z e a n dt y p e so fa p e r t u r e sf o rt h e l i g h t s o u r c ea n db o t hd e t e c t o r s .C o n s i d erable f l e x i b i l i t y e x i s t s i n d e f i n i n g t h e s i z e a n d i n t e n s i t y d i s t r i b u t i o n o fthed e f o c u s e d s p o t , which a f f e c t t h e l i n e a r i t y o f t h e o u t p u t v o l t a g e as a f u n c t i o n o fdepth and t h e s p a t i a l r e s o l u t i o n on t h e s a m p l es u r f a c e .A permanentand more a c c u r a t e s o l u t i o n t ot h e problemofvoltageoffsetsdue t o f r o n t s u r f a c e r e f l e c t i o n s f r o mt h e l e n s is provided by a n a l t e r n a t e o p t i c a l d e s i g n . The l i g h t s o u r c es h o u l d b e moved t o the sample s i d e o f t h e imagingl e n st op r e v e n tthe f r o n ts u r f a c er e f l e c t i o n sf r o mr e a c h i n gthe detectors. Thiscan be accomplished by u s i n g a s e c o n d l e n s t o image t h e l i g h t sourceon t h e samp l e a n d by u s i n g a beam s p l i t t e r i n p l a c e o ft h e f o l d i n g m i r r o r , as shown i nf i g u r e 10.6
Microprocessor and Electronic SystemThe signal-to-noise performance may allow additional encoding levels to beused to improve system resolution and precision. System performance may improveby performing the division digitally with the microprocessor to avoid errors dueto analog offsets in the analog voltage divider. Since the step interval alongboth the X- and the Y-axis is under microprocessor control, decreasing the stepinterval between data samples, which increases sampling frequency, can be investigated to improve the precisionin measuring surface characteristics. Additional microprocessor capability would allow surface areas and slopes to be caculated, and for industrial engineering applications, the microprocessor couldformat the digital output data to interface readily with digitally controlledmachinery.OutputDataDisplayThe teletype used with the breadboard system represents the simplest formof output device which could be readily interfaced to a microprocessor.A simplemicroprocessor could also use a line printer, magnetic tape, paper tape, cathoderay tube (CRT) display,or a digitally controlled plotteras an output displaydevice. All of these options would display data with higher resolution in a manner particularly suited to the user.CONCLUDINGREMARKSAn optical profilometer concept for obtaining spatial information for characterization of three-dimensional surfaces has been investigated. The basic concept utilizes the change in the energy distribution of an imaged spot of lighthe image moves out of focus to providea photodetector output voltage which is afunction of surface depth. Variations in the output signal due to changes in surface slopeor reflectivity and light source intensity are greatly reduced by taking the ratio of the sample photodetector output to a reference photodetector oput. Operation of a breadboard profilometer, which uses a microprocessor tocontrol sample position, calibration, and simple data processing, was described.A preliminary evaluation of the profilometer was performed by obtainingdata for several test surfaces. Depth resolution0.53of mm over a14-mm rangewas obtained with the breadboard developmental system which was limited by the26 output characters. Measurements of noise voltage indicate that depth resolutions approaching0.05 mm over a 14-mm depth range for a desired signal-to-noiseratio of 4 appear feasible with the breadboard optical system. Improved depthresolution could be achieved by operating over a smaller depth range. Datawhich accurately characterized a spherical surface were obtained to illustratethat variations in surface slope do not significantly affect system performance.Future developmental work on the optical profilometer should consider( 1 ) tradeoffs within the optical design to optimize the depth resolution and range,( 2 ) separation of the optical path of the light source from that of the detec7
and(3)expansiond i s p l a y of d a t a .of t h e m i c r o p r o c e s s o r c a p a b i l i t y t o i m p r o v e t h e p r o c e s s i n g a n dministrationHampton, VA 23665J u l y 2 1 , 1977REFERENCES1. Takasaki,H. : MoireTopography.Appl. Opt. , v o l .9 , no. 6 , togrammetricAnalysisAbnormal Palates. h e r . J. Orthod.,vol.60,no.8of Casts of Normal and1 , J u l y 1971, pp. 1-18.
TABLE I.- DESIGN PARAMETERS FOR BREADBOARD 6.5.6.4. . . . . . . . . . . . . 0.31. . . . . . . . . . . . . . 0.05.UDT PIN-5.HP 5082-4205.Intellec 4.0.079.0.13. . . . . . . . . . . . . . . 0.053.5.5.5.5.1.4F o c a ll e n g t ho fi m a g i n gl e n s ,cmDiameter of i m a g i n gl e n s ,cmAperture diameter of r e f e r e n c ep h o t o d e t e c t o r ,cmA p e r t u r ed i a m e t e r of s a m p l ep h o t o d e t e c t o r ,cmR e f e r e n cpeh o t o d e t e c t o rSample p h o t o d e t e c t o rMicroprocessorcmSample i n t e r v a la l o n gX - a x i s ,Sample i n t e r v a al l o n gY - a x i s ,cmSample i n t e r v a la l o n gZ - a x i s(wedge C ) , cmcmRange alongX-axis,Range alongY-axis,cmRange a l o n g Z-axis, cmTABLE 11.- CALIBRATION WEDGESWedgeDepthrange,cmDepth i n t e r v a l p e ro u t p u tc h a r a c t e r , cmI IIA0.450.018B.91.036.I8.053.27C1.40.0919
10
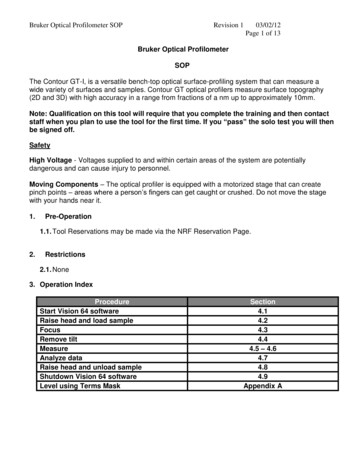
Figure 2.- Breadboard optical profilometer.
-2- Y-x-w-v-u-T-s-R-Qcn-P 6 L OUTPUT DATAFigure 3.- Profilometer output data (digitized output voltage)as a function of depth.12E
-214- Y-x-W12-v-u-T-s10-R-Q-P8-0B-Ng23sPIz-M PIwCI2w"LE -w2-K"J- I'1-H-G-F-Ei-D-c-BI. "1I1IIIiIII! . !IIII23456789CDEABI,FAHEXADECIMAL OUTPUT DATAAFigure 4.- Profilometer output data (digitized output voltage) for wedgewith wedge C used for calibration.13
-2-Y-X-W-V-U-T-S-R-Qcn-p2E43su-N s"E-0niw-L-KnisE: 4-J- I-H-G-F-E-D-C-B1"AFHEXADECIMAL OUTPUT DATAFigure 5.- Profilometer output data (digitized output voltage) for wedgeBwith wedge C used for calibration.14I
Figure 6.- Profilometer output data for sphericalsurface.15
X-AkIS10ArII[)ISTAWCE,II1cm3I254IIIII0BC-Dk I!!!!!!!!!!!!!!!!!IULLlIX-AXIS!!!!!!!!!!!!!STEP INTERVALSF i g u r e 7.- S i n g l e scan l i n e through c e n t e r of s p h e r i c a l s u r f a c e .!!!l2
.zyxw vuuvwwY.ZVVXZ.QMLKKJJJJKKKLLLLMNOQSUZ.RZYYYYYZ. . .YTSSSSSSSRSRPQRRSTW. . .oo .o. . *.USSTTTV.YOLKJJJII,IJJJJKLKLLMNOPQSW.TSSSSSTV. . MKJIIJJJKKLKKMLMMMNOOPRT . .SRSSSSSTW.YSOLKKKKKLMMLLLMNNOOOOPQRU.*.ZYYYXYY. .RRRRRSSTUW.WSPNNNNOONMMMMO RRQQQRSV. . .RRRRRRSTTUW. *. .VTSRQPOOOPTUUTTTUVX. ZYXWWXXWWX. .QQRRRRSSTTUVX .*.WVTTSTWY. . . .ZXWWVVWWWWWZ.o .QQRRRRRSSfTTUW. . XW VVY.oooo.YXWWVVVVWVVVY.o. . .o.YPPQRRRRSSSSTTUWY.YVVVVXZ. o.o . .YWWWVVUUUVVVVWZo. .WOOOPPPQQQQRQRSSPMHJKNQSWWVWXY. . .ZXWVWVVVUUUUUUUUWY . . TONNOOOPPPPOOPOLGEFHJLQSWXVWXYY VTUY ZYW VVVVUUUUTTUUUVY UTTTUUUVX o TTTTUTUV2 .PMLLLLLKIIHCAABCEHJKKLNRTWYWWXYZYSQ MLJIHHHK KMPTY.YXXYYZURPONMNLKJIHGFGHOTRSSSTUTUZ. SRRSTTUY .KJJJIIIIFCBBCDFHJLKLORV.ZYY. .WSPNMMNLKIHHGGFGJSTSRSSSTY.JIIIHHIGDCCDDEG LLLNQ.TZ.YYY.UQONMMNLJIHGGGGIPSSQRRRTY. IHHGGGHFDDEEEGIKLLOPSX ZYYY o WTPOMMNNKIIHGGHJOTPPQQRS IGHGGGGEEEEFFHJKLNPRU ZZZZ ZUSPONN MJIHHIKKN PP.GFFFFGFEEEFFGIJLLOQSV ZZZ . WSRPONNNLJIIJKLMQOON OQUe.eFFEEEEFDDDFGIIKLNOPSY .ZZY.WUSRONMMMKJJJKKLPNONMPSV. VEFDDEEDEDDFHIIJLNNOQY ZZZY XTTROONMMLKKKKMNOMMLNS. .TEDDCCCEEEDFGHJKNMMOQX.ZYZYZY . . .XUUPOONMMMKKMNLLMLLPSUW. . .0.0'. . . . . . . K I D C B B B A A B D D I I J K M L N Q Y . Y Y Y Y Y Z . . . . QOMLKJHFFFFFEEEFHM.YWWX.XPONMLLKKKKKKKLNRTWY. .VTRPONMLKIHGGGGGHNZYWWX.o YRPONNMLKJJJKK PQSUWY.o.o. .ZWUTRQPOONMLJIILS.YVUW.i.SONPPNLJJJKMOP RSTVXZ o .oo.e. ZXWVUTSSRQPOOY.ZVUUVY.TML KKLLMNOPQRSTUVXY . . . . . .ZYXWWVUTWYYWUUUVX.Y MMLMNPQRSSTUUVWYZ.o oo.o. .zxwvuvY zzYxwwY. . .ZWWWVTUUUWZ.WRRRSTUUVVWWXYZ.o. . .o o o. .?Figure 8.- Profilometer output data for cleft palate cast.17
L-'(o-'(oyyFigure 9.- Photograph of cleft palate cast.18
LightsourceS a m p l ed e t e c t o r7R e f e r e n c ed e t e c t o rLens1b a frfle Light"""""Beam s p l i t t e reeX-axis motorrV o ldt ai vgied e r/I,/ motorY-axisr""AG a i na n do f f s e tc o n t r o l-A-D c o n v e r t e r*Microprocessor).4Printer""-"TeletypeFigure 10.- Improved optical design for optical profilometer.1
I .1. Report No.NASA TP-1012.3. Recipient's Cataol g No.2. T m e n t Accession No.5. Repon Date4. Title and SubtitleSeptember 1977AN OPTICAL PROFLLOMETER FOR SPATIAL CHARACTERIZATIONOF THREE-DIMENSIONAL SURFACES6. Performing Organization Code .-8. Performing Organization Report No.7. Author(s1W. Lane Kelly IV, Ernest E. Burcher, andMilton .-W. Skolaut,Jr.- . L-1170610. Work UnitNASA Langley Research CenterHampton, VA 23665-11. Contract orGrant13. Typeof 12. Sponsoring AgencyName . .No.Report and Period CoveredTechnical Paperand AddressNational Aeronautics and Space AdministrationWashington, DC 20546. -No.141-95-02-019. Performing Organization Name and Address-. .14. Sponsoring Agency Code"5. Supplementary Notes-. - . .-. -6. AbstractA technique is described for obtaining spatial characterization of threedimensional surfaces with uniform near-Lambertian reflectance using a noncontactoptical profilometer. The design concept and system operation are discussed, anda preliminary evaluationof a breadboard systemis presented to demonstrate thefeasibility of the optical profilometer technique. Measurement results are presented for several test surfaces; and to illustratea typical application, resultsare shown for a cleft palate cast usedby dental surgeons. Finally, recommendations are madefor future developmentof the optical profilometer techniqueforspecific engineeringor scientific applications. 7. Key Words(Suggested. ."-"18. Distribution StatementbyAuthoris))UnclassifiedOpticalSpatial characterizationProfilometerUnlimitedSubject Category 35I9. Security Classif. (ofthis-"".20. Security Classif. (of this p a g e )report1UnclassifiedUnclassified ."."." 19"" 3.50- -"*For sale by the National Technical information Service. Springfield, Vlrglnla 22161NASA-Langley,1977
National AeronauticsandSpace AdministrationWashington,20546SPECIALFOURTHCLASS MA1 LBOOKD.C.Postage and Fees PaidNational Aeronautics andSpace AdministrationNASA451FlUSMAILOfficial BusinessPenalty for Private Use, 300584 0 0 1 C l UD 7 7 0 8 1 9 S00903DSDEPT OF TBE A I R FCRCEAF WEAPONS L A E O B A T O R YATTN: T E C H N I C A L L I B R R R Y {SUI.)R I R T L A N D AFB N M 8 7 1 1 7mPOSTMASTER:If Undeliverable (Section 158Postal Manual) Do Not Return
tion of a three-dimensional surface is often required. An electromechanical . Optical techniques can be used to provide noncontact surface characteriza- tion. Drawing contour lines from a pair of stereo pictures with the aid of a drawing machine is most comm