Transcription
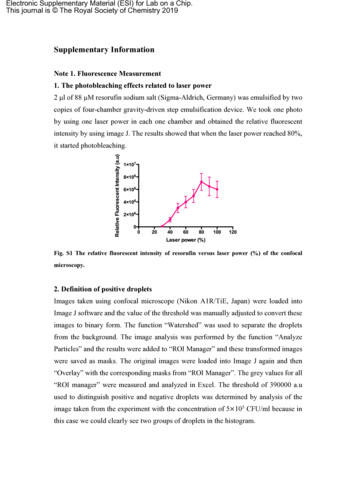
Electronic Supplementary Material (ESI) for Lab on a Chip.This journal is The Royal Society of Chemistry 2019Supplementary InformationNote 1. Fluorescence Measurement1. The photobleaching effects related to laser power2 µl of 88 µM resorufin sodium salt (Sigma-Aldrich, Germany) was emulsified by twocopies of four-chamber gravity-driven step emulsification device. We took one photoby using one laser power in each one chamber and obtained the relative fluorescentintensity by using image J. The results showed that when the laser power reached 80%,it started photobleaching.Fig. S1 The relative fluorescent intensity of resorufin versus laser power (%) of the confocalmicroscopy.2. Definition of positive dropletsImages taken using confocal microscope (Nikon A1R/TiE, Japan) were loaded intoImage J software and the value of the threshold was manually adjusted to convert theseimages to binary form. The function “Watershed” was used to separate the dropletsfrom the background. The image analysis was performed by the function “AnalyzeParticles” and the results were added to “ROI Manager” and these transformed imageswere saved as masks. The original images were loaded into Image J again and then“Overlay” with the corresponding masks from “ROI Manager”. The grey values for all“ROI manager” were measured and analyzed in Excel. The threshold of 390000 a.uused to distinguish positive and negative droplets was determined by analysis of theimage taken from the experiment with the concentration of 5 105 CFU/ml because inthis case we could clearly see two groups of droplets in the histogram.
Fig. S2 Histogram of fluorescence intensity. (a) 5 100 CFU/ml. (b) 5 101 CFU/ml. (c) 5 102 CFU/ml.(d) 5 103 CFU/ml. (e) 5 104 CFU/ml. (f) 5 105 CFU/ml. (g) 5 106 CFU/ml. (h) 5 107 CFU/ml. (Blue:Negative droplets, Pink: Positive droplets)Note 2. Three different designs with various angles of nozzle in single nozzle device.
Fig. S3 The comparison of the coefficient variance of the volume of droplets generated using singlenozzle devices with various different opening angles 𝜶 15 , 25 , 30 (A) The design of a singlenozzle device. (B) The 3D geometry of the 𝛼 15 device measured by Bruker ContourGT-K opticalprofilometer (Bruker, USA). (C) The snapshots with top views of the devices with droplets generated indevices with various opening angles 𝛼 15 , 25 , 30 , respctively The CV values presented below thesnapshots correspond to the level of droplet polydyspersity.Note 3 The characterization of four-chamber gravity-driven step emulsificationdevice1.Table S1. The protocol of using four-chamber gravity-driven step emulsificationdeviceNO.1StepsDescription4 closed needles (To close thesample inlets)2 open tube (oil outlet)
2Close the sample inlets3Fill the oil from oil inlet. Rotate thechip by 180 degrees to fill the oilreservoir.4Turn the chip back and still fillingthe oil until all the chambers filledwith oil.5Close the sample outlet
6Open the sample inlet and depositthe sample by pipetting7Open the oil inlet8Turn the chip to the verticalposition9Droplet generation
10The zoom to the device during theprocess of droplet generation11Droplet generation completed12Droplet chambers full of droplets13Close the oil outlet with the endsealed tubes
14Pour water to the Petri dish toprevent evaporation2. The depth of the channel measured by Bruker ContourGT-K opticalprofilometer (Bruker, USA)Fig. S4 The image with the profile of the device measured by Bruker ContourGT-K opticalprofilometer (Bruker, USA).3. The droplet generation from four-chamber gravity-driven step emulsificationdevice5 µl MH broth loaded in four sample inlet that emulsified within four chambers and thevolume of droplets were measured by image analysis from a recorded video.
Fig. S5 The monodispersity of droplet volume in each chamber. (A) The volumes of consecutivedroplets measured by image analysis. (B) The comparison of the size of the droplets in the beginningand the end of droplet generation process.4. The “Balloon” phenomenon when the viscosity is above 4 mPa s
Fig. S6 Balloon phenomenon observed when the viscosity was above 4 mPa s. (A) 4.8 wt% 20k PEGin TE buffer (4.03 mPa s), and 0.5 wt% 2M PEG in TE buffer (9.17 mPa s) emulsified in four-chamberdevice. (B) 45 wt% glycerol in water (4.04 mPa s), 56 wt% glycerol in water (6.83 mPa s), 65 wt%glycerol in water (12.18 mPa s), and 75 wt% glycerol in water (26.81 mPa s) emulsified in singlechamber device.5. Droplet instability with 1% surfactantFig. S7 Emulsion instability with external phase HFE 7500 containing 1 wt % surfactant with theoil outlets left open during incubation.Note 4. Estimation of depletion time of oxygenWe could estimate oxygen depletion time in droplets using parameters that can be foundin the literature [RSC Adv., 2015, 5, 101871]. The oxygen solubility in complexmedium is 0.2 mmol/L [RSC Adv., 2015, 5, 101871] and the average volume of thedroplets presented here is around 2 nl. Therefore, the number of oxygen molecules inthe single droplet equals 4 10-13 mole. In addition, the oxygen solubility in HFE 7500used here as the continuous phase is 100 ml/L [RSC Adv., 2017, 7, 40990-40995]. In
our device, one chamber contains 12 µl HFE 7500. Thus, there will be more than5.36 10-11 mole of oxygen in one droplet chamber. In one chamber, we assume wehave 65% of positive droplets (ca. 1300 droplets over 2000 droplets) so each positivedroplet will obtain 4.12 10-14 mole of oxygen from oil. Hence, each positive dropletcan obtain 4.41 10-13 mole oxygen from oil and the medium. Therefore, it would take6 hours for bacteria to completely consume oxygen present in droplets.The consumption of oxygen by bacteria by time:'()'* 𝑁(𝑡) 𝑂1(1.1)*𝐴3 (𝑡) 𝐴3 (0) 𝑂1 3 𝑁(𝑡)𝑑𝑡(1.2)The growth of bacteria by time:𝑁(𝑡) 𝑁3 𝑒 9*𝑘 (1.3); (1.4)* So, the remaining amount of oxygen is:𝐴3 (𝑡) 𝐴3 (0) 𝑂1?)9(𝑒 9* 1)(1.5)Where,A0(t): Amount of oxygen in droplet at time t;A0(0): initial oxygen amount in droplet;N(t): number of bacteria inside droplet at time t;Or: Oxygen uptake rate per single bacterium 0.9-23.1 mol kgDCW-1h-1;N0: initial bacteria number;td: E. coli doubling time 0.5 hourTable S2. Parameters used for calculation of oxygen depletion timeDry cell weight (DCW)2.78 10-16 kg/cellOxygen uptake rate0.9 23.1 mol kgDCW-1h-1Oxygen solubility in complex 0.2 mmol/LmediumOxygen solubility in HFE 7500 100 ml/L
Note 5. Calibration curves relating OD measurements (600 nm) versus platecounting in CFU/mlFig. S8 Calibration curves relating OD measurements (600 nm) versus plate counting in CFU/mlfor (A) E. coli (B) S. aureus (C) E. faecalis.Note 6. Fraction of positive droplets as a function of bacteria concentration for E.coli, S. aureus, and E. faecalisFig. S9 Fraction of positive droplets as a function of bacteria concentration for E. coli, S. aureus,and E. faecalis. The red line indicates the theoretical fraction of positive droplets. (Only dilutions thatare statistically relevant are shown in the plot)Note 7. The least squares fitThe least squares fit within the logarithmic axes is done by the guidance of ism/6/curvefitting/index.htm?reg fitting lines to semilog.htmLog-log line - Both X and Y axes are logarithmic, the correlation is𝑌 10B;CDE FGH IJKL *E1MED*Table S3. The statistic raw data obtained from GraphPad
Best-fit valuesStd. ErrorE. coliS. aureusE. 220.70340.6068tototo0.78410.80360.789495% Confidence YInterceptIntervalsSlopeNote 8. Broth microdilution method for determination of MIC on ampicillinagainst E. coli, cefotaxime against S. aureus, and ampicillin against E. faecalis106 CFU/ml bacteria (E. coli, S. aureus, and E. faecalis) was mixed with 32,16, 8, 4, 2,1, 0.5, 0 𝜇g/ml of antibiotics (ampicillin and cefotaxime) and incubated at 37 for 20hours according to the standard broth dilution methods for MIC test from CLSI3. Forvisibility and imaging, we added alamar blue (Sigma-Aldrich, Germany) in each welland waiting for 2 hours for the color change. The MIC value for ampicillin against E.coli is 4 𝜇g/ml, for cefotaxime against S. aureus is 1 𝜇g/ml, and for ampicillin againstE. faecalis is 0.5 𝜇g/ml.Fig. S10 Broth microdilution method for determination of MIC on ampicillin against E. coli,cefotaxime against S. aureus, and ampicillin against E. faecalis.Note 9. Long-term incubation of P. aeruginosa.
Fig. S11 Long term incubation of P. aeruginosa in droplets. (A) The fluorescent images taken every1 hour by time-lapse until 18 hours. (B) The relative fluorescence intensity of positive and negativedroplets versus time.Note 10. The technical innovation of gravity-driven step emulsification device(GSED)The flow of liquids in our device is purely powered by gravity. According to thePascal’s law the hydrostatic pressure P at the depth h below a free liquid surface readsP ρgΔh,where ρ is the liquid density, g is the gravitational acceleration; in our case, h is theheight difference between the oil inlet and oil outlet. Droplets are generated viaLaplace-pressure driven narrowing of a neck of the droplet phase (so called stepemulsification) forming at the inlet chamber to the droplet chamber when the chip isplaced align with gravitational field. While in the literature, the gravity-driven systemsused two reservoirs/containers placed in different height to make h to trigger the flowand their monodispersity of droplet are vulnerable by the flow rate which is related to h (Table S4).
Table S4. Comparison of GSED and previous gravity-driven droplet lsificationZhang et al.Van Steijn etTjhung et al.[15]al. [16][17]T-junctionT-junctionFlow-focusingA turntable forhanging andadjusting theAll modulesheightintegrated in adifference ofsingle devicereservoirs, a(e.g. oilvertical plasticSet-up ofreservoir,board, severalthe systemsampledisposablechambers,infusions sets,dropletrings, Nylongenerators.etc.lines and)dropletTwo syringesTwo containerswithcontinuousphase anddispersed phaseconnected tothe dropletgenerator bycapillariesgeneratorsfilled withaqueous mediaandperfluorinatedoil placed atdifferentheights and ips)Optimizednozzle forDropletpassiveA simple T-generatorproduction ofjunctionmonodisperseA T-junctionA simple flowwith a bypassfocusingchanneljunctiondropletsFixed size byTunable size byFixed size byTunable size byDropletthe designedadjusting thefixed-volumethe heightsizeheightturntable forof dropletdifference ofdifferencethe heightgeneratortwo syringes
between oildifferencereservoir andbetween twooil outletreservoirsTable S5. Comparison of GSED and DropChop (Lab Chip, 2017, 17, 1323)Power sourceGSEDDropChopGravity (hydrostaticVery expensive (3500pressure)euros net) CetonineMesys syringe pumpThe design of emulsifierA large sample containerA sloped straight channelthat is sloped in two axes.with a sample inletchannel of 400 400 µmcross-sectionEmulsify larger sampleYes. Sample chamber isNo. The design wouldvolumeintegrated in therequire 12.5 cm longemulsifierchannel foremulsification. Suchextremely long dropletwould wet the channeland/or break into severalsmaller dropletsNote 11. Digital droplet AST could reduce the MIC measurement errorsintroduced by the inoculum effect and errors in establishing the desired inoculumdensityThe inoculum effect generally occurs when the 𝛽-lactamase producing bacteria areexposed to 𝛽-lactam antibiotics [1]. It would manifest even within the CLSI-allowableinoculum range and serve as a source of error and inconsistency in AST determinations[2]. Here, we chose 𝛽-lactam antibiotics (ampicillin and cefazolin) against S. aureusATCC 29213 which is a weak 𝛽-lactamase positive strain and 𝛽-lactam antibiotics(cefotaxime) against E. coli DH5α TEM-20 which is an extended-spectrum 𝛽lactamase producing strain to examine the inoculum effect. We assessed the MIC bybroth microdilution, VITEK 2 system, and gravity-driven step emulsification device(GSED) and presented the results of tests in Table S6. The number of bacteria (5 105
CFU/ml) used for standard MIC in broth microdilution and GSED were counted bydigital droplet CFU as we mentioned in Fig. 5. However, we did not know the celldensity in the final inoculum for AST in VITEK 2 because the suggested inoculum of0.5-0.63 McFarland if further dilution on the card through its automatic transportsystem. The fold of this dilution on a card is not revealed in the user manual. In addition,the McFarland suspensions of bacteria with different sizes, shapes, and clusteringcharacteristic may yield CFU counts that differ by several fold [3]. This might be themain reason that we got different and higher value of MIC in VITEK 2 for ampicillinagainst S. aureus ATCC 29213 and cefazolin against S. aureus ATCC 29213. Anotherdisadvantage of VITEK 2 is that the AST card has small number of chambers andperforms truncated dilution series for a certain antibiotic which results in an incompleteMIC that shows the MIC value in a range (e.g. the MIC of cefazolin against S. aureusATCC 29213 is 4).Interestingly, we found out that in the group of tests with cefotaxime used against E.coli DH5α TEM-20, the MIC value in broth microdilution method is 6.6-fold higherthan VITEK 2 and 12.5-fold higher than GSED. We suspected that the larger absolutepopulation size of E. coli DH5α TEM-20, the more enzymes are produced and thus thehigher the change in antimicrobial efficacy when there is a huge inoculum effect. In ourexperiment, we used 150 𝜇l of inoculum per well in broth microdilution method, and2 nl inoculum per droplet in GSED. For the inoculum density of 5 105 CFU/ml, therewill be 75000 CFU per well and 1 CFU per droplet. Moreover, the volume of theVITEK 2 Card chamber is approximately 18 𝜇l, in the case of inoculum density of5 105 CFU/ml, there will be 9000 CFU per chamber. Therefore, the antibiotic willdegrade very fast in broth microdilution method because of the increasing inoculumvolume even though the inoculum density is the same as other methods.We further examined the MIC value within the allowed range of starting inoculumdensity that CLSI (2–8 105 CFU/ml) and EUCAST (3–7 105 CFU/ml) recommendand found dramatic inoculum effect on MIC determination within this narrow range ofinoculum densities in the group of cefotaxime against E. coli DH5α TEM-20 (TableS7). Meanwhile, the digital droplet AST assay performed in GSED are more robustagainst experimental errors (Fig. S12) because using diluted starting inoculum, onlysingle bacterium is encapsulated in a 2 nl droplet, which corresponds to the density of5 105 CFU/ml. Further dilution of the inoculum will decrease the number of positive
droplets containing single bacterium but will not change the final density in each ofpositive droplets which will be equal exactly 5 105 CFU/ml.Overall, the gravity-driven step emulsification device provides a standalone platformwith, lower consumption of consumables and samples and higher precision of assessingMIC values than commercial automated AST systems. In addition, the nature of settinga standard inoculum density in droplets makes it possible to prevent the inoculumeffects in contrast to the reference MIC method (broth microdilution) and commercialsusceptibility testing panels (VITEK 2).Table S6. Comparison of minimum inhibitory concentrations (MICs) of 𝛽-lactamantibiotics against 𝛽-lactamase positive bacteria assessed by broth microdilution,VITEK 2 and gravity-driven step emulsification device (GSED)Antibiotic/strainMIC (𝝁g/ml)BrothVITEK 2GSED0.1250.50.1250.5 40.56.610.53microdilutionAmpicillin/ S. aureusATCC29213Cefazolin/ S. aureusATCC29213Cefotaxime/ E. coliDH5𝜶 TEM-20Table S7. The MIC value of 𝜷-lactam antibiotics against 𝜷-lactamase producingbacteria strains within the allowed range of starting inoculum density that CLSIand EUCAST recommend for broth microdilution methodMIC (𝝁g/ml)Inoculum densityAmpicillin/Cefazolin/Cefotaxime/(CFU/ml)S. aureusS. aureusE. coli DH5𝜶ATCC29213ATCC29213TEM-202 1050.1250.53.43 1050.1250.54.24 1050.1250.55.3
5 1050.1250.56.66 1050.1250.56.67 1050.1250.59.98 1050.1250.59.9Fig. S12 Digital droplet AST are more robust against experimental errors in the initial inoculumdensity. a. ampicillin against S. aureus ATCC 29213. b. cefazolin against S. aureus ATCC 29213. c.cefotaxime against E. coli DH5α. 𝜆 average number of bacteria per 2nl droplet.Reference[1] I. Brook, Clin. Infect. Dis., 1989, 11(3), 361–368.[2] K. P. Smith, and J. E. Kirby, Antimicrob. Agents. Chemother., 2018, 62 (8)e00433-18.[3] T. Brennan-Krohn, K. P. Smith, and J. E. Kirby, J. Clin. Microbiol., 2017, 55(8),2304–2308.
The depth of the channel measured by Bruker ContourGT-K optical profilometer (Bruker, USA) Fig. S4 The image with the profile of the device measured by Bruker ContourGT-K optical profilometer (Bruker, USA). 3. The droplet generation from four-chamber gravity-driven step emulsification