Transcription
VISUALIZING THREE-DIMENSIONAL GRAPH DRAWINGSSEBASTIAN HANLONBachelor of Science, University of Lethbridge, 2004A ThesisSubmitted to the School of Graduate Studiesof the University of Lethbridgein Partial Fulfillment of theRequirements for the DegreeMASTER OF SCIENCEDepartment of Mathematics and Computer ScienceUniversity of LethbridgeLETHBRIDGE, ALBERTA, CANADA Copyright Sebastian Hanlon, 2006
AbstractThe GLuskap system for interactive three-dimensional graph drawing applies techniques ofscientific visualization and interactive systems to the construction, display, and analysis ofgraph drawings. Important features of the system include support for large-screen stereo-graphic 3D display with immersive head-tracking and motion-tracked interactive 3D wandcontrol. A distributed rendering architecture contributes to the portability of the system,with user control performed on a laptop computer without specialized graphics hardware.An interface for implementing graph drawing layout and analysis algorithms in the Pythonprogramming language is also provided. This thesis describes comprehensively the workon the system by the author—this work includes the design and implementation of the major features described above. Further directions for continued development and research incognitive tools for graph drawing research are also suggested.in
AcknowledgmentsFirstly, I would like to thank my advisor, Dr. Stephen Wismath, for encouraging me topursue graduate studies in computer science—without him, this thesis would not exist. Hehas furthermore been supportive and enthusiastic throughout the course of my studies; onecould not ask for a better supervisor. I also wish to thank the rest of my thesis committeeand the external examiner for their advice and quality assurance efforts.I gratefully acknowledge the support of the Natural Sciences and Engineering ResearchCouncil of Canada (NSERC) for providing major funding in support of this research.Thanks are also extended to my friends and colleagues for providing support, advice,and encouragement as I completed this thesis; particularly Susan Beaver, Paul Dawson,Barry Gergel, David Lenz, Brian McFee, Elspeth Nickle, Ed Pollard, Tiffany Proudfoot,Patrick Stewart, and Katrina Templeton. Thanks as well to the development communitiessupporting the Twisted and wxPython packages.Special thanks are due to my very good friend Kim Hansen for shoring up my mentalstability and motivation throughout the research and writing process.Finally, I thank my parents Vincent and Teresa Hanlon and my brother Matt for theircontinual and loving support.IV
ContentsApproval/Signature PageiiAbstractiiiAcknowledgmentsivTable of ContentsvList of TablesviiList of Figuresviii1 Introduction1.1 Motivations . . . . . . . . . . . . . . . . . . . . . . . . . . . . . . . . . .1.2 The GLuskap VR System . . . . . . . . . . . . . . . . . . . . . . . . . . .1.3 Applications Of 3D Graph Drawing . . . . . . . . . . . . . . . . . . . . .1.4 Structure Of This Document . . . . . . . . . . . . . . . . . . . . . . . . .122342 Background72.1 Graph Drawing . . . . . . . . . . . . . . . . . . . . . . . . . . . . . . . . 72.2 Visualization and Interaction . . . . . . . . . . . . . . . . . . . . . . . . . 162.3 Interactive 3D Graph Drawing . . . . . . . . . . . . . . . . . . . . . . . . 273 Design323.1 Software System . . . . . . . . . . . . . . . . . . . . . . . . . . . . . . . 323.2 Hardware System . . . . . . . . . . . . . . . . . . . . . . . . . . . . . . . 414 Implementation4.1 The Visualization Hardware System . . . . . . . . . . . . . . . . . . . . .4.2 Interactive Graph Drawing Software . . . . . . . . . . . . . . . . . . . . .4.3 Software Engineering Techniques . . . . . . . . . . . . . . . . . . . . . .46465073
5 Evaluation5.1 Other Interactive Graph Drawing Systems . . . . . . . . . . . . . . . . . .5.2 Best Practices For Visualization and Interaction . . . . . . . . . . . . . . .5.3 Software Engineering Techniques . . . . . . . . . . . . . . . . . . . . . .680808691Conclusions956.1 Future Work . . . . . . . . . . . . . . . . . . . . . . . . . . . . . . . . . . 96Bibliography101VI
List of Tables4.1Context menu structure . . . . . . . . . . . . . . . . . . . . . . . . . . . . 68vn
List of Figures2.12.22.32.42.52.6Example Graph: Vertex and Edge ListExample Graph: Adjacency List . . .Example Graph: Adjacency Matrix . .Example Graph: Node-Link DiagramLa Trahison des Images . . . . . . . .Stereoscopic Depth Cue Example . . 9. 9. 9. 9. 17. 223.1 Conventional 3D perspective display . . . . . . . . . . . . . . . . . .3.2 Stereographic 3D display . . . . . . . . . . . . . . . . . . . . . . . .3.3 Two Laptops for Portable Passive Stereographies . . . . . . . . . . .3.4 Primary and Two Secondary Nodes for Portable Passive Stereographies3.5 Overlapping Alignment of Two Projectors . . . . . . . . . . . . . . . . . 34. . . 35. . . 37. . 38. . . 444.14.24.34.4GLuskap System Hardware ComponentsGLuskap Data Flows . . . . . . . . . .Primary Node Window System InterfaceFullscreen 3D Interface . . . . . . . . .5.1GLuskap Texture Patterns . . . . . . . . . . . . . . . . . . . . . . . . . . . 90Vlll.47516161
Chapter 1IntroductionSince the early 1990s, the increasing power and diminishing cost of computer processors (and the related availability of specialized 3D graphics acceleration hardware) hasbrought high-performance graphics realization capability to commodity computing plat-forms. Hardware capable of supporting dynamic visualization of detailed virtual scenesand objects is available at a low cost, and standard APIs (including OpenGL) allow applications to be written and deployed in a portable manner.While the development of graphics technology has been driven in large part by theconsumer market for electronic entertainment, the 3D capability so widely used to sellgames also benefits researchers and developers in less commercial disciplines. Researchinto information visualization techniques has been stimulated by the capability of computersystems to facilitate interactive exploration of data sets, with users issuing queries andhaving the results displayed in graphical form with a minimum of waiting.The popularity of 3D graphics displays has also stimulated research in the field of threedimensional graph drawing. In two dimensions, only the class of planar graphs can bedrawn without edge crossings. This restriction is removed in three dimensions—all graphscan be drawn in three dimensions without edge crossings, so considerable research is fo1
cused instead on reducing the volume required (determined asymptotically) to draw variousclasses of graphs.1.1 MotivationsSoftware tools designed specifically for working with graph layouts in three dimensionsare relatively rare. Most are focused on implementing particular algorithms or classes ofalgorithms. For interactive experimentation with layout ideas or communication of visualideas between individual researchers, it is often easier to use limited physical models (forexample, Styrofoam balls and wire to represent vertices and edges) than to write formalimplementations of prototype layout algorithms or to use a two-dimensional interface tomanipulate a three-dimensional drawing.The idea behind the GLuskap system here described is to develop an interface for interacting with three-dimensional graph drawings that uses principles of interactive systemsand data visualization to best effect. We wish to build a tool that provides an effective,naturalistic interface on the order of Styrofoam balls and pipe cleaners while retaining theadvantages of digital modeling: virtually unlimited resources, zero-cost data replicationand communication, and the ability to automate and extend nearly any aspect of the process.1.2 The GLuskap VR SystemThe GLuskap system for interactive three-dimensional graph drawing has been developedat the University of Lethbridge under the direction of Dr. Stephen Wismath. Buildingon the existing GLuskap software product written in the Python programming language,this system integrates the application software with a specialized hardware system to sup-
port 3D graph drawing research activities in a large-screen (6.0' x 8.0', 1.83m x 2.44m)rear-projected stereographic environment with immersive features. Both head-tracking andwand-tracked interaction are supported.The system is reasonably portable to maximize efficient use of space and also increasingpotential uses of the system in research, visualization, and teaching roles. To achieve thisportability requirement, a networked rendering architecture is supported by the GLuskapsoftware and is implemented using a laptop and two small form factor computers connectedover Ethernet. The computing resources, motion tracking equipment, and projectors andoptical equipment (without the large screen) pack down into three travel cases; the large rearprojection screen and frame requires two additional packing tubes for storage or transport.The system can also be adapted to work with a lenticular front-projection screen if required.In the course of my thesis work, I have been solely responsible for the developmentand maintenance of the GLuskap software program as it has been enhanced to support thevisualization and interaction technologies described in Chapters 3 and 4. My work has alsoincluded the design and implementation of the hardware system that supports the largescreen immersive 3D interface.1.3 Applications Of 3D Graph DrawingThe algorithms and approaches of three-dimensional graph drawing can be put to use inseveral practical areas. As a visualization technique for relational data, 3D drawing techniques are of obvious utility when working with data sets involving multi-dimensional data.These include, but are not limited to, scenarios where data objects are associated with positional attributes that can be translated into the virtual space directly.
Large data set visualization More generally, extending the display media into threedimensions allows users to effectively interpret and manipulate larger data sets than wouldotherwise be possible, especially in an interactive situation where the user can alter theperspective of the data display. 3D organizational techniques like cone trees (introduced byRobertson et al. [RMC91]) and Munzner's H3 [Mun97] have been developed to maximizeefficiency for displaying large quantities of data.Displaying data in virtual environments provides the user with a context in which tointegrate large data sets. Much like visiting a new building or town, the brain can buildmental maps using the spatial relationships between features and landmarks.Space minimization for wire-routing As advances in VLSI construction processes enable circuits to be built in multiple layers, three-dimensional graph drawing techniques(especially in the area of orthogonal drawings) have become relevant in this area. The connections between individual components on a chip die are easily represented as an undi-rected graph. Research in this area is typically focused on finding layouts which may beconstrained in one or more dimensions (preserving the overall planar nature of the chippackage) while minimizing the length of individual wire connections and the overall surface area and volume of the circuit.1.4Structure Of This DocumentThe remainder of this thesis is divided into five chapters. The first part of Chapter 2 introduces the field of three-dimensional graph drawing and discusses some results from theliterature pertaining to the area of graph drawing algorithms which GLuskap is designedto work with. Next, a brief treatment of human visual perception and interaction principles is given. Attention is focused on those characteristics which are relevant to the design
and implementation of the GLuskap interactive interface. Finally, different types of existing software for three-dimensional graph drawing are surveyed. Some related products,including the antecedent version of the GLuskap software, are reviewed briefly.Chapter 3 describes concepts considered in the design of the GLuskap system. Particular requirements for data visualization techniques incorporated directly into the softwareare described. The accommodations required to maximize the portability of the system,particularly in producing stereographic output on a large projection screen, are also covered.Detailed coverage of the construction and implementation of the system is provided inChapter 4. An in-depth examination of the component hierarchy, control flow, and dataflow architecture of the GLuskap software is given here; this includes details of the implementation of the networked stereographic rendering system and the mechanics of data flowfor handling the Flock of Birds motion tracking system. All aspects of the large-screeninteractive user interface are described, along with the programming interface for plug-inscripting of drawing algorithms in Python. The chapter concludes with a discussion ofsoftware engineering and development techniques used in the construction of the GLuskapapplication software.In the fifth chapter, the work is evaluated in retrospect. The features of the GLuskapsystem are compared with other software products for interactive three-dimensional graphdrawing, including the previous version of the GLuskap software. The visualization andinteraction techniques implemented in the current system are examined in comparison toalternative strategies and pertinent ideas from the related literature.Chapter 6 presents some concluding remarks on what has been accomplished throughthe development of the GLuskap system and the accompanying research and documentation, including this thesis. Ready opportunities for additional work to extend the usefulnessof this product, as well as directions for continued research into methods for providing cog-
nitive support to researchers in graph drawing, are described here.
Chapter 2Background2.1 Graph DrawingThe study of graphs is fundamentally concerned with the relationships between distinctentities. Graphs can represent thought processes, bureaucratic organizational hierarchies,networks of various kinds, state diagrams for automata, procedural flowcharts, digital logiccircuits, and many other concepts. In all of these contexts, it is their relational nature thatmakes the graph data structure applicable. Here we will primarily concern ourselves notwith the domain-specific uses of graphs, but instead consider graphs independent of anyparticular context in which they may be used.Abstracted from any deeper semantic content, we call the entities nodes or vertices,and the relations between them edges. Behzad and Chartrand offer the following formaldefinition of a graph:A graph G (sometimes called an ordinary graph) is a finite, non-empty set Vtogether with a (possibly empty) set E (disjoint from V) of two-element subsetsof (distinct) elements of V. Each element of V is referred to as a vertex and Vitself as the vertex set of G; the members of the edge set E are called edges. By
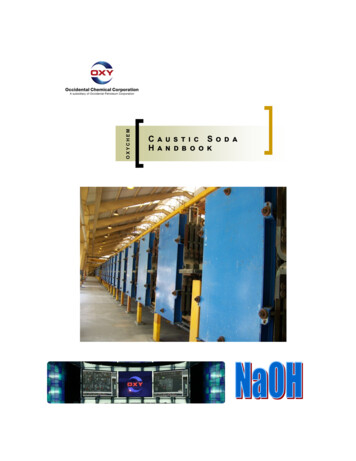
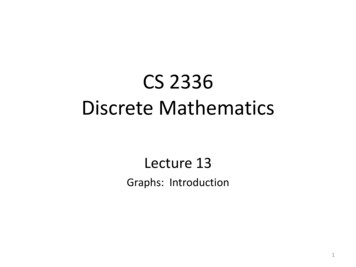
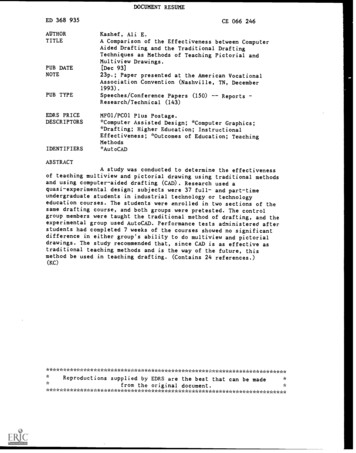
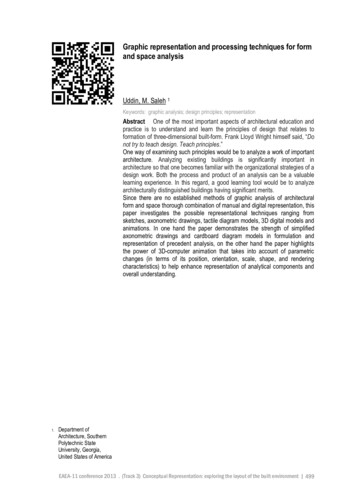
an element of a graph we shall mean a vertex or an edge. [BC71]For each edge e — {u,v}, e is said to be incident to u and v. u and v are said to beadjacent, and joined by e. The degree of a vertex v is the number of edges incident to v.The graph Kn (V,E) with n \V\ vertices, where each vertex u is adjacent to every othervertex v (V«, v e V)(u v — {«, v} e E) is called the complete graph.A variant data structure, the directed graph, is formed from a set V of vertices and a setE of ordered pairs (rather than unordered two-element subsets) of vertices. In this kind ofgraph, the edge e (M,V) has source u and target v. Though there is substantial researchon, and many applications for, directed graphs, in this thesis we will assume that graphs areundirected except where specified.Within this document, we will use the term vertices exclusively to avoid ambiguity withthe components of the GLuskap networked display system as described in Sections 3.1.3and 4.2.3.An ordinary graph can be represented equivalently as a list of vertices and a list ofedges, an adjacency list, or a two-valued adjacency matrix. Figures 2.1, 2.2, and 2.3 areequivalent representations of the same graph.These representations are precise and unambiguous, and it is clear to see how they formthe basis for common data structures used to represent graphs for processing by algorithmsand applications. They are less accessible, though, to comprehension by the human reader.We therefore introduce a fourth representation: an example of a graph drawing equivalentto the three previous representations is given in Figure 2.4.The advantages of this visual representation in a cognitive context are obvious. By representing the vertices as circles and drawing lines connecting adjacent vertices, we producea node-link diagram. All the information present in Figures 2.1, 2.2, and 2.3 is preserved,and the relationships between individual vertices are clearly visible—as is the overall struc-8
V::{V1,V2},{V1,V 3 },{V3,V2},{V3,V 4 },{V4,V 5 },{V 4 ,V 6 },{V 5 ,V 6 }Figure 2.1: Example Graph: Vertex and Edge Listvi: v 2 ,v 3v2: vi,v 3V3-Vl,V2,V4v4:vs:Vf :V 3 ,v 5 ,v 6v 4 ,v 6v 4 ,v 5Figure 2.2: Example Graph: Adjacency ListviVl-V21V3V4V5V6V2V3V41 1 0- 1 011 - 10 0 1 0 0 0 10 0 0 1V5V60 00 00 01 1- 11 -Figure 2.3: Example Graph: Adjacency MatrixFigure 2.4: Example Graph: Node-Link Diagram
ture of the graph, that of two groups {vi, V2,V3J and {v4, vs, Vf,} connected by the singleedge{v 3 ,v 4 }.Ware [War04, p. 23] claims that data, in general, can be divided into entities andrelationships; entities are the objects we are interested in and their context is formed ofthe relations between them. What constitutes an object is subject to definition on a case bycase basis. For example, a hockey player is an object; so too are a hockey team and thecity they play in. In software engineering, a software program, a specific use case, and adata table may all be conceptual objects at different levels of the design process. As longas information can be structured into objects and connections between them, this approachis valid. Object-oriented programming techniques and the languages that support themrepresent a formalization of this paradigm, though in many cases the relationships betweenobjects are not well-defined in programming language structures.Even if we stop short of attempting to fit all possible data sets into the object-relationshipparadigm, it is clear that a great number of real-world scenarios lend themselves to representation and analysis as graphs. Graph drawing therefore provides a useful infrastructurefor the visualization and cognitive comprehension of these data. Continuous lines betweenobjects represent the abstract idea of "connectedness" in a powerful way, creating conceptual linkages that dominate those induced by simple proximity or similarity of colour, size,or shape [PR94].2.1.12D Graph DrawingWhen used for data visualization, the elements of a graph drawing form a visual grammar(that is, a framework for interpreting the symbols of a diagram) capable of expressingrelationships both simple and complex. The overwhelming majority of research in the areaof graph drawing concerns two-dimensional drawings in the plane. This is the most natural10
context for communicating ideas—we are surrounded by written and illustrated materials inplanar forms. As we will discuss in Section 2.2.1, the human visual system is well-adaptedto extracting information from two-dimensional representations, the three-dimensionalityof the natural world notwithstanding.What makes a good drawing algorithm? Graph drawing algorithms can be assessedas to the "comprehensibility" of the drawings they produce—a "good" drawing shouldbe easy to read accurately. This is obviously a difficult concept to define precisely, butSugiyama [Sug02] has compiled a list of drawing rules based on the criteria of Batini etal. [BFN85] produced by the analysis of diagrams constructed by human designers in actualuse. Sugiyama divides this list into structural rules and semantic rules.Structural rules are concerned with the expression of graph-theoretic properties, including the minimization of edge crossings and edge bends, the accurate representationof symmetries and isomorphic subgraphs, and the minimization of total drawing area andtotal edge length. Semantic rules are imposed by the user or attributed properties of thegraph elements, including rules about placement of specific vertices relative to each otheror relative to the drawing area (for example, placing specified vertices near the center ofthe drawing).From this perspective, the task of a graph drawing algorithm is to solve a priority rankedset of optimization problems derived from some set of these structural and semantic rules.Some algorithms are optimized for, or even restricted to, drawing specific classes ofgraphs; for example, there is a great deal of literature on tree drawing algorithms. Otheralgorithms make compromises in an attempt to maximize their suitability for large classesof graphs. Many physics-based or energy-minimization models fall into this category; forexamples, see [FR91, DH96, NoaOS].Di Battista etal [BETT99] and Kaufmann and Wagner [KW01] provide comprehensive11
coverage of the established methods and algorithms for drawing a number of classes ofgraphs in two dimensions.Geometric results Two-dimensional drawings motivate the graph theory study ofplanarity-whether or not a given graph can be drawn in the plane with no edge crossings. In fact,Fary [Far48] establishes that all planar graphs can be drawn using straight line edges without crossings. If vertices are restricted to lie on integer grid points, then it becomes possibleto assess drawing algorithms on the basis of the area of the grid required to draw the graph.The area is typically calculated relative to the number of vertices in the graph (n), and represents the size of a rectangular bounding box with sides parallel to the coordinate axeswhich completely encloses the graph drawing.De Fraysseix et al. [dFPP88, dFPP90] and Schnyder [Sch90] independently prove thatall planar graphs can be drawn on a grid of size O(n 2 ). This bound is tight (i.e. 0(n 2 ))for some families of planar graphs. For other classes of planar graphs, the area can beimproved asymptotically—for example, rooted trees of constant degree have a straight-linedownward grid drawing in area O(«log 2 n) [SKC96], and complete, AVL, and Fibonaccitrees can be drawn under the same conditions in area O(n) [CP95, Tre96].2.1.2 3D Graph DrawingThe capability of computer graphics systems to create and display pseudo-realistic syn-thetic objects and virtual three-dimensional spaces is well established. Three-dimensionaldisplay techniques are used in industry for visualization and interactive design. The extension of graph drawing in computer science to three dimensions is therefore a naturalprogression.We continue from the previous topic by considering three-dimensional integer griddrawings. The fundamental requirements that vertices be placed on integer grid points12
and that edges must not cross are preserved. Rather than measuring the area of a twodimensional bounding box of a drawing, we must now determine the size of a drawingas the volume of a rectangular prism (with all edges parallel to the coordinate axes) largeenough to enclose the entire drawing.Integer grid drawings Cohen et al. [CELR97] present the "moment curve" algorithm,which provides a straight-line crossing-free integer grid drawing in three dimensions ofany graph, in volume O(«3). They additionally prove that the complete graph Kn has thevolume bound 2(n3), indicating that the bound is tight for unrestricted ordinary graphs.Better results can be obtained for restricted classes of graphs; in particular, they prove thatcomplete bipartite graphs can be drawn in volume O(n2}.Calamoneri and Sterbini [CS97] follow up Cohen et al. by establishing a lower vol-ume bound of Q.(n Jn) for -colourable graphs (for fixed k 2), and provide a threedimensional drawing algorithm for 2-, 3-, and 4-colourable graphs in volume O(n2}. Theyhypothesize that all /c-colourable graphs can also be drawn in volume O(n2). Pach etal. [PTT97] prove this conjecture, and also show that O(n2} cannot be beaten, closingthe gap between the lower bound of Calamoneri and Sterbini and the established upperbound for this class of graphs.A linear volume result in three dimensions (O(n)} is shown by Felsner et al. [FLW03]for all prism-drawable graphs. These are graphs which can be drawn without crossings byplacing vertices along the spines of a regular three-dimensional triangular prism, where theedges are constrained to lie on the facets of the prism. All outerplanar graphs are prism-drawable, though not all planar graphs are prism-drawable. Dujmovic and Wood [DW04]significantly show that all planar graphs can be drawn with an upper bound of O(n fn]volume. A gap remains between this result and the trivial lower bound of l(n) for planargraphs which have O(n) vertices and O(n] edges; this is an important open problem in the13
field of three-dimensional graph drawing.Bent edge results Improved volume bounds can also be obtained if we relax the straightline edge constraint. Morin and Wood [MW04] define a polyline grid-drawing as havingvertices placed at integer grid points and edges represented as a sequence of straight linesegments. The bend points of these polyline edges are also constrained to occupy integergrid points. Discrete polyline edges must not intersect each other. Morin and Wood definea b-bend drawing to be a polyline drawing with at most b bends per edge—note that astraight-line drawing is exactly a 0-bend drawing.Even if we allow an unlimited number of bends, Bose et al. [BCMW04] show that theQ.(n2) lower bound of Pach et al. [PTT97] still holds for all grid drawings of Kn. Dyck etal. [DJN 04] further demonstrate that this lower bound is achievable with a maximum oftwo bends per edge. They also propose a 1-bend drawing algorithm, but without asymptoticimprovement over the 0-bend O(n3) case.Morin and Wood [MW04] develop a novel algorithm for 1-bend drawings, loweringthe upper bound to 0(n 3 /log 2 «). Devilliers et al. [DEL 05] recently developed a newalgorithm based on the Morin and Wood construction that reduces the upper volume boundfor 1-bend drawings further still to O(n2-*/n), though a gap still remains between this resultand the Q(n 2 ) lower bound.Orthogonal drawings There has been considerable investigation of orthogonal grid draw-ings in two dimensions [BETT99, Ch.5], in which edges are constructed from a sequenceof horizontal and vertical line segments. This field of study is motivated in part by application to component placement issues and circuit routing in VLSI design [LeiSO, KvL85]as well as aesthetic preference for rectilinearity in diagram construction [BRT84, BFN85,Tam85, NT90].14
Three-dimensional orthogonal graph drawings can be considered a subset of polylinegrid drawings, where edge segments are constrained to grid lines (parallel to one of thecoordinate axes at integer grid intervals). These have been studied in depth and severalresults pertain.If vertices are represented by points in three dimensions, it is trivial to show that onlygraphs with maximum degree six can be drawn orthogonally without crossings: there areonly six "faces" on which incident edges can contact each vertex. Orthogonal drawings ofgraphs of higher degree can still be made without crossings if vertices are represented asthree-dimensional boxes or line segments spanning multiple grid points [BSWW99, PT99].A lower bound for the volume of three-dimensional orthogonal drawings of arbitrarydegree (with vertices represented by boxes) is established by Biedl et al. [BSWW99]. Thislower bound for drawings of Kn with an arbitrary number of bends per edge is l(n2\/n); amatching upper bound is also shown if 3 or more bends per edge are permitted.Eades et al. [ESWOO] describe a set of 5 drawing algorithms for three-dimensionalorthogonal graph drawings with maximum degree six. If 7 bends per edge are allowed, adrawing with volume O(n /n) is produced. Similarly, the 6-bend drawing requires volumeO(n2), the 5-bend drawing O(n2 /n), and for 3 bends per edge, 0(«3) volume is used.Their fifth algorithm provides a 3-bend drawing in volume O(n2), but only for graphs ofmaximum degree 4.The O(«A/«) volume for the 7-bend case is tight: Kolmogorov and Barzdin [KB67] andRosenberg [Ros83] prove a lower bound of Q.(n /n).Papakostas and Tollis [PT99] provide a linear time algorithm for a 3-bend orthogonaldrawing of graphs of maximum degree six in volume O(n3), with a significant constantfactor improvement over the 3-bend layout of [ESWOO]. They also provide a two-bendorthogonal drawing algorithm for graphs of arbitrary degree (using solid boxes to representvertices). Both algorithms are incremental such that vertices are added to the graph on-line.15
Nomura et al. [NTU05] show in a recent paper that all outerplanar graphs with maximum degree six and with no triangles have three-dimensional orthogonal drawings withoutbends.2.2 Visualization and InteractionWhile a thorough treatment of human visual perception, data visualization practices, andinteractive systems cannot be accomplished within the scope of this thesis, this section willattempt to introduce concepts relevant to the work presented in later chapters. Readers arereferred to Ware's Information Visualization [War04] for a more comprehensive study ofthese topics.2.2.1 Basics of PerceptionAn effective model
The GLuskap system for interactive three-dimensional graph drawing applies techniques of scientific visualization and interactive systems to the construction, display, and analysis of graph drawings. Important featur