Transcription
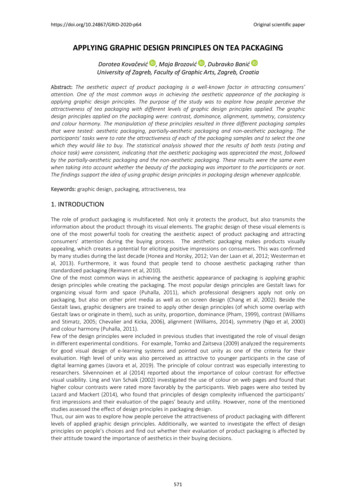
Graphic representation and processing techniques for formand space analysisUddin, M. Saleh 1Keywords: graphic analysis; design principles; representationAbstract One of the most important aspects of architectural education andpractice is to understand and learn the principles of design that relates toformation of three-dimensional built-form. Frank Lloyd Wright himself said, “Donot try to teach design. Teach principles.”One way of examining such principles would be to analyze a work of importantarchitecture. Analyzing existing buildings is significantly important inarchitecture so that one becomes familiar with the organizational strategies of adesign work. Both the process and product of an analysis can be a valuablelearning experience. In this regard, a good learning tool would be to analyzearchitecturally distinguished buildings having significant merits.Since there are no established methods of graphic analysis of architecturalform and space thorough combination of manual and digital representation, thispaper investigates the possible representational techniques ranging fromsketches, axonometric drawings, tactile diagram models, 3D digital models andanimations. In one hand the paper demonstrates the strength of simplifiedaxonometric drawings and cardboard diagram models in formulation andrepresentation of precedent analysis, on the other hand the paper highlightsthe power of 3D-computer animation that takes into account of parametricchanges (in terms of its position, orientation, scale, shape, and renderingcharacteristics) to help enhance representation of analytical components andoverall understanding.1.Department ofArchitecture, SouthernPolytechnic StateUniversity, Georgia,United States of AmericaEAEA-11 conference 2013 . (Track 3) Conceptual Representation: exploring the layout of the built environment 499
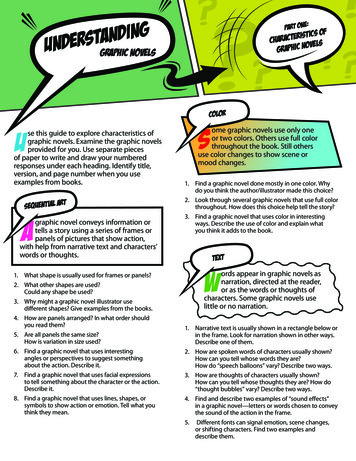
Uddin M.S.1. Architectural Analysis and Design PrinciplesIn architecture, the primary goal of a design analysis and its representation is to expose theunderlying concept, organizational pattern, design characteristics, and ‘tectonics throughsimplified diagrams. Analysis for a built physical building will inherently lead to thereconstruction of the underlying design principles as a predicted hypothesis. Both the process andproduct of an analysis can be a valuable learning experience in architectural education.Often, an analysis is an attempt to reduce the written discussion of theories involved, and toemphasize more clearly the design characteristics and ‘architectonics’ used through simplifiedgraphic diagrams and sketches.Howard Robertson in the preface of his book ‘The Principles of Architectural Composition’mentions: “In attempting to formulate some of the guiding principles of architectural design, Ihave been actuated by the desire to demonstrate that composition in architecture is susceptible ofan analysis, through which can be isolated certain main factors which assist in, or militateagainst, the production of successful design.”Throughout history, the notion of ‘precedent’ has always provided conceptual models to servethe quest for appropriate architectural forms. Since the end product of architecture is a builtoutcome, the most basic theoretical stance must be supported in turn by a few fundamentalgrammars. Such was the case with Le Corbusier’s ‘Five Points of the New Architecture’published in 1926. The design and construction of Villa Savoye by Le Corbusier (1928-31) gavean equally seductive physical expression to the ‘five points’ idea. In turn it provided a collectiveiconic precedent. Conversely, when analyzed, the built work of Villa Savoye was clearly able todemonstrate the principles of ‘five points’ and also supported the theoretical model.Although the result of a design analysis can take the form of a written text, recentdevelopments in drawing techniques and computer simulation suggest that incorporating multidimensional graphic means along with text description and tactile model will enhance theunderstanding of the analysis equally to a professional architect and to a beginning student.All analyses have two basic components: a) Formulation or Conception of Analysis, and b)Representation of Analysis2. Components of AnalysisAlthough graphic analyses of precedents are approached differently by various authors, thereare significant overlaps among the issues undertaken for analysis. Some issues are categorizedsometimes as element, other times as a system, elsewhere as relationships. For example‘Circulation’ is categorized as an element by Clark and Pause, whereas Ching illustrates this sameissue as a system. Simon Unwin defines it as an element doing more than one thing.Reviewing the above examples, it can be said that it is possible to express and examine adesign vocabulary in a work through three main divisions:a. Components/Elements of Design:- Basic or Conceptual Elements (Line, Plane, Volume, Mass, etc.);- Defining Elements (Entry, Path, Place, Opening, etc.);- Modifying Elements (Light, Color, Texture, Temperature, Sound, Ventilation, etc.).b. Relationships between Design Elements: Building to Context, Circulation to Use, Plan toSection, Unit to Whole, Inside to Outside, Repetitive to Unique.c. Principles of Design: Axis, Symmetry, Hierarchy, Rhythm, Repetition, Datum,Transformation.Similarly, it is possible to express analytical components or issues in a design work intofollowing four basic categories (excluding Perceptual Components), each having sub-issueswithin it:500 EAEA-11 conference 2013 . (Track 3) Conceptual Representation: exploring the layout of the built environment
Graphic representation and processing techniques for form and space analysisContextual Components: Location, Site and Context, Site Forces, Approach, Movement,Climate, Socio-political.b. Organizational Components: Proportions in plan-section-elevation, Geometric Order, Lightcolor-shade and shadow, Transformation: functional-formal-spatial and elemental, Axes,Core, Datum, Regulating lines, Equilibrium/Hierarchy, Thematic modulation.c. Thematic Components: Theme and meaning, Design principles, Parti diagram, Zones,Figure/Ground, Circulation sequence-space-exit.d. Visible Components: Massing, Cluster of units, Containment, Form and space, Geometricadaptation, Unit to Whole, Repetitive to unique, Solid to void, Core system, Structure,Layers, Interlock, Frame to mass, Plane to mass, Membrane to mass, Envelope to core, 3Dsolid-void, Addition-subtraction, Enclosure to non-enclosure.Although a general guideline can be drawn from reviewing various authors work, it seemsthat each building may have certain qualities that are unique to that building and an analysis nothaving fixed issues can effectively bring out some new issues.a.3. Graphic Representation Means of AnalysisAnalysis can be presented through text, verbal narration, two- and three-dimensional graphicsusing architectural drawing conventions, video, computer animation, and interactive navigatedgraphics. Although live video and realistic animation can provide a near experiential quality ofbeing in a building, without understanding conventional drawings of that building, analysis willremain incomplete. Plan, elevation, section, and 3D drawings are abstract representations of abuilding that provide a holistic view of the building without being distracted by the details ofmaterials used, treatment of facade, and such other details.Although the result of a design analysis can take the form of a written text, recentdevelopments in drawing techniques and computer simulation suggest that incorporating multidimensional graphic means along with text description will enhance the understanding of theanalysis equally to a professional architect and to a beginning student. Below are the basiccategories of representational media for graphic analysis.Drawing ConventionsEach analysis may demand its own method of drawing. Some analyses may be very effectivewith two-dimensional plan, others may need three-dimensional exploded axonometric. Drawingsare an abstract representation of reality. All technical drawings are constructed on the basis ofcommon systems of projection. The projection is the relationship between a point in space and itsrepresentation on a selected plane. Depending on the nature of the projections, all drawings maybe divided into two basic categories:1. Multi-view drawings (two-dimensional plan, elevation, and section), and2. Single-view drawings (three-dimensional axonometric and perspective).Plan, elevation, and section drawings are multi-view drawings where several coordinatedimages are necessary to communicate the complete visualization of the object. Single-viewdrawings are three-dimensional projections where one drawing illustrates several surfaces of theobject, facilitating the understanding of the overall form of the object. The possibility ofcombining various conventions into one drawing to show more information has always been anexperimental approach by avant-garde architects. However, parallel projection and centralprojection are the two systems that are capable of portraying the three-dimensional nature of anobject.Axonometric drawings particularly may become very useful in such an analysis because oftheir diagrammatic but three-dimensional nature in communicating the main idea in astraightforward manner.EAEA-11 conference 2013 . (Track 3) Conceptual Representation: exploring the layout of the built environment 501
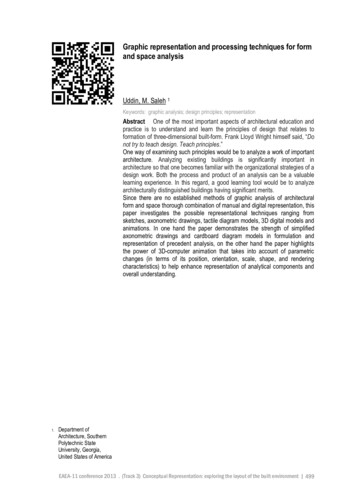
Uddin M.S.It is important to choose an effective view point of a drawing that will illustrate an analyticalissue clearly. Following are some of the options that may be used for construction of a paraline ora perspective drawing to suit specific purposes. Examples shown in Fig. 1 are axonometricdrawings, a common projection convention favored by architects for the simple reason that suchdrawings can be generated from existing floor plans.Fig. 1 Axonometric drawing exploration to represent various possibilities of 3D form and space analysisTactile Hand ModelsPrimarily, for analysis the common trend is to use drawings and images, ignoring the fact thatthe tactile hand model can provide the unprecedented understanding of tectonic and spatialcomposition of built-forms. This is particularly important in education. Architectural models arerepresentation of buildings in a smaller scale using materials that are symbolic to real materials.They fit to three basic genres: a) presentation model, b) design process model, and c) analyticaldiagram model.Understanding the spatial composition in 3D is the most essential prerequisite for creation andconstruction of diagram models for analysis. Simplifying the construction to create the diagrammodel along with proper material to emphasize and de-emphasize various aspects is the key tohaving a successful analytical model. Similar to drawings, tactile models can also construct andrepresent 3D spaces in wireframe, layers, solid-void, and exploded formats. Since the overallform and space is important in such diagram models, more than the precision of scale the use ofmaterial and proper proportion is critical. Fig. 2 below shows examples of diagram models thatuse various motifs of axonometric drawings through use of material and improvised methods ofmodel-making.Fig. 2 Diagram models in cardboard offers best possible understanding of spatial and tectonic composition of built-formsfor beginning design students502 EAEA-11 conference 2013 . (Track 3) Conceptual Representation: exploring the layout of the built environment
Graphic representation and processing techniques for form and space analysisDigital Modeling and AnimationWithout getting involved into technical details, it could be simply described that, there arethree basic factors that together determine what an object in 3D computer model will look like.The first factor is the model construction mode, which tells the model how accurately an objectshould be constructed, and how much surface detail to display. Secondly every object is assigneda surface, which gives the object color and texture. The third factor is the lighting, which providesshading and depth to the model. Although these and their combination can provide a wide rangeof rendering options, by examining precedents of analytical diagrams drawn by various authors itcan be stated that the basic features of hand drawn analytical diagrams are not readily available incomputer 3D applications. Most of these are unique improvised features and not commonlyencountered in 3D applications.However, on the other hand, computer animations, which are generated from 3D models, havean unparalleled capability to demonstrate spatial experience. Animations can also manipulate theconstitute components of the spatial structure, thus illustrating analytically the composition of abuilding or object. Since animated models can be built initially from a plan, it is possible to showboth plan and three-dimensional structures in order to illustrate the sequential reading of thethree-dimensional space. A 3D computer animation can respond to a variety of changes within thecomponents of created models in a defined timeline where each event is recognized and changedin terms of its position, orientation, scale, shape, and rendering characteristics. Usually everyevent that has happened to every object is tracked, and a final animation is created incorporatingchanges of all objects.Fig. 3 3D-computer animation capable of revealing information through parametric changes of elements in position,orientation, scale, shape, and rendering characteristics. Various modes and combination of wireframe and renderingtechniques in the modelling environment can be animated as needed4. Processing Techniques in Drawings and ModelsThe most important aspect of any graphic analysis is the process of transforming concepts ofanalysis into visual graphics. Bringing out specific issues of analysis such as the basic formcomposition, structural system, relationships between elements, can be achieved by:1. Reworking on an existing drawing,2. Drawing a new drawing or 3D model,3. Creating a new drawing or model only emphasizing specific issues.Undertaking such executions will involve the processing of drawings. It could be processingof an existing drawing or graphics to highlight a certain part, or processing a new drawing withemphasis, addition, reduction, change of scale, and so forth. A processed drawing here meanssome type of modification from typical conventions. Combination of conventions such ascombining a section in its axonmetric projection, or a sequential rotation of an axonometric willEAEA-11 conference 2013 . (Track 3) Conceptual Representation: exploring the layout of the built environment 503
Uddin M.S.fall into this category. For the purpose of analysis all drawings may be processed in followingcategories:Reduction: Reduction is the most basic technique of representation. A commonly usedtechnique in design analysis, reduction consists essentially of omitting all irrelevant data from adesign drawing so that only information essential to the study remains. The effectiveness inmaking such an analytical drawing is in deciding what is to be shown and what is to be left out. Inan analysis, it is quite common to have a series of drawings with limited quantities of data, eachhighlighting specific issues, rather than one drawing containing a great deal of information.Fig. 4 Drawings illustrate process of reduction by omitting all irrelevant data deduced from detailed plan and 3D drawingsAddition: It may become essential for an analytical drawing to introduce information that iseither non-visual or non-architectural. It may be information about functional use, or about theunderlying geometrical system, such as axes and zones. Addition of lines, planes and volumetricenclosures can help greatly to understand the morphological deduction or transformation of thefinal form/s from its original platonic form/s and volume/s. Lines of vision, vertical andhorizontal circulation of movement, lines of force between objects, implied grids, are importantnon-physical elements that need to be included in an analysis and can be achieved by adding suchinformation. The use of graphics need to be chosen carefully so that it does not read as buildingelement or conflict with existing drawing.Fig. 5 Diagrams both in drawing and cardboard model illustrate use of additional elements to represent non-physicalconcepts of design, such as geometric relationships, axis, circulation, etc.Explosion: An effective way to examine the relation between various aspects, systems,elements, layers, and surrounding context is to use exploded drawing techniques. Threedimensional exploded views offer limitless possibilities of showing the manipulation of drawingelements to show more information which is almost impossible in a single plan or elevation.Exploded axonometric or perspective drawings usually combine both plan and three-dimensionalviews in a single drawing to give cross reference between each other. By the technique ofdisassembly this drawing type provides insight into the build-up of the spatial structure of thebuilding under scrutiny. Juxtaposing or superimposing drawings giving complementaryinformation can be very helpful when examining the relationship between different aspects ofdesign. Similarly, taking apart of elements that obstruct information can also be useful.504 EAEA-11 conference 2013 . (Track 3) Conceptual Representation: exploring the layout of the built environment
Graphic representation and processing techniques for form and space analysisFig. 6 Technique of explosion in both drawing and model can be an effective method to illustrate relationships betweenvarious aspects, systems, elements, and layers in analysisSimplification: Constructing drawings that remove all things not important to the analysismakes that particular issue more visible. The simplification process may take account of bothreduction and addition within the same drawing. Additional lines, symbols, or text may beincluded to enhance communication.Fig. 7 Diagrams illustrating process of simplification by removing unnecessary details that are not relevant to the particularconcept of analysisEmphasis: Through emphasis, a part can be highlighted within the context of the whole. Thiscan be done by varying line thickness, line types, and shading. Through a contrast shade ofgraphics, a drawing may easily identify and differentiate the issue of concern. Emphasis can becreated by bringing contrast and hierarchy in graphics.Fig. 8 The process of emphasis in an analytical drawing or model can be achieved by adding contrast and highlightthrough line, shade, color, contrast, etc.5. ConclusionAlthough a general guideline can be drawn from reviewing various authors work, it seemsthat each building may have certain qualities that are unique to that building and an analysis nothaving fixed issues can effectively bring out relevant as well as some new issues. In that context,Geoffrey Baker’s approach may seem to be more suitable to adapt for a building where threedimensional sketches gets priority in representing various concepts of analysis.In regards to representation, some analyses may be very effective with two-dimensional planelevation-section, while others may need three-dimensional exploded axonometric. In anacademic environment cardboard diagram models are the best possible ways to understand abuilding’s analytical components by beginning design students.EAEA-11 conference 2013 . (Track 3) Conceptual Representation: exploring the layout of the built environment 505
Uddin M.S.Although use of Photoshop to highlight relevant portions of hand drawings is effective, 3Dcomputer modeling seems to be lacking features that are important for diagrams. 3D-computeranimation is capable of revealing information through parametric changes of elements in position,orientation, scale, shape, and rendering characteristics to highlight specific concepts of analysis.Software applications may soon need to incorporate features of various line thickness optionsalong with dashed lines, dotted lines, lines with various arrows, combination of wire frame andhidden line, etc. to make applications friendly for 3D analytical diagram models. That day maynot be far when 3D modeling programs would have the power to create improvised diagramsreflecting users’ particular preferences of representation options.This author’s own finding in teaching analysis in sophomore design studio suggests thatcombination of 2D plans/elevations/sections and 3D axonometric along with cardboard diagrammodels are the most effective method of learning and representation of analysis in built-forms.Fig. 9 Formulation and representation of analysis by 2nd year architecture students using 2D drawings, 3D diagrams andanalytical cardboard models. Image illustrates manual drawings, tactile cardboard diagram models, and digital models informulation and representation of analytical componentsReferencesBaker, G.H. (1996). Le Corbusier: An Analysis of Form, Van Nostrand Reinhold, New York,1997, Chapman & Hall, London, Van Nostrand Reinhold, New York, 1984, 1989, 1996.Barker, J., Tucker, R.N. (1990). The Interactive Learning Revolution: Multimedia in Educationand Training, Kogan Page, London / Nichols Publishing, New York.Clark, R., Pause, M. (1985). Precedents In Architecture. New York: Van Nostrand Reinhold.Cotton, B., Oliver, R. (1994). Understanding Hypermedia. London: Phaidon Press Ltd.Falk, D. R., Carlson, H. L. (1995). Multimedia in Higher Education: A Practical Guide to NewTools for Interactive Teaching and Learnin. New Jersey: Learned Information, Inc.Leupen, B., Grafe, C., Kornig, N., Lampe, M., Zeeuw, P. (1997). Design and Analysis. NewYork: Van Nostrand Reinhold.Mitchell, W.J., McCullough, M. (1996). Digital Design Media: A Handbook for Architects &Design Professionals. New York: Van Nostrand Reinhold.Robertson, H. (1924). The Principles of Architectural Composition. London: The ArchitecturalPress.Southerland, M. (1999). Modelmaking: A Basic Guide. New York: W. W. Norton & Company,Inc.Uddin, M.S. (1999). Digital Architecture. New York: McGarw-Hill.Unwin, S. (1997). Analysing Architecture. London, New York: Routledge.506 EAEA-11 conference 2013 . (Track 3) Conceptual Representation: exploring the layout of the built environment
Drawing Conventions . Each analysis may demand its own method of drawing. Some analyses may be very effective with two-dimensional plan, others may need three-dimensional exploded axonometric. Drawings are an abstract representation of reality. All technical drawings are