Transcription
SQL ServerPerformance TuningUsing Wait Statistics:A Beginner’s GuideBy Jonathan Kehayiasand Erin Stellato
SQL Server performance tuning using wait statistics: a beginner’s guideContentIntroduction3The SQLOS scheduler andthread scheduling4Using wait statistics for performancetuning8Investigating active-but-blocked requestsusing sys.dm os waiting tasks9Analyzing historical wait statistics usingsys.dm os wait stats12Common wait types17Wait statistics baselines30Summary40Further reading41About the authors42About the technical editor442
SQL Server performance tuning using wait statistics: a beginner’s guideIntroductionWhen a user application submits to SQL Server a request for data, the biggestelement of SQL Server’s total response time would, ideally, be the CPUprocessing time. In other words, the time it takes the CPU to pull together therequired data, slice, dice, and sort it according to the query specifications and sendit back. However, in a busy database system, with hundreds or thousands of userrequests competing for the limited resources of the database server, there will betimes when a request is waiting to proceed, rather than actively processing. Forexample, Session A’s request may be waiting for Session B to release a lock on aresource to which it needs access.Every time a request is forced to wait, SQL Server records the length of the wait,and the cause of the wait, a.k.a. the wait type, which generally indicates theresource on which the request was waiting. These are the wait statistics, andSQL Server exposes them primarily through two Dynamic Management Views: sys.dm os wait stats (or sys.dm db wait stats on Windows AzureSQL Database) – aggregated wait statistics for all wait types sys.dm os waiting tasks – wait statistics for currently-executing requeststhat are experiencing resource waitsThe basis of performance tuning SQL Server using wait statistics is simply that weinterrogate these statistics to find out the primary reasons why requests are beingforced to wait, and focus our tuning efforts on relieving those bottlenecks.3
SQL Server performance tuning using wait statistics: a beginner’s guideThe SQLOS scheduler and thread schedulingIn order to understand wait statistics in SQL Server, and how SQL Server measures waittimes, we need to delve a little into SQL Server’s scheduling model.More on SQLOSWhen you’re ready to dig deeper, Slava Oks’s, A new platform layer in SQL Server 2005, isold but still serves as a good primer on SQLOS architecture. I also recommend highly PaulRandal’s SQL Server Performance Troubleshooting Using Wait Statistics training course, (seethe Further reading section at the end, for more details).When a user application requests a connection, SQL Server will authenticate the user andthen create for that connection a session, identified by a unique session id. Within thecontext of this connection and the associated session, the user application can submitrequests, such as queries to return data. As soon as the user submits a query, SQL Servergets to work executing it.SQL Server uses operating system threads, or worker threads, to perform the tasksnecessary to complete a given process. Some threads are dedicated (for example, thereis a dedicated thread to perform the CHECKPOINT process) but SQL Server maintains theothers in a thread pool and uses them to process user requests.SQL Server does its own thread scheduling via a pseudo-operating system called theSQLOS, which runs as a part of the SQL Server database engine, and also providesmemory management and other functions to SQL Server.When SQL Server receives a user request, a SQLOS scheduler assigns it to a ‘parent’ task,and the task to a worker thread. If SQL Server decides to parallelize a task, the assignedparent task remains and the SQLOS creates new parallel sub-tasks to which it assignsworkers for the parallel-execution portion of the request (if we impose on a workload amaximum degree of parallelism of one, SQL Server will still generate a parallel plan forexecution but only allow the parent task to execute the parallel operations in the plan).4
SQL Server performance tuning using wait statistics: a beginner’s guideNormally, there is one SQLOS scheduler per CPU “core”. For example, a 16-coreprocessor has 16 physical CPU and so 16 schedulers. An 8-core processor with hyperthreading has 8 physical CPU and 8 logical CPU and, again, 16 schedulers. Only onesession’s worker thread can be running on the CPU at any given time. A thread can be inone of three states, as exposed by the STATUS column of the sys.dm exec requestsDMV: RUNNING – on the CPU.SUSPENDED – whenever a thread requires a resource, such as a page that is not inmemory, the thread yields the CPU and moves onto an unordered waiter list, witha thread status of SUSPENDED, until the required resource is available.RUNNABLE – if a thread is not waiting on any resource, but is not currently on theCPU, for example because the scheduler to which it is assigned currently has anothersession’s thread running, it will be placed in a first-in-first-out (FIFO) queue called therunnable queue and the thread status will be RUNNABLE.The SQLOS allows any given thread a small quantum of processing time (4 ms), before itmust yield the CPU to another session’s thread. If, before its allotted quantum is complete,the running thread needs to request a resource, it moves to the waiter list. Once theresource is available, the thread moves to the back of the runnable queue and then, whenits time comes, back onto the CPU. It then gets another 4 ms quantum of processing time.If it doesn’t have to wait for any resource in this time, but fails to complete its work, it yieldsthe CPU anyway, moves to the back of the runnable queue, and awaits its next turn.Resource waits and signal waitsIdeally, most of the time required to process a user request will be time spent by its threadon the CPU. This is all pure CPU time, or service time. Of course, a complex queryrequiring lots of data, or very complex aggregations and calculations, or both, will requirelonger service time than a small, simple query. SQL Server may decide to parallelizeprocessing of a complex request across several worker threads, and so split the work overseveral CPUs, if available.5
SQL Server performance tuning using wait statistics: a beginner’s guideHowever, there are many reasons why processing of a task, parallel or otherwise, may notbe able to proceed uninterrupted. A request that is on the CPU may be unable to proceedprocessing because it needs to wait for a particular resource to become available. Forexample, it may need to wait for a data page to be read from disk into the buffer cache,or for another request to release a lock on a data page to which it needs access. For adata modification statement, it may need to wait to write the changes, synchronously, tothe database’s transaction log, on disk. As soon as a running thread requires a resource,it is suspended (i.e. it moves to the waiter list). This is known as a resource wait. Everytime a request’s worker thread has to wait for a resource, the SQLOS tracks the time spentwaiting (the wait time) as well as the cause of the wait, called the wait type, which is theresource on which the thread waited.If a thread is ready to run (has been ‘signaled’) but is in the runnable queue, the SQLOStracks the time spent waiting to get back on the CPU. This is referred to as a signal waitand is pure CPU wait. If query response times are slow and we find mainly signal waits,then we may need to focus our efforts on optimizing CPU usage.The total wait time for a thread is the time elapsed between yielding the CPU and gettingback on it, in other words the resource wait time plus the signal wait time.SQLOS’s wait statistics DMVsThe SQLOS exposes this wait statistics data primarily through two dedicated sys.dmos * DMVs.sys.dm os waiting tasksThe sys.dm os waiting tasks DMV is a view onto the waiter list. In it, the SQLOSrecords the wait statistics, i.e. wait types and wait times, for any requests associated with acurrently suspended thread, i.e. any thread that is in the waiter list, waiting for a resource tobecome available.Therefore, we can use this DMV to investigate the primary resource wait types fora server currently experiencing performance issues (wait times and types for currentlyblocked requests also appear in sys.dm exec requests).One common, but not the only, wait type that will show up in sys.dm os waitingtasks is lock-related waits, where for example one long-running request blocks manyother requests for a significant period.6
SQL Server performance tuning using wait statistics: a beginner’s guidesys.dm os wait statsThe sys.dm os wait stats DMV provides the historical perspective of the mostsignificant waits associated with the overall workload on the server. To give just oneexample (we’ll look at many more later), every time a thread, for any request, has to waitwhile SQL Server reads a data page into the buffer cache, then SQLOS adds the recordedwait time to the total cumulative time for a wait of type PAGEIOLATCH SH.In this DMV, the SQLOS records the wait type and the cumulative total wait time for eachtype of wait. The term cumulative total wait time needs a little elaboration: Cumulative – for waits of each type the DMV stores the cumulative wait times, acrossall threads and all sessions, since the last instance restart, or since the last timesomeone cleared out the wait statistics manually.Total – the recorded wait times include both the time spent by a thread in the waiter list(resource wait) and the time it spends in the runnable queue (signal wait).The sys.dm os wait stats DMV stores both the cumulative total wait time inmilliseconds (wait time ms) as well as the cumulative signal wait, i.e. the time spentin the RUNNABLE queue (signal wait time ms). Therefore, we can calculate thecumulative time threads spent in the SUSPENDED list, waiting for a particular resource, asfollows:Resource waits Total waits – Signal waits (wait time ms) - (signal wait time ms).We can use sys.dm os wait stats to investigate the most prevalent resource waittypes over a given period, and to investigate CPU waits, possibly indicating CPU pressure.When using sys.dm os wait stats, it’s very hard to diagnose an ailing system just byexamining the current state of the historical wait data, which may have accumulated overweeks or even months. The waits currently causing issues on the system could easily be‘hidden’ among the accumulated waits. Therefore, it’s important to track these statisticsover time, establish the normal “baseline” for wait types for your workload and then look foranomalies. We’ll explain how to capture waits statistics baselines later in this paper.7
SQL Server performance tuning using wait statistics: a beginner’s guideUsing wait statistics for performance tuningAnalysis of wait statistics represents a very effective means to diagnose response times inour databases. In very simple terms, our requests either work, or they wait:Response time service time wait timeIf we find the response time comprised mainly time spent waiting for a particular resource(disk I/O, memory, network, and so on) then we know where to direct our tuning efforts.However, there are two very important points to remember when using wait statistics forperformance tuning.First, it’s perfectly normal for threads to wait during task execution. In fact, in busydatabases supporting a high degree of concurrent access, it’s almost inevitable that athread for any particular task will have to wait for a resource at some point in its executioncycle, however briefly. If not, it may simply exceed its 4 ms quantum and wait in therunnable queue. Likewise, there are certain wait types that do not indicate a performanceproblem and that we can simply ignore during our wait statistics analysis (more on thislater). What we’re interested in is significant, and recurring, types of waits.Second, wait statistics are not really a tool to use in isolation in order to diagnose aperformance issue. They are best used in conjunction with other diagnostic tools, as a wayto direct our tuning efforts and avoid wasting time in ‘blind alleys’. We need to corroboratewhat we find from analyzing wait statistics with, for example, Windows and SQL Serverperformance monitor (PerfMon) counters, which provide specific resource usagemeasurements (disk transfer rates, amount of CPU time consumed, and so on), whichhighlight the “queues” in our database system. By correlating wait statistics with resourcemeasurements, you can quickly locate the most contested resources on your system, andso highlight potential bottlenecks.SQL Server 2005 waits and queuesThe use of “waits and queues” as the basis for a performance tuning methodology is explainedin an excellent white paper by Tom Davidson, which is available here: 8b9-249e-484c-abd7-29f31282b04d/PerformanceTuning Waits Queues.doc.8
SQL Server performance tuning using wait statistics: a beginner’s guideInvestigating active-but-blocked requests usingsys.dm os waiting tasksWe can investigate the current, “real time” wait profile of a SQL Server instance, in terms ofthe requests and sessions associated with suspended threads, by querying thesys.dm os waiting tasks DMV and joining it to various other useful views andfunctions. The sys.dm os waiting tasks DMV reveals, amongst other columns, the: session id of the session associated with the suspended thread.execution context id of the task associated with the suspended thread. If thereis more than one execution context id associated with a single session idthen SQL Server has parallelized the task.wait type – the current wait type for the suspended thread.wait duration ms – length of time, in ms, that the suspended thread has waitedfor the current wait type.blocking session id – reveals the session id associated with the blockingthread, if a thread is suspended due to blocking, for example because it is waiting toacquire a lock.resource description – for some types of resource, a description of the resourcethe suspended thread is waiting to acquire. For example, if it’s a locking wait, thisreveals the lock level (page, table, and so on) and the ID of the locked resource.As noted previously, many wait types are fleeting and so querying the waiting tasksDMV repeatedly, for a normally-functioning server, will likely reveal an ever-changing profileof wait types. This DMV is most useful when a system is currently experiencing blockingissues, with one or more sessions waiting for resources that other sessions hold.In such cases, we will likely observe significant locking waits (waits of type LCK M XX),indicating that a session is unable to proceed with its work until it can acquire a lock on theresource on which another session’s thread holds a conflicting lock. The most commoncauses of persistent blocking are poor code, which causes SQL Server to hold locks for farlonger than necessary, lack of indexing, or an IO-intensive process that is blocking manyother sessions for long periods. (Of course, if the server under investigation has a persistenthistory of blocking problems, then LCK * waits will also show up prominently insys.dm os wait stats.)9
SQL Server performance tuning using wait statistics: a beginner’s guideListing 1 queries the sys.dm os waiting tasks DMV to show all waiting taskscurrently active or blocked, revealing the wait type, duration, and resource. With a jointo the sys.dm exec requests DMV, on the blocking session id, and CROSSAPPLY to sys.dm exec sql text, we also reveal the identity of the blocked andblocking sessions and the associated statements.SELECTFROMblocking.session id AS blocking session id ,blocked.session id AS blocked session id ,waitstats.wait type AS blocking resource ,waitstats.wait duration ms ,waitstats.resource description ,blocked cache.text AS blocked text ,blocking cache.text AS blocking textsys.dm exec connections AS blockingINNER JOIN sys.dm exec requests blockedON blocking.session id blocked.blocking session idCROSS APPLY sys.dm exec sql text(blocked.sql handle)blocked cacheCROSS APPLY sys.dm exec sql text(blocking.most recent sql handle)blocking cacheINNER JOIN sys.dm os waiting tasks waitstatsON waitstats.session id blocked.session idListing 1: Investigating blocking using the sys.dm os waiting tasks DMVUsing the blocking session id, we can follow the blocking chain and find out whatrequest is at the head of the chain and therefore the root cause of all the locking waits. Wecould easily extend Listing 1 to return the execution plan for the blocked session simplyby joining (using the APPLY operator) to the sys.dm exec query plan function andpassing in the plan handle from sys.dm exec requests.10
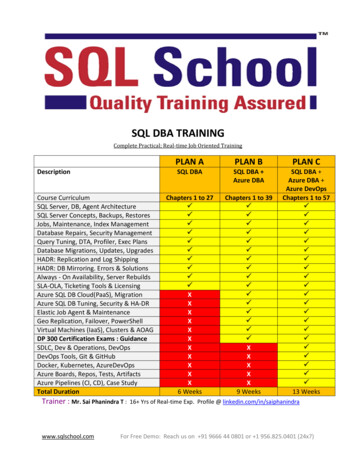
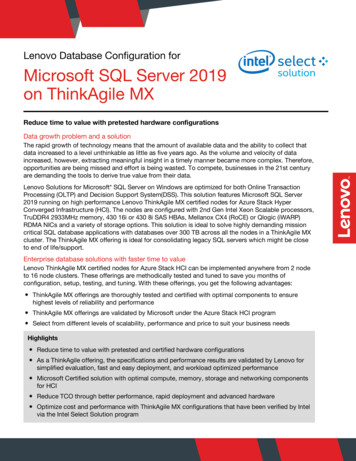
SQL Server performance tuning using wait statistics: a beginner’s guideIn the sample output shown in Figure 1, we see that one session (51) is blocking another(56) from attaining a shared read lock (LCK M S) on a particular page (14985).Figure 1: A locking wait in the sys.dm os waiting tasks outputWe can see the SQL statements executed by both the blocked and blocking sessions. Wecan also use the resource description to find out, for example, the identity of thepage that is the source of blocking contention. Armed with the pageid of the contendedpage, we could use DBCC PAGE to find the owning table and index.From there, we can investigate the index structures to try to find out what might be causingthe blocking. For example, we can return further information about locking, latching, andblocking for specific indexes from sys.dm db index operational stats. We won’tcover that here, but Chapter 5 of the book SQL Server Performance Tuning with DMVsexplains how to return and analyze data from this view.In this manner, we can pinpoint and resolve the root cause of the blocking. Commonly, wemight find that the head of the chain is a substantial update request, or table scan, whichcauses an entire table to be locked and so all other requests on that table to be blocked forthe duration. Other times, we might find a ‘stalled’ IO operation, pointing to potential diskIO issues.It can be useful to corroborate the wait statistics with good baselines for locking relatedPerfMon counts such Lock Waits/sec and Avg Wait Time (ms), and possiblyLock requests/sec, so we can gauge whether the level of locking activity, and lockwaits times, is abnormal.Ultimately, resolution of waits related to locking is an exercise in query tuning and indexstrategy. It is well beyond the scope of this whitepaper to cover those topics here, butChapter 6 of the Troubleshooting SQL Server book offers some good starting points, aswell as further troubleshooting and reporting techniques for blocking issues.See Further Reading for full details of the books referenced in this section, and other usefulresources.11
SQL Server performance tuning using wait statistics: a beginner’s guideAnalyzing historical wait statistics usingsys.dm os wait statsWe can also perform historical wait statistics analysis, using the data provided insys.dm os wait stats. The wait times provided by sys.dm os wait stats arerunning totals, accumulated across all threads and sessions since the server was lastrestarted or the statistics were manually reset using the DBCC SQLPERF command, shownin Listing 2.DBCC SQLPERF (‘sys.dm os wait stats’, CLEAR);Listing 2: Resetting the wait statisticsIf a SQL Server instance has been running for quite a while and then is subjected to asignificant change, such as adding an important new index, it’s worth considering clearingthe old wait stats in order to prevent the old cumulative wait stats masking the impact ofthe change on the wait times.The sys.dm os wait stats DMV gives us a list of all the different types of waits thatthreads have encountered, the number of times they have waited on a resource to beavailable, and the amount of time waited. The following columns are available in the view(times are all in millisecond units): wait type – the type of wait, which generally indicates the resource on which theworked threads waited (typical resource waits include lock, latch disk I/O waits, and soon).wait time ms – total, cumulative amount of time that threads have waited on theassociated wait type; this value includes the time in the signal wait time mscolumn. The value increments from the moment a task stops execution to wait for aresource, to the point it resumes execution.signal wait time ms – the total, cumulative amount of time threads took to startexecuting after being signaled; this is time spent on the runnable queue.waiting tasks count – the cumulative total number of waits that have occurredfor the associated resource (wait type).max wait time ms – the maximum amount of time that a thread has been delayed,for a wait of this type.12
SQL Server performance tuning using wait statistics: a beginner’s guideThere are many reasons why a certain task within SQL Server may need to wait, whichmeans there are many possible values for the wait type column. Some are quite usual,such as the need to wait for a lock to be released before a task can access the requiredresource (e.g. a data page), and are indicated by the “normal” lock modes such as shared,intent, and exclusive. Other common causes of waits include latches, backups, externaloperations such as extended stored procedure execution, replication, and resourcesemaphores (used for memory access synchronization). There are too many to cover themall in detail, though a little later, we’ll examine many of the most common wait types andwhat they indicate. All of the wait types are at least listed, if not well documented, inBooks Online. Alternatively, some third party monitoring tools, such as Red GateSQL Monitor, maintain a useful list of wait types, and possible causes, as part of their tooldocumentation.Identifying high signal waits (CPU pressure)If the signal wait time is a significant portion of the total wait time then it means that tasksare waiting a relatively long time to resume execution after the resources that they werewaiting for became available. This can indicate either that there are lots of CPU-intensivequeries, which may need optimizing, or that the server needs more CPU. The query inListing 3 will provide a measure of how much of the total wait time is signal wait time.SELECTFROMSUM(signal wait time ms) AS TotalSignalWaitTime ,( SUM(CAST(signal wait time ms AS NUMERIC(20, 2)))/ SUM(CAST(wait time ms AS NUMERIC(20, 2))) * 100 )AS PercentageSignalWaitsOfTotalTimesys.dm os wait statsListing 3: Identifying possible CPU pressure via signal wait timeThe sys.dm os wait stats DMV shows aggregated wait times and counts startingfrom when the wait statistics were cleared, or from when the server started. Therefore, a“point-in-time” view of the wait stats is generally not that useful. What is most useful is tocompare the wait stats at a particular time with the stats at an earlier time and see howthey changed. The other option is to clear the wait stats DMV (see Listing 2), and wait a setperiod, and then query and see what’s accumulated in that time.13
SQL Server performance tuning using wait statistics: a beginner’s guideIf signal waits analysis indicates CPU pressure, then the sys.dm os schedulers DMVcan help verify whether a SQL Server instance is currently CPU-bound. This DMV returnsone row for each of the SQL Server schedulers and it lists the total number of tasks thatare assigned to each scheduler, as well as the number that are runnable. Other tasks onthe scheduler that are in the current tasks count but not the runnable taskscount are ones that are either sleeping or waiting for a resource.SELECTFROMWHEREscheduler id ,current tasks count ,runnable tasks countsys.dm os schedulersscheduler id 255Listing 4: Investigating scheduler queuesThe filter for schedulers below 255 removes from the result set the numerous hiddenschedulers in SQL Server, which are used for backups, the Dedicated AdministratorConnection (DAC), and so on, and are not of interest when investigating general CPU load.There is no threshold value that represents the boundary between a “good” and “bad”number of runnable tasks, but the lower the better. A high number of runnable tasks, like ahigh signal wait time, indicate that there is not enough CPU for the current query load. If thescheduler queue is currently long, it’s likely you’ll also see the SOS SCHEDULER YIELDwait type in queries against sys.dm exec requests and sys.dm os waitingtasks.You’ll also want to collect and analyze supporting data from the PerfMon counters thatare of value for monitoring CPU usage, listed below with brief explanations (quoted fromMSDN): Processor/ %Privileged Time – “percentage of time the processor spendson execution of Microsoft Windows kernel commands such as core operating systemactivity and device drivers.”Processor/ %User Time – “percentage of time that the processor spends onexecuting user processes such as SQL Server. This includes I/O requests from SQLServer”Process (sqlservr.exe)/ %Processor Time – “the sum of processor time oneach processor for all threads of the process”.14
SQL Server performance tuning using wait statistics: a beginner’s guideIf you confirm CPU pressure, probably the first step is to determine the most CPU-intensivequeries in your workload, and see if there are ways to tune them. It is beyond the scope ofthis booklet to discuss this topic in detail but an excellent resource is the TroubleshootingSQL Server, A Guide for the Accidental DBA book. Chapter 3 in this book shows howto interrogate the sys.dm exec query stats DMV to find the most costly queries incache by total worker time (i.e. CPU time), joining to the sys.dm exec sql text andsys.dm exec query plan functions to retrieve the text and execution plans for thesequeries.Identifying the primary resource waitsThe primary use of the sys.dm os wait stats DMV is to help us determine on whichwait types and which resources SQL Server has spent the most time waiting, historically,while executing that server’s workload. As noted earlier, it’s important to focus this analysison the most prevalent waits, and also filter out ‘benign’ waits that will occur frequentlyon any database system and are not, except in extreme edge cases, the cause ofperformance issues.Listing 5 is reproduced with permission from the original author, Paul Randal. It providesboth total wait times as well as resource and signal wait times, filters out many benignwaits, and performs some math to present very clearly the most significant waits,historically, on the instance. Periodically, Paul amends and improves the query in his originalpost, for example to expand the benign waits filter. It’s worth checking his post for thelatest version.This listing will help us locate the biggest bottlenecks, at the instance level, allowing us tofocus our tuning efforts on a particular type of problem. For example, if the top wait typesare all disk I/O related, then we would want to investigate this issue further using diskrelated DMV queries and PerfMon counters.15
SQL Server performance tuning using wait statistics: a beginner’s guideWITH[Waits]AS ( SELECTFROMWHEREGO[wait type] ,[wait time ms] / 1000.0 AS [WaitS] ,( [wait time ms] - [signal wait time ms] ) / 1000.0AS [ResourceS] ,[signal wait time ms] / 1000.0 AS [SignalS] ,[waiting tasks count] AS [WaitCount] ,100.0 * [wait time ms] / SUM( [wait time ms] ) OVER ( )AS [Percentage] ,ROW NUMBER ( ) OVER ( ORDER BY [wait time ms] DESC )AS [RowNum]sys.dm os wait stats[wait type] NOT IN ( N’BROKER EVENTHANDLER’,N’BROKER RECEIVE WAITFOR’,N’BROKER TASK STOP’,N’BROKER TO FLUSH’,N’BROKER TRANSMITTER’,N’CHECKPOINT QUEUE’, N’CHKPT’,N’CLR AUTO EVENT’,N’CLR MANUAL EVENT’, wait type filter truncated.See code download ))SELECT [W1].[wait type] AS [WaitType] ,CAST ([W1].[WaitS] AS DECIMAL(14, 2)) AS [Wait S] ,CAST ([W1].[ResourceS] AS DECIMAL(14, 2)) AS [Resource S] ,CAST ([W1].[SignalS] AS DECIMAL(14, 2)) AS [Signal S] ,[W1].[WaitCount] AS [WaitCount] ,CAST ([W1].[Percentage] AS DECIMAL(4, 2)) AS [Percentage] ,CAST (( [W1].[WaitS] / [W1].[WaitCount] ) AS DECIMAL(14, 4))AS [AvgWait S] ,CAST (( [W1].[ResourceS] / [W1].[WaitCount] ) AS DECIMAL(14, 4))AS [AvgRes S] ,CAST (( [W1].[SignalS] / [W1].[WaitCount] ) AS DECIMAL(14, 4))AS [AvgSig S]FROM [Waits] AS [W1]INNER JOIN [Waits] AS [W2] ON [W2].[RowNum] [W1].[RowNum]GROUP BY [W1].[RowNum] ,[W1].[wait type] ,[W1].[WaitS] ,[W1].[ResourceS] ,[W1].[SignalS] ,[W1].[WaitCount] ,[W1].[Percentage]HAVING SUM([W2].[Percentage]) - [W1].[Percentage] 95;Listing 5: Report on top resource waits16
SQL Server performance tuning using wait statistics: a beginner’s guideCommon wait typesIn general, when examining wait statistics, either historically or for currently active requests,it’s wise to focus on the top waits, according to wait time, and look out for high wait timesassociated with the following specific wait types (some of which we’ll cover in more detail insubsequent sections). CXPACKETOften indicates nothing more than that certain queries are executing with parallelism;CXPACKET waits in the server are not an immediate sign of problems, although theymay be the symptom of another problem, associated with one of the other high valuewait types on the instance. SOS SCHEDULER YIELDThe tasks executing in the system are yielding the scheduler, having exceeded theirquantum, and are having to wait in the runnable queue for other tasks to execute. Asdiscussed earlier, this wait type is most often associated with high signal wait ratherthan waits on a specific resource. If you observe this wait type persistently, investigatefor other evidence that may confirm the server is under CPU pressure. THREADPOOLA task had to w
SQL Server does its own thread scheduling via a pseudo-operating system called the SQLOS, which runs as a part of the SQL Server database engine, and also provides memory management and other functions to SQL Server. When SQL Server receives a user request, a SQLOS scheduler assign