Transcription
SQL Query Tuning for SQL ServerGetting It Right the First TimeBy Dean Richards, Manager Sales Engineering, Senior DBAConfio Software4772 Walnut Street, Suite 100Boulder, CO 80301www.confio.com
A White Paper by Confio Software, now part of the SolarWinds familyIntroductionAs a Senior DBA, I get to review SQL Server database performance data with hundreds of customers ayear. During the review process I provide performance improvement recommendations based on theresponse time data from SolarWinds Database Performance Analyzer (DPA). I also try to go above andbeyond the raw data to provide valuable performance tuning tips for our customers. Over the years, Ihave developed a process that works time and time again. This process is the focus of this white paperand follows four fundamental steps:1.2.3.4.Focus on the correct SQL statementsUtilize response time analysisGather accurate execution plansUse SQL diagrammingWhy focus on SQL statements?When I think about performance tuning for a database environment, the following three types of tuningapproaches come to mind: Application Tuning—tune the application code to process data more efficiently.Instance Tuning—tune the SQL Server instance via modification of parameters or altering theenvironment in which the database executes.SQL Statement Tuning—tune the SQL statements used to retrieve data.The third approach, SQL tuning, seems to be a point of contention with many of our customers becauseit is often unclear which group (database administration or development) is responsible. This is also thearea where I tend to focus my efforts for reasons discussed throughout this paper.I am often asked why I focus on SQL statement tuning rather than instance or application tuning.Instance and application tuning are definitely beneficial in the right circumstances; however, I typicallyfind that SQL tuning provides the most “bang for the buck” because it is often the underlyingperformance issue. My experience is that approximately 75-85% of the performance problems weresolved using SQL tuning techniques.Why does SQL tuning provide the most benefit? Most applications (there will always be exceptions)accessing databases on the backend require simple manipulation of data. There are typically no complexformulas or algorithms that require significant application time and thus tuning. These applications alsodeal with smaller amounts of data so even if the processing of that data is inefficient, it does notbecome a significant portion of the total waiting time for the end user. For example, a web applicationthat displays the status of an order may only manipulate a few rows of data. Even if processing thoserows is done inefficiently as possible, the total time will still be relatively small.SQL Query Tuning for SQL Server 2012 Confio Software2
A White Paper by Confio Software, now part of the SolarWinds familyOn the flip side, the database is responsible for examining large amounts of data to retrieve the status ofthat order. There may be several tables involved containing millions of rows of data each andinefficiencies can quickly become huge bottlenecks. Tuning the underlying query in this case typicallyprovides the most performance benefit rather than focusing on the application code.Which SQL statement should be tuned?If SQL statement tuning can provide the most benefit, the next question is “Which SQL statement shouldI focus on”? Often I find that a DBA or developer did a great job of tuning a SQL statement, but laterdiscovered it was not the root cause of the performance problem the end users were complainingabout. Tuning the wrong SQL statement is clearly a waste of time, so what is the best way to knowwhich SQL to tune? Many will choose a poorly performing SQL using the following metrics about thosestatements: Perform the most logical I/OConsume the most CPUPerform costly full table or index scansUse an execution plan with a high costAnd many more What if the underlying problem was a blocking issue for a SQL statement? The problematic queries maynot appear in any of these lists and you would miss them. How do you know which queries are causingyour performance issues? In my opinion, the answer lies in measuring total elapsed times rather thanusing the above measurements, i.e. which SQL statements spend the most time executing in thedatabase. A query similar to the following will retrieve a list of SQL statements from SQL Server takingthe longest cumulative time to execute:SELECT sql handle, statement start offset, statement end offset,plan handle, execution count, total logical reads,total physical reads, total elapsed time, st.textFROM sys.dm exec query stats AS qsCROSS APPLY sys.dm exec sql text(qs.sql handle) AS stORDER BY total elapsed time DESCWhen end-users complain about performance they will say something similar to: “When I click thesubmit button on this web page, it takes 30-40 seconds.” They use elapsed time as a way to describe theproblem, so why not use elapsed time when finding the queries to tune.The query above will provide a definitive list of SQL statements with the highest elapsed time sinceinstance startup. Often this may be based on a timeframe of several months or even longer, socollecting and saving this data periodically with deltas will provide the best information. For example,running a query similar to the above (along with other pertinent data based on your application) every10 minutes and saving the data will allow you to go back in time to find a problem. If an end-usercomplains about performance from yesterday at 3:00 p.m., reviewing the archived data from aSQL Query Tuning for SQL Server 2012 Confio Software3
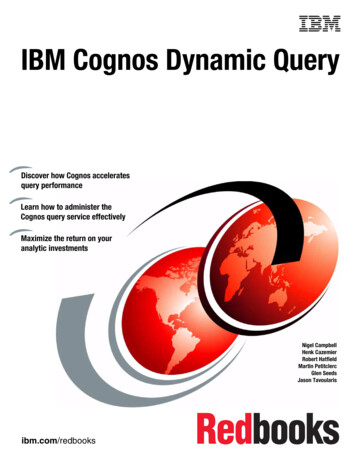
A White Paper by Confio Software, now part of the SolarWinds familytimeframe around 3:00 yesterday will help you understand what was performing poorly during theproblematic time.A much easier method for collecting this type of data and finding the problematic SQL statement is touse a response time based performance analysis tool like SolarWinds Database Performance Analyzer(DPA). DPA collects response time data once per second (with less than 1% overhead) about all SQLstatements and can quickly rank them according to the ones causing the most response time. Thescreenshot below shows the Top 15 SQL statements in a SQL Server instance from a total elapsed timeperspective. This provides a good proactive of the SQL statements causing issues over a 30-day window.Drilling into the day and time a performance problem occurred using DPA in a firefighting scenario, caneasily tell you which SQL statements caused a specific performance issue.See the database response time viewOnce the most problematic SQL is known, whether that comes from the proactive view or thefirefighting scenario, understanding why the SQL is slow is paramount. Is the problem an unnecessaryfull table scan, a locking issue, disk I/O related, etc? SQL Server wait types very clearly show each ofthese problems.SQL Query Tuning for SQL Server 2012 Confio Software4
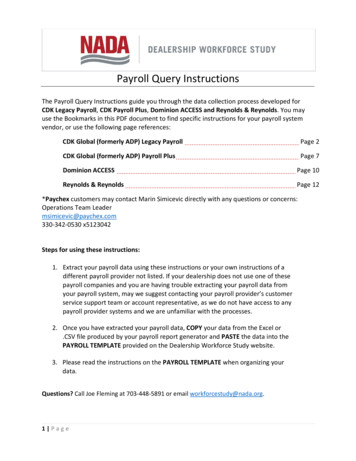
A White Paper by Confio Software, now part of the SolarWinds familyFocus on Response TimeThe picture above depicts a SQL statement entering the SQL Server instance and going through a seriesof steps. These steps may include reading data from disk, waiting on a locking issue, waiting for theinstance to commit data, and many more. Measuring the total execution time for a SQL statementreveals which SQL to tune and measuring how much time that SQL waits on specific steps provides thebest clues for fixing the issue. For example, if a SQL statement executes for 40 seconds, what is themajor cause of that delay? A SQL that waits on an event named “PAGEIOLATCH SH” may means it iswaiting on physical disk I/O and possibly performing a full table scan, while waits on “LCK M X” indicatethe SQL is experiencing a locking issue. The solutions for these problems are much different and arewhere wait types help the most.Obtaining the wait type informationTo see what an active query is currently waiting for, the dm exec requests table provides that data. Aquery similar to the following can be used:select status, start time, sql handle, plan handle, statement start offset,statement end offset,CASE wait time WHEN 0 THEN 'Memory/CPU' ELSE wait type END AS wait typefrom sys.dm exec requests where session id 72Also, when drilling into the DPA for SQL Server data, wait types are the primary metric used to show whythe SQL runs slowly. Unlike the query used above that only shows real time data, DPA can also showhistorical data about the SQL statement.The following table shows the most common wait types (based on DPA data summarized from hundredsof customers) along with brief ideas for tuning SQL statements waiting on these events.SQL Query Tuning for SQL Server 2012 Confio Software5
A White Paper by Confio Software, now part of the SolarWinds familyWait Event / SuggestionsMemory/CPU Waiting to read data from memory or executingCPU intensive code Tune queries to read less data, i.e. use an index Avoid excessive use of inline user-defined functionsPAGEIOLATCH SH, PAGEIOLATCH EX Tune indexes Tune disks Increase buffer cacheCXPACKET Reduce parallelism at query level (MAXDOP) Reduce parallelism at server level Turn off hyperthreadingASYNC NETWORK IO Reduce amount of data query is returning Speed up network between server and clientWRITELOG Tune applications to commit data less often Tune disks where transaction logs exist Set isolation level appropriately Size transaction log properlyMSQL XP Waiting on extended stored procedure Tune extended stored procedureLCK M S, LCK M X, LCK M IX, LCK M * Tune blocking queries so locks are release faster Ensure proper error handling so locks are released Code applications to fetch all result rows Use proper isolation levels Check for orphaned processes holding locksLATCH EX More than one session is trying to access samepage of memory Tune queries so they read less data from memoryWait ClassUser rencyExecution planExecution plans further the understanding of how the SQL is executing and where the inefficiencies maylie. If there are five tables involved and the query waits mostly on “PAGEIOLATCH SH” possiblyindicating a full table or index scan, the plan will help determine where that is occurring. Plans supplycosting information, data access paths, join operations and many other things to aid in tuning efforts.However, not all plans are useful. Do you know that getting a plan from SQL Server Management Studio(SSMS) can be wrong and not match how SQL Server is really executing the statement? It can be wrongbecause the query is executing from inside SSMS and not from the application code and environment.The application may set session variables that are not set from SSMS, parameter data types may bedefined differently, and many other things. This plan is also for the present time, and may be muchdifferent than the plan used yesterday at 3:00 pm when the problem was occurring. If plans from SSMSSQL Query Tuning for SQL Server 2012 Confio Software6
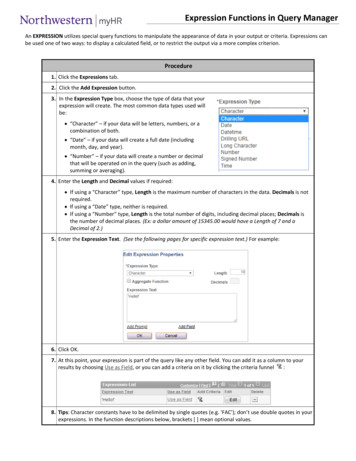
A White Paper by Confio Software, now part of the SolarWinds familycan be wrong, where is a better place to retrieve the correct one? The best places to get execution planinformation are:1. dm exec query plan() or dm exec text query plan() – contains raw data for execution plansof SQL statements. It provides the plan SQL Server used so why not go straight to the source.Using dm exec query plan from SSMS will provide a nice graphical view of the plan. To use thisDMO, pass in the plan handle value from the query above against the dm exec requests DMV.2. Tracing – provides great information as well as executions plans for a specific session, user orthe entire system.3. Historical Data – if possible, collect and save execution plan information so you can go back to3:00 pm yesterday to understand why the SQL statement performed poorly.DPA for SQL Server collects execution plans in real time and associates them with the SQL statements,wait types and other performance data. It is shown graphically with popup dialogs when mousing overspecific steps in the plan. DPA also keeps this data historically so you can go back to the problem at 3:00pm to find exactly which plan was being used. Querying plans from the DMVs or getting them fromtracing will not provide this historical view.Not all plans are created equalHere is an example where, based on response time data, we believed the query was doing a full tablescan since the SQL was spending over 95% of its execution time waiting for PAGEIOLATCH SH and thelogical and physical reads were very high per execution. However, when we reviewed the plan outputfrom SSMS, the query looked very efficient and seemed to be using an index to retrieve the data. Hereis the statement and the plan:SELECT company, attribute FROM data out WHERE segment @S1;Plan from SSMSSQL Query Tuning for SQL Server 2012 Confio Software7
A White Paper by Confio Software, now part of the SolarWinds familyHow is this possible? It is a very simple query with one criterion in the WHERE clause, so if it is executingvery efficiently, why are the end-users waiting 20 seconds for this query each time it executes? Theanswer is revealed when we review the real execution plan from a trace or by retrieving it from thedm exec query plan DMO:select sql handle, plan handle from sys.dm exec requests where session id 72-- returned the plan handle used in the next queryselect query plan from sys.dm exec query 00000)-- graphical plan was displayed by clicking on the query plan data in SSMSIn this example, the plan handle value is retrieved from the dm exec requests DMV which showsexecuting session information. The handle is passed into the dm exec query plan DMO to get the realexecution plan. In this case, a full table scan is being done as we suspected. I
As a Senior DBA, I get to review SQL Server database performance data with hundreds of customers a year. During the review process I provide performance improvement recommendations based on the response time data from SolarWinds Database Performance Analyzer (DPA). I also try to go above and beyond the raw data to provide valuable performance tuning tips for our customers. Over the years, I .