Transcription
Why visual analytics?By Nancy Matthew, Technical Writer, Research and Design
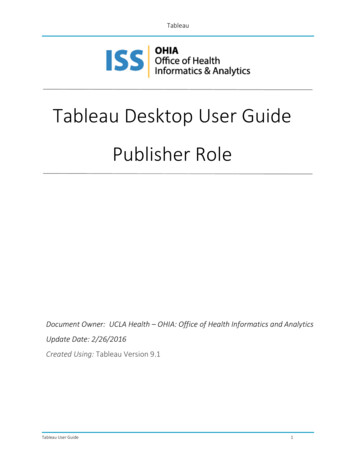
Why visual analytics?Discover the unexpected; it’s all about the journey. Sounds like the beginning of a travelbrochure, right? Well, it fits because visual analytics helps you navigate a world full of data.When you are trying to make sense out of your data, where do you begin? Two popularapproaches to visual data analysis include data visualization and visual analytics. Eachplays an important role in data exploration. You don’t have to choose one or the other—they both help you to see and understand your data.Data exploration usually starts with a question. But the answer to that question doesn’tneed to be the end of the journey.In this article:Asking “what” and “why”The power of asking whyWhat visual analytics can do for youAsking “what” and “why”Recommendedreading:Check outDefine Analyticsto tease out thedifferences betweenvisual analytics,advanced analytics,smart analytics,and more.A data visualization is a graphical depiction of data, such as dashboard or report. Datavisualizations present views of data that answer “what,” such as, “What are our sales andprofits, for different regions, and different months or years?” They are good for answeringa finite set of questions, and can be static or provide some level of interactivity forinvestigating those questions.Being able to answer “what” questions in your data is incredibly valuable. It helps to tell astory about your data, and to identify problems and issues.2
Figure 1: Interactive dashboard that shows sales and profits by regionFor many people, creating dashboards and reports are the goal and final destination oftheir data exploration. But what if the data is revealing some type of issue, such as lowerprofits for a certain region or type of product?To get to the root cause of an issue or problem, you need to be able to explore thedashboard’s data directly, beyond the limits of a canned set of filters and categories. Youmight need to view the data with new types of visualizations, beyond the constraints ofreport templates and canned chart types, to answer your own questions.The power of asking whyAnswering “what” is the first step in exploring data. The next step is asking “why.” To digdeeper, you need to be able to ask why and why again. When you need to learn more aboutwhat the data is telling you, you need visual analytics.Visual analytics is a dynamic, iterative process where you quickly build different views toexplore infinite paths of “whats,” and the “whys” behind them. Visual analytics can helpyou explore, find answers, and build stories in your data. It even goes beyond those initialinsights, so everyone who sees the visualization can ask questions and make unexpecteddiscoveries.3
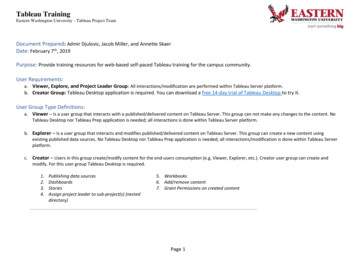
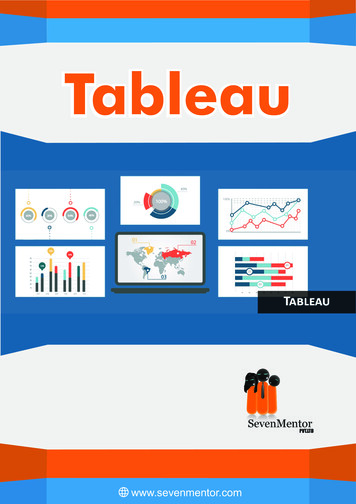
An example of visual analytics in practiceThe following example walks through a typical visual analytics workflow. Let’s go backto the interactive sales report dashboard. It is a data visualization that answers a set ofquestions about sales and profits, for different regions.Figure 2: Dashboard with information about sales metrics analysis and KPIsFurniture is not hitting the profit target, but looking at different regions isn’t showingme why. To explore why, I want to create a new view that shows sales and profits for eachtype of product included in Furniture.Figure 3: Dual bar chart shows selling tables results in loss of profit4
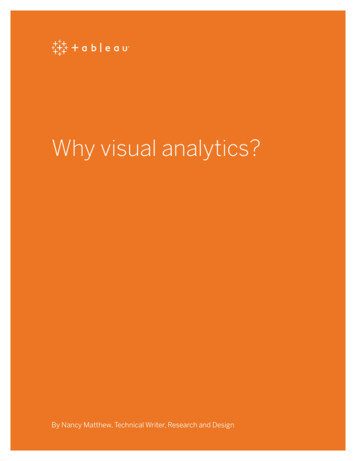
Now I see that tables are not profitable. To answer why, I’ll look at sales and profits fortable manufacturers only.Figure 4: Scatterplot shows table profits by manufacturerWhy are so many different brands of tables losing money? We often apply discounts totables. I’m going to change the view to see what level of discounts have been applied toevery table sale order.Figure 5: Table profit and discounts, encoded with color, by manufacturer5
It looks like selling tables at a discount is creating lost profits. I’ve found the root cause ofour issue.Recommendedreading:Find out what the6 must-havesfor advancedanalytics are.Being able to ask why and quickly see the answer in my data revealed the underlyingcause (discounting strategy) to the original problem (lack of profit in furniture).Now what if I told you that I was able to create all of the views for that exploration inunder 10 minutes? That is pretty fast. Think about the time a tool like this can save you inyour daily work. That is the power of visual analytics.Why visual analytics is effectiveVisual analytics is a method for exploring data visually, in real-time. A productive visualanalytics experience has certain characteristics. At any moment, you can: I nstantly change what data you are looking at (with one click). This is important becausedifferent questions require different data. I nstantly change the way you are looking at it (with one click). This is important becausedifferent views of data answer different questions.With each incremental change, the view of the data updates immediately to help youintuitively explore different visualization types to find the right one. You can focus onexploring, instead of the mechanics of how to build a specific chart or being locked intoa canned template. The meaning in your data unfolds as you create different views toanswer different questions—so your exploration leads to better analysis, not dead ends.Your questions and incremental changes don’t touch the underlying data; they onlychange how the data is visually represented. Because the changes are made incrementally,it is always possible to undo, redo or return to a previous state. Every action is safe,because it can be instantly undone.Best of all, the visual analytics process can lead to visualizations that show you theunexpected. Imagine how surprise findings can stimulate your thought process, andencourage deeper analysis or a different path of exploration.6
Visual Analytics and data visualization csAnswers and shows “what.”Shows data points, problems, issues, or key indicators.Presents a specific view of a data set. Gives you andusers a snapshot of data to answer a specific set ofquestions.A visual presentation of data, such as a dashboard or areport. Great device for communicating insights andtelling stories about data.Supports interactivity (filter dimensions, highlight valuesof interest, change view based on categories)Supports deeper analysis and exploration for asking“why” questions.Offers advanced analytics.A journey through your data that doesn’t require you toknow what chart type or template you need, or whereyou are going.Unifies the steps of querying, exploring and visualizationdata into a single process.Fast, intuitive, freeform exploration of data that lets youquickly create many different views of your data.Helps you think visually to explore problems, issues, andquestions. Leads to unexpected insights and findingoutliers in your data.Helps you share key insights and collaborate withcolleagues on the data.7
What visual analytics can do for youA high-quality visual analytics platform helps you to easily create impactfulvisualizations and dashboards, and encourages exploration to identify new opportunitiesfor your business. The right solution supports data exploration, data visualization, andintuitive ad-hoc analysis.When you need to, you can dive into and explore your data in an immediate, visual way,and follow your analysis at the speed of thought. After you hone in on the visualizationsthat are most useful for communicating your insights, you should be able to share thoseinsights easily and securely.Ask and answer your own questions, at the speed of thoughtA visual analytics platform supports self-reliance; you shouldn’t have to go through otherpeople to ask the business questions that you need to ask. Being able to directly access tothe data you need, and ask your own questions, makes you an incredibly valuable resourceto your organization. It frees up another curious, smart mind (yours) to be able to identifyissues and suggest solutions.You can forage freely in the data you are interested in, identifying outliers and reachingmeaningful insights much faster. Visual analytics supports self-directed, open-endeddata exploration that lets you follow your thoughts visually down different paths.Your exploration can include recognized chart types, but should not be constrained bythem. When you are constrained by a specific analysis path that is locked into a specificstructure (a chart type, or a template, or a wizard), your analysis and paths for explorationbecome limited.Visual analytics gives you immediate answers because the structure for your analysis iscreated anew, instantly, every time you ask a new question. And you should be able toanalyze data in an ad-hoc way, from different databases and spreadsheets at the sametime, in the same view.8
A visual analytics workspace should be easy and intuitive to learn, but also supportadvanced analytics when needed.Your visual analytics workspace should automatically suggest visual best practices, soyou can create the best visualization to communicate your insights effectively. Yourdata questions should drive the structure of the visualization, not the other way around(form follows the data)—but you shouldn’t have to memorize every chart type and knowwhen to use which one. In other words, the right visual analytics platform will help youdetermine how to apply color, shape, text, and overall layout so your data tells the storyyou want it to.Data and visualization should work in tandem. The steps of querying, exploring andvisualizing data should come together in a single process. Good visual analytics allowsfor fast exploration, iteration, prototyping and sketching with data to support the wayyou think.Recommended reading:Discover Tableau’sapproach to thedevelopment ofanalytics software.It needs to cater to your question-and-answer process, no matter how complicatedit becomes: Visual analytics software should support your analysis. When you needto predict sales in the future, for instance, your software should allow for predictiveforecasting; when you want to understand a trend, drag and drop trend lines should beavailable. Helps you make an impact in your organizationWhen you are able to create meaningful, insightful visualizations on a consistent basis,you increase your visibility and contribution in your organization. No matter where yousit or what your title is, you can provide key information that contributes to making betterbusiness decisions.In most organizations, unshared discoveries are useless. You should be able to share yourinsights and collaborate on results, on-premise or in the cloud. Every time you discoversomething new in your data, you should be able to share your “hey, look at this” moments.Sharing your findings leads to your colleagues discovering their own insights. It helps all ofyou put more brain power towards getting better answers and finding better solutions.9
About TableauTableau helps people transform data into actionable insights that make an impact.Easily connect to data stored anywhere, in any format. Quickly perform ad hoc analysesthat reveal hidden opportunities. Drag and drop to create interactive dashboards withadvanced visual analytics. Then share across your organization and empower teammatesto explore their perspective on data. From global enterprises to early-stage startupsand small businesses, people everywhere use Tableau’s analytics platform to see andunderstand their data.Next stepsLearn moreVisual analysis guidebookDesigning great visualizationsVisual analysis for everyoneApplying 5 Why’s webinarWhy scribbling is the key to truly understanding your dataWhat can data-viz authors learn from punks?
your daily work. That is the power of visual analytics. Why visual analytics is effective Visual analytics is a method for exploring data visually, in real-time. A productive visual analytics experience has certain characteristics. At any moment, you can: Instantly change what data you are looking at (with one click). This is important because