Transcription
On MANOVA using STATA, SAS & RFares Qeadan, Ph.DDepartment of Internal MedicineDivision of Epidemiology, Biostatistics, & Preventive MedicineUniversity of New Mexico Health Sciences CenterJuly 13, 2015Fares Qeadan, Ph.DJuly 13,Biostatistics,20151 /&80On MANOVA(DepartmentusingofSTATA,InternalSASMedicine& R Division of Epidemiology,Pre
OutlineIntroductionWhat is MANOVA?Why is MANOVA?Functional Form & NotationsAssumptionsHypothesesRemarksFares Qeadan, Ph.DJuly 13,Biostatistics,20152 /&80On MANOVA(DepartmentusingofSTATA,InternalSASMedicine& R Division of Epidemiology,Pre
OutlineIntroductionWhat is MANOVA?Why is MANOVA?Functional Form & NotationsAssumptionsHypothesesRemarksOne-way MANOVA ExampleTheTheTheTheFares Qeadan, Ph.DProblemSolution using STATASolution using SASSolution using RJuly 13,Biostatistics,20152 /&80On MANOVA(DepartmentusingofSTATA,InternalSASMedicine& R Division of Epidemiology,Pre
OutlineIntroductionWhat is MANOVA?Why is MANOVA?Functional Form & NotationsAssumptionsHypothesesRemarksOne-way MANOVA ExampleTheTheTheTheProblemSolution using STATASolution using SASSolution using RNote on Profile AnalysisFares Qeadan, Ph.DJuly 13,Biostatistics,20152 /&80On MANOVA(DepartmentusingofSTATA,InternalSASMedicine& R Division of Epidemiology,Pre
OutlineIntroductionWhat is MANOVA?Why is MANOVA?Functional Form & NotationsAssumptionsHypothesesRemarksOne-way MANOVA ExampleTheTheTheTheProblemSolution using STATASolution using SASSolution using RNote on Profile AnalysisFares Qeadan, Ph.DJuly 13,Biostatistics,20152 /&80On MANOVA(DepartmentusingofSTATA,InternalSASMedicine& R Division of Epidemiology,Pre
OutlineIntroductionWhat is MANOVA?Why is MANOVA?Functional Form & NotationsAssumptionsHypothesesRemarksOne-way MANOVA ExampleTheTheTheTheProblemSolution using STATASolution using SASSolution using RNote on Profile AnalysisCitationFares Qeadan, Ph.DJuly 13,Biostatistics,20152 /&80On MANOVA(DepartmentusingofSTATA,InternalSASMedicine& R Division of Epidemiology,Pre
OutlineIntroductionWhat is MANOVA?Why is MANOVA?Functional Form & NotationsAssumptionsHypothesesRemarksOne-way MANOVA ExampleTheTheTheTheProblemSolution using STATASolution using SASSolution using RNote on Profile AnalysisCitationReferencesFares Qeadan, Ph.DJuly 13,Biostatistics,20152 /&80On MANOVA(DepartmentusingofSTATA,InternalSASMedicine& R Division of Epidemiology,Pre
OutlineIntroductionWhat is MANOVA?Why is MANOVA?Functional Form & NotationsAssumptionsHypothesesRemarksOne-way MANOVA ExampleTheTheTheTheProblemSolution using STATASolution using SASSolution using RNote on Profile AnalysisCitationReferencesLinks to Data and SyntaxFares Qeadan, Ph.DJuly 13,Biostatistics,20152 /&80On MANOVA(DepartmentusingofSTATA,InternalSASMedicine& R Division of Epidemiology,Pre
IntroductionMANOVAWhat is MANOVA:Multivariate analysis of variance (MANOVA) is a statistical test forcomparing multivariate means of several groups.Fares Qeadan, Ph.DJuly 13,Biostatistics,20153 /&80On MANOVA(DepartmentusingofSTATA,InternalSASMedicine& R Division of Epidemiology,Pre
IntroductionMANOVAWhat is MANOVA:Multivariate analysis of variance (MANOVA) is a statistical test forcomparing multivariate means of several groups.MANOVA is an extension of ANOVA such that main effects andinteractions are assessed on a linear combination of a set of two ormore continuous dependent variables (DVs) [1]. Think of it asANOVA for situations when there are several continuous dependentvariables.Fares Qeadan, Ph.DJuly 13,Biostatistics,20153 /&80On MANOVA(DepartmentusingofSTATA,InternalSASMedicine& R Division of Epidemiology,Pre
IntroductionMANOVAWhat is MANOVA:Multivariate analysis of variance (MANOVA) is a statistical test forcomparing multivariate means of several groups.MANOVA is an extension of ANOVA such that main effects andinteractions are assessed on a linear combination of a set of two ormore continuous dependent variables (DVs) [1]. Think of it asANOVA for situations when there are several continuous dependentvariables.MANOVA searches for the best linear combinations of the dependentvariables, for directions in the data space, which maximizes groupseparation (i.e. the ratio of between-group and within-groupvariances) [4].Fares Qeadan, Ph.DJuly 13,Biostatistics,20153 /&80On MANOVA(DepartmentusingofSTATA,InternalSASMedicine& R Division of Epidemiology,Pre
IntroductionMANOVAWhat is MANOVA:Multivariate analysis of variance (MANOVA) is a statistical test forcomparing multivariate means of several groups.MANOVA is an extension of ANOVA such that main effects andinteractions are assessed on a linear combination of a set of two ormore continuous dependent variables (DVs) [1]. Think of it asANOVA for situations when there are several continuous dependentvariables.MANOVA searches for the best linear combinations of the dependentvariables, for directions in the data space, which maximizes groupseparation (i.e. the ratio of between-group and within-groupvariances) [4].MANOVA is a two-stage test in which an overall test is firstperformed with subsequent tests to tease apart group differences [5].Fares Qeadan, Ph.DJuly 13,Biostatistics,20153 /&80On MANOVA(DepartmentusingofSTATA,InternalSASMedicine& R Division of Epidemiology,Pre
IntroductionMANOVAWhy is MANOVA:Researchers are interested in evaluating mean differences on severaldependent variables simultaneously while controlling for theintercorrelations among them [2].Fares Qeadan, Ph.DJuly 13,Biostatistics,20154 /&80On MANOVA(DepartmentusingofSTATA,InternalSASMedicine& R Division of Epidemiology,Pre
IntroductionMANOVAWhy is MANOVA:Researchers are interested in evaluating mean differences on severaldependent variables simultaneously while controlling for theintercorrelations among them [2].Statistically, with correlated DVs, MANOVA is a more powerful testthan conducting separate ANOVAs [6] (conducting a series ofANOVAs inflates type I error rates while MANOVA helps to controlfor it).Fares Qeadan, Ph.DJuly 13,Biostatistics,20154 /&80On MANOVA(DepartmentusingofSTATA,InternalSASMedicine& R Division of Epidemiology,Pre
IntroductionMANOVAWhy is MANOVA:Researchers are interested in evaluating mean differences on severaldependent variables simultaneously while controlling for theintercorrelations among them [2].Statistically, with correlated DVs, MANOVA is a more powerful testthan conducting separate ANOVAs [6] (conducting a series ofANOVAs inflates type I error rates while MANOVA helps to controlfor it).MANOVA allows for more examinations of group differences than isthe case for ANOVA (see Hypotheses section)[3].Fares Qeadan, Ph.DJuly 13,Biostatistics,20154 /&80On MANOVA(DepartmentusingofSTATA,InternalSASMedicine& R Division of Epidemiology,Pre
IntroductionMANOVAWhy is MANOVA:Researchers are interested in evaluating mean differences on severaldependent variables simultaneously while controlling for theintercorrelations among them [2].Statistically, with correlated DVs, MANOVA is a more powerful testthan conducting separate ANOVAs [6] (conducting a series ofANOVAs inflates type I error rates while MANOVA helps to controlfor it).MANOVA allows for more examinations of group differences than isthe case for ANOVA (see Hypotheses section)[3].MANOVA utilizes more information from the data, using therelationship between the DVs, than does ANOVA [5].Fares Qeadan, Ph.DJuly 13,Biostatistics,20154 /&80On MANOVA(DepartmentusingofSTATA,InternalSASMedicine& R Division of Epidemiology,Pre
IntroductionMANOVAWhy is MANOVA:Researchers are interested in evaluating mean differences on severaldependent variables simultaneously while controlling for theintercorrelations among them [2].Statistically, with correlated DVs, MANOVA is a more powerful testthan conducting separate ANOVAs [6] (conducting a series ofANOVAs inflates type I error rates while MANOVA helps to controlfor it).MANOVA allows for more examinations of group differences than isthe case for ANOVA (see Hypotheses section)[3].MANOVA utilizes more information from the data, using therelationship between the DVs, than does ANOVA [5].MANOVA may detect combined differences not found in theunivariate tests [6].Fares Qeadan, Ph.DJuly 13,Biostatistics,20154 /&80On MANOVA(DepartmentusingofSTATA,InternalSASMedicine& R Division of Epidemiology,Pre
IntroductionMANOVAFunctional Form & Notations:Using the notations of Johnson and Wichern [7], with slight modification,suppose we have p 1 continuous dependent variables, then the one-wayMANOVA model is:yij µ τ i ij(1)with i 1 . . . g and j 1 . . . ni where:yij is a p 1 outcome vector for the j th subject from the i thtreatment.µ [µ1 , µ2 , . . . , µp ]0 is the overall population mean vector.τ i [τi1 , τi2 , . . . , τip ]0 is the i th treatment effect vector for the presponse variables. ij is the experimental error such that ij Np (0, Σ) withPgi 1 ni τ i 0.Fares Qeadan, Ph.DJuly 13,Biostatistics,20155 /&80On MANOVA(DepartmentusingofSTATA,InternalSASMedicine& R Division of Epidemiology,Pre
IntroductionMANOVAIn a matrix form, the equation in (1) could be written asYn p Xn (g 1) B(g 1) p n p(2)Pwhere n g ng , 0 y11y111 y112 y0 12 . . . . 0 y1n 1 y1n 21 y 1 1n1 Y y0 y211 y212 21 . . . . . . . . yygng 1gng 2y0gngFares Qeadan, Ph.D···.······.··· y11p. . y1n1 p y21p . . . . ygng pJuly 13,Biostatistics,20156 /&80On MANOVA(DepartmentusingofSTATA,InternalSASMedicine& R Division of Epidemiology,Pre
IntroductionMANOVAand Xn (g 1) B(g 1) p n p is 1 . . 1 1 . . 1 . . . .1 0 ···. . .1 0 ···0 1 ···. . .0 1 ···. . . . .1 0 0 ···Fares Qeadan, Ph.D 0. . 0 µ1 µ20 τ11 τ12. . τ21 τ22 .0 . . ττ. g1 g2. . 1 011 0 12 . µp . τ1p 0 1n 1 τ2p 0 21 . . . . τgp . . 0gng ·········.···July 13,Biostatistics,20157 /&80On MANOVA(DepartmentusingofSTATA,InternalSASMedicine& R Division of Epidemiology,Pre
IntroductionMANOVAAssumptions:Normality assumption: The data (or residuals) are multivariatenormally distributed for each group. So, each variable must be normaland any linear combinations of the variables must be normal (checkedby Shaprio-Wilks for univariate normality (with QQplots) andMardia’s skewness and kurtosis for multivariate normality).Fares Qeadan, Ph.DJuly 13,Biostatistics,20158 /&80On MANOVA(DepartmentusingofSTATA,InternalSASMedicine& R Division of Epidemiology,Pre
IntroductionMANOVAAssumptions:Normality assumption: The data (or residuals) are multivariatenormally distributed for each group. So, each variable must be normaland any linear combinations of the variables must be normal (checkedby Shaprio-Wilks for univariate normality (with QQplots) andMardia’s skewness and kurtosis for multivariate normality).Homogeneity assumption: The data from all groups have commonvariance-covariance matrix Σ (checked by Bartlett’s test or Box’stest).Fares Qeadan, Ph.DJuly 13,Biostatistics,20158 /&80On MANOVA(DepartmentusingofSTATA,InternalSASMedicine& R Division of Epidemiology,Pre
IntroductionMANOVAAssumptions:Normality assumption: The data (or residuals) are multivariatenormally distributed for each group. So, each variable must be normaland any linear combinations of the variables must be normal (checkedby Shaprio-Wilks for univariate normality (with QQplots) andMardia’s skewness and kurtosis for multivariate normality).Homogeneity assumption: The data from all groups have commonvariance-covariance matrix Σ (checked by Bartlett’s test or Box’stest).The DVs are continuous.Fares Qeadan, Ph.DJuly 13,Biostatistics,20158 /&80On MANOVA(DepartmentusingofSTATA,InternalSASMedicine& R Division of Epidemiology,Pre
IntroductionMANOVAAssumptions:Normality assumption: The data (or residuals) are multivariatenormally distributed for each group. So, each variable must be normaland any linear combinations of the variables must be normal (checkedby Shaprio-Wilks for univariate normality (with QQplots) andMardia’s skewness and kurtosis for multivariate normality).Homogeneity assumption: The data from all groups have commonvariance-covariance matrix Σ (checked by Bartlett’s test or Box’stest).The DVs are continuous.Linearity: There should be a linear relationships between the DVs(checked by conducting a scatterplot matrix between the DVs).Fares Qeadan, Ph.DJuly 13,Biostatistics,20158 /&80On MANOVA(DepartmentusingofSTATA,InternalSASMedicine& R Division of Epidemiology,Pre
IntroductionMANOVAAssumptions:Normality assumption: The data (or residuals) are multivariatenormally distributed for each group. So, each variable must be normaland any linear combinations of the variables must be normal (checkedby Shaprio-Wilks for univariate normality (with QQplots) andMardia’s skewness and kurtosis for multivariate normality).Homogeneity assumption: The data from all groups have commonvariance-covariance matrix Σ (checked by Bartlett’s test or Box’stest).The DVs are continuous.Linearity: There should be a linear relationships between the DVs(checked by conducting a scatterplot matrix between the DVs).Absence of multivariate outliers (checked by assessing MahalanobisDistances).Fares Qeadan, Ph.DJuly 13,Biostatistics,20158 /&80On MANOVA(DepartmentusingofSTATA,InternalSASMedicine& R Division of Epidemiology,Pre
IntroductionMANOVAHypotheses:Is there an overall treatment effect?H0 : τ 1 τ 2 · · · τ g 0Fares Qeadan, Ph.D(3)July 13,Biostatistics,20159 /&80On MANOVA(DepartmentusingofSTATA,InternalSASMedicine& R Division of Epidemiology,Pre
IntroductionMANOVAHypotheses:Is there an overall treatment effect?H0 : τ 1 τ 2 · · · τ g 0(3)Are the outcome means, regardless of the treatment groups, equal?H0 : µ1 µ2 · · · µpFares Qeadan, Ph.D(4)July 13,Biostatistics,20159 /&80On MANOVA(DepartmentusingofSTATA,InternalSASMedicine& R Division of Epidemiology,Pre
IntroductionMANOVAHypotheses:Is there an overall treatment effect?H0 : τ 1 τ 2 · · · τ g 0(3)Are the outcome means, regardless of the treatment groups, equal?H0 : µ1 µ2 · · · µp(4)Are the outcome means, for a set of the treatment groups, equal?(done by using Contrast). For example:H0 : τ 1 τ 2Fares Qeadan, Ph.D(5)July 13,Biostatistics,20159 /&80On MANOVA(DepartmentusingofSTATA,InternalSASMedicine& R Division of Epidemiology,Pre
IntroductionMANOVAHypotheses:Is there an overall treatment effect?H0 : τ 1 τ 2 · · · τ g 0(3)Are the outcome means, regardless of the treatment groups, equal?H0 : µ1 µ2 · · · µp(4)Are the outcome means, for a set of the treatment groups, equal?(done by using Contrast). For example:H0 : τ 1 τ 2(5)If applicable, Profile Analysis [Test of Parallelism, Coincidental(Separation) and Flatness (Level)] and Post hoc Analysis areconducted.Fares Qeadan, Ph.DJuly 13,Biostatistics,20159 /&80On MANOVA(DepartmentusingofSTATA,InternalSASMedicine& R Division of Epidemiology,Pre
IntroductionMANOVARemarks:If the dependent variables are not correlated, separate ANOVAs areappropriate [9].Fares Qeadan, Ph.DJuly 13, 201510 /&80On MANOVA(DepartmentusingofSTATA,InternalSASMedicine& R Division of Epidemiology,Biostatistics,Pre
IntroductionMANOVARemarks:If the dependent variables are not correlated, separate ANOVAs areappropriate [9].In most of the statistical programs used, when implementingMANOVA there are four multivariate measures: Wilks lambda, Pillai’strace, Hotelling-Lawley trace and Roys largest root. I will emphasizeWilks lambda since it demonstrates the amount of variance accountedfor in the dependent variables by the independent variables and henceit can give a ”Multivariate R-squared” calculated as:Multivariate R-squared 1 - Wilks’ Lambda.Fares Qeadan, Ph.DJuly 13, 201510 /&80On MANOVA(DepartmentusingofSTATA,InternalSASMedicine& R Division of Epidemiology,Biostatistics,Pre
IntroductionMANOVARemarks:If the dependent variables are not correlated, separate ANOVAs areappropriate [9].In most of the statistical programs used, when implementingMANOVA there are four multivariate measures: Wilks lambda, Pillai’strace, Hotelling-Lawley trace and Roys largest root. I will emphasizeWilks lambda since it demonstrates the amount of variance accountedfor in the dependent variables by the independent variables and henceit can give a ”Multivariate R-squared” calculated as:Multivariate R-squared 1 - Wilks’ Lambda.In this document we will give an example for one-way MANOVA only,however the analysis is similar in two-way MANOVA with the additionof having two independent factors instead of one and hence aninteraction term.Fares Qeadan, Ph.DJuly 13, 201510 /&80On MANOVA(DepartmentusingofSTATA,InternalSASMedicine& R Division of Epidemiology,Biostatistics,Pre
One-way MANOVA ExampleMANOVAThe Problem (Example 1.5.1 of Christensen 2001 [8]): A study wasconducted to examine the effects of two drugs on heart rates. Thirtywomen were randomly divided into three groups of ten. An injection was givento each person. Depending on their group, women received either a placebo, drugA, or drug B. Repeated measurements of their heart rates were taken beginningat two minutes after the injection and at five minute intervals thereafter. Fourmeasurements were taken on each individual1 . The data are given in Table 1.2.1The observations were taken over time on the same individual and hence correlated. Consider the heart rate measurementstaken at the four times to be four DVs. This is a completely randomized design, so a one-way MANOVA is appropriate. Thetreatments are the two drugs and the placebo (R. Christensen).Fares Qeadan, Ph.DJuly 13, 201511 /&80On MANOVA(DepartmentusingofSTATA,InternalSASMedicine& R Division of Epidemiology,Biostatistics,Pre
One-way MANOVA ExampleThe Solution using STATAThe Solution using STATA:Get the Data: (Please see the last page for a link to the data and do file)Fares Qeadan, Ph.DJuly 13, 201512 /&80On MANOVA(DepartmentusingofSTATA,InternalSASMedicine& R Division of Epidemiology,Biostatistics,Pre
One-way MANOVA ExampleThe Solution using STATAConduct the MANOVA test:This is the standard STATA output when conducting MANOVA. All four multivariatetests indicate rejection of the null hypothesis. This indicates that there are one or moredifferences among the four-dimensional mean vectors for the three groups. The standardoutput in STATA when testing MANOVA corresponds to the overall treatment effecthypothesis H0 : τ 1 τ 2 τ 3 0. This hypothesis is rejected (p 0.05). The”Multivariate R-squared” from this model is about 93.72% which is relatively strong.Fares Qeadan, Ph.DJuly 13, 201513 /&80On MANOVA(DepartmentusingofSTATA,InternalSASMedicine& R Division of Epidemiology,Biostatistics,Pre
One-way MANOVA ExampleThe Solution using STATAThe parameters’ estimates of the MANOVA model are presented in the followingtable:Fares Qeadan, Ph.DJuly 13, 201514 /&80On MANOVA(DepartmentusingofSTATA,InternalSASMedicine& R Division of Epidemiology,Biostatistics,Pre
One-way MANOVA ExampleThe Solution using STATATest the homogeneity assumption: In this assumption, we test the nullhypothesis H0 : Σ1 Σ2 Σ3 0.Firstly, we get the four residuals by conducting separate ANOVAs and then use themvtest function. The Box’s M test suggests that the data from all groups have commonvariance-covariance matrix (p 0.225 0.05) so this assumptions wasn’t violated.Fares Qeadan, Ph.DJuly 13, 201515 /&80On MANOVA(DepartmentusingofSTATA,InternalSASMedicine& R Division of Epidemiology,Biostatistics,Pre
One-way MANOVA ExampleThe Solution using STATATest the Normality assumption: In this assumption, due to the small sample sizeper treatment group, we test the null hypothesis H0 : N4 (0, Σ). If the samplesize for each drug were large, it would be appropriate to check for normality withinthe treatment groups [8].Fares Qeadan, Ph.DJuly 13, 201516 /&80On MANOVA(DepartmentusingofSTATA,InternalSASMedicine& R Division of Epidemiology,Biostatistics,Pre
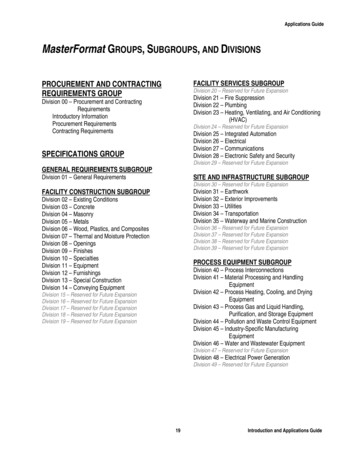
One-way MANOVA ExampleThe Solution using STATAThe three formal tests above, for univariate normality, bivariate normality and multivariatenormality, collectively indicate that the data are normally distributed. Only the bivariatenormality of res1 and res3 was questionable since p 0.0286. Nonetheless, this result shouldn’tinfluence our inference regarding the multivariate normality assumption. This assumption is notviolated and the following graphical presentations support such inference.To, graphically, assess multivariate normality, we firstly examine the bivariate scatterplots foreach pair of the residuals’ vectors hopping to observe an elliptical shape and secondly look atthe histogram of each vector of the residuals with the corresponding 0Res40-10-10010-10010This graph is sufficient to establish the linearity assumption for the DVs.Fares Qeadan, Ph.DJuly 13, 201517 /&80On MANOVA(DepartmentusingofSTATA,InternalSASMedicine& R Division of Epidemiology,Biostatistics,Pre
One-way MANOVA Example. histogram res1, normalThe Solution using STATAname(res1h, replace) nodraw. qnorm res1, name(res1q, replace) nodraw. histogram res2, normal name(res2h, replace) nodraw. qnorm res2, name(res2q, replace) nodraw. histogram res3, normalname(res3h, replace) nodraw. qnorm res3, name(res3q, replace) nodraw. histogram res4, normal name(res4h, replace) nodraw. qnorm res4, name(res4q, replace) nodraw10510-50Inverse Normal510-10-50Inverse Normal510-10-50Inverse Normal510-10-50Inverse Normal5100 5Res25101051005Res4100 5Res40.05-5-10-5.1100Res30 sity-10Fares Qeadan, Ph.D0 .08.10Density. gr combine res1h res1q res2h res2q res3h res3q res4h res4q, cols(2)July 13, 201518 /&80On MANOVA(DepartmentusingofSTATA,InternalSASMedicine& R Division of Epidemiology,Biostatistics,Pre
One-way MANOVA ExampleThe Solution using STATATo conduct in STATA a test for univariate normality which is similar to that in SAS or R, we usethe swilk command which implements the Shapiro-Wilk test.Note that:The normality assumption can be relaxed by appealing to the central limit theorem whenthe sample sizes ni are large [10].Theoretically, we should examine the normality for every linear combination of theresiduals. This can be time consuming so evaluating some finite number of the linearcombinations is sufficient [8].To further examine the multivariate normality through graphical tools, one could also plot3 dimensional scatterplots and look for elliptical shapes. This is a great tool to detectoutliers.Fares Qeadan, Ph.DJuly 13, 201519 /&80On MANOVA(DepartmentusingofSTATA,InternalSASMedicine& R Division of Epidemiology,Biostatistics,Pre
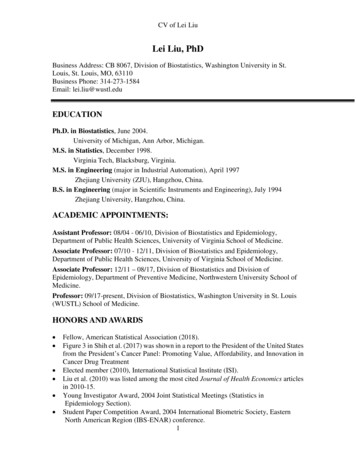
One-way MANOVA ExampleThe Solution using STATATest the assumption of Absence of Multivariate Outliers:To examine multivariate outliers in the data, we use the QQPlot for the observed Mahalanobisdistances (MD). We plot the ordered Mahalanobis distances versus estimated quantiles from achi-squared distribution with p degrees of freedom and expect to see a straight-line.15chi2Chi-Square105005Mahanalobis Distance10Plot Check for Multivariate NormalityTo conduct a formal test, we compute the 97.5% quantile Q of the Chi-Square distribution withp degrees of freedom using the invchi2 command and declare each point with MD which isgreater than Q as a multivariate outlier.Fares Qeadan, Ph.DJuly 13, 201520 /&80On MANOVA(DepartmentusingofSTATA,InternalSASMedicine& R Division of Epidemiology,Biostatistics,Pre
One-way MANOVA ExampleThe Solution using STATAThe observed Mahalanobis distances of our data are presented below. Based on this data wehave no multivariate outliers as none of the observations has a MD which is larger than 11.14,the 97.5% quantile of the Chi-Square distribution with 4 degrees of freedom.Note: This test is generally used to establish multivariate normality, however; we use it in hereto only detect multivariate outliers.Fares Qeadan, Ph.DJuly 13, 201521 /&80On MANOVA(DepartmentusingofSTATA,InternalSASMedicine& R Division of Epidemiology,Biostatistics,Pre
One-way MANOVA ExampleThe Solution using STATATest for an overall treatment effect: The null hypothesis H0 : τ 1 τ 2 τ 3 0 isrejected which indicates an existence of treatment effect. That is, at the 5% significancelevel, we can infer that at least one of the three treatments (Drug A, Drug B or Placebo)has a significant impact on women’s heart rate.Note that this output is the same as the default output we get from STATA when conducting aMANOVA (see page 13)].Fares Qeadan, Ph.DJuly 13, 201522 /&80On MANOVA(DepartmentusingofSTATA,InternalSASMedicine& R Division of Epidemiology,Biostatistics,Pre
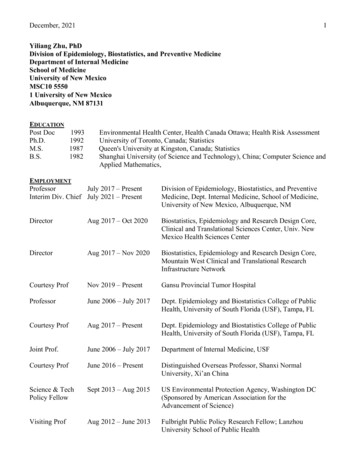
One-way MANOVA ExampleThe Solution using STATATest whether the four heart rate means are equal: The null hypothesisH0 : µ1 µ2 µ3 µ4 is rejected (see STATA’s output and Box-plot Figure below)which indicates, at the 5% significance level, that women’s means heart rate at the fourtimes are significantly different.Fares Qeadan, Ph.DJuly 13, 201523 /&80On MANOVA(DepartmentusingofSTATA,InternalSASMedicine& R Division of Epidemiology,Biostatistics,Pre
Fares Qeadan, Ph.DOne-way MANOVA ExampleThe Solution using STATA80757065Heart Rate8590Women's Heart Rate Distribution at Four Different Timestime1time3time2time4July 13, 201524 /&80On MANOVA(DepartmentusingofSTATA,InternalSASMedicine& R Division of Epidemiology,Biostatistics,Pre
One-way MANOVA ExampleThe Solution using STATATest whether the four heart rate means, for Drug A and Placebo, are equal: The nullhypothesis H0 : τ 1 τ 3 is rejected (see STATA’s output below). That is, at the 5%significance level, we can infer that the impact of Drug A on women’s heart rate issignificantly different than that of the Placebo.Fares Qeadan, Ph.DJuly 13, 201525 /&80On MANOVA(DepartmentusingofSTATA,InternalSASMedicine& R Division of Epidemiology,Biostatistics,Pre
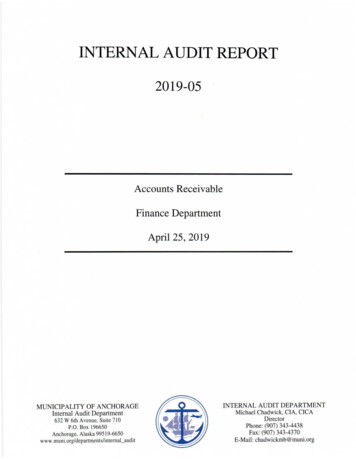
One-way MANOVA ExampleThe Solution using STATAProfile Analysis: When comparing the same dependent variable between groups over severaltime points then profile analysis is invoked. In this analysis, one examines three diffrenthypotheses.Whether the curves are parallel (Parallelism)?Whether the curves have the same average level (Separation or Coincidental profiles)?Whether the average curve is horizontal (Flatness)?7075Mean8085Heart Rate Profilestime1time2VariablesDrug APlacebotime3time4Drug BmeanWe observe from the profiles plot above that Drug B is different from both Drug A and Placebo.In fact, its profile falls in between the profiles of Drug A and Placebo that both seem to besimilar in their behavior over time.Fares Qeadan, Ph.DJuly 13, 201526 /&80On MANOVA(DepartmentusingofSTATA,InternalSASMedicine& R Division of Epidemiology,Biostatistics,Pre
One-way MANOVA ExampleThe Solution using STATATest for Parallelism: The null hypothesis tests if the two drugs and placebo have parallel profiles.The previous graph of heart rate profiles clearly indicates that the parallelism hypothesis shouldbe rejected. From the above output, we see that this hypothesis is rejected based on the fourmultivariate test and hence we can infer that the changes in women’s heart rate are significantlyNOT the same direction and pattern for the two drugs and placebo.Fares Qeadan, Ph.DJuly 13, 201527 /&80On MANOVA(DepartmentusingofSTATA,InternalSASMedicine& R Division of Epidemiology,Biostatistics,Pre
One-way MANOVA ExampleThe Solution using STATATest for Separation (Coincidental): The null hypothesis tests if the curves have the sameaverage level. This hypothesis is meaningless in this situation since the parallelism hypothesiswas rejected. Nonetheless, for demonstration purposes I will provide the STATA code/output.Here is a fake example [11] in which coincidental profiles is occuring:Fares Qeadan, Ph.DJuly 13, 201528 /&80On MANOVA(DepartmentusingofSTATA,InternalSASMedicine& R Division of Epidemiology,Biostatistics,Pre
One-way MANOVA ExampleThe Solution using STATATest for Flatness: The null hypothesis tests if the the average curve is horizontal. This is thesame as testing whether the four heart rate means are equal (see page 23). For completeness, Iam providing he STATA code and output again.Note: STATA 10 or less reserves the first column of the H (test) matrix for the constant’scolumn while STATA 11 or more reserves the last column for the same purpose. So, if you wereusing STATA 14 then your H matrix would be H (1/3, 1/3, 1/3, 1) and if you were usingSATA 9 then it would be H (1, 1/3, 1/3, 1/3).Fares Qeadan, Ph.DJuly 13, 201529 /&80On MANOVA(DepartmentusingofSTATA,InternalSASMedicine& R Division of Epidemiology,Biostatistics,Pre
One-way MANOVA ExampleThe Solution using STATAPost Hoc Analysis: Several methods are generally conducted after a MANOVA model including:Simultaneous confidence intervals, Multivariate contrasts, Multiple Univariate ANOVAs,Discriminant Analysis and others. For our example, I will provide the results of the LinearDiscriminant Analysis (LDA) to illustrate the classification accuracy of our model.Fares Qeadan, Ph.DJuly 13, 201530 /&80On MANOVA(DepartmentusingofSTATA,InternalSASMedicine& R Division of Epidemiology,Biostatistics,Pre
One-way MANOVA ExampleThe Solution using STATAIn our model, we have only one misclassification for a Placebo into Drug A. This could be alsoeasily seen from the following score plot.discriminant score 2024Discriminant function scoresPlaceboPlaceboDrug BDrug BDrug BDrug BDrug BPlaceboDrug APlaceboDrug ADrug BDrug B-2Drug BDrug g B0discriminant score 1Drug ADrug ADrug ADrug A2Drug ADrug ADrug ADrug A4This clear linear
Division of Epidemiology, Biostatistics, & Preventive Medicine University of New Mexico Health Sciences Center July 13, 2015 Fares Qeadan, Ph.D (Department of Internal Medicine Division of Epidemiology, Biostatistics, & Preventive MedicineUniversity of New Mexico Health Sciences Cente