Transcription
Operational Amplifiers & Linear Integrated Circuits:Theory and ApplicationLaboratory Manual/3EJames M. Fiore
2Laboratory Manual for Operational Amplifiers & LIC
Operational Amplifiers & Linear Integrated Circuits:Theory and ApplicationLaboratory ManualbyJames M. FioreVersion 3.1.3, 18 April 2020Laboratory Manual for Operational Amplifiers & LIC3
This Laboratory Manual for Operational Amplifiers & Linear Integrated Circuits: Theory andApplication, Third Edition is copyrighted under the terms of a Creative Commons license:This work is freely redistributable for non-commercial use, share-alike with attributionPublished by James M. Fiore via dissidentsISBN13: 978-1796855623For more information or feedback, contact:James Fiore, ProfessorElectrical Engineering TechnologyMohawk Valley Community College1101 Sherman DriveUtica, NY 13501jfiore@mvcc.eduFor the latest revisions, related titles, and links to low cost print versions, go to:www.mvcc.edu/jfiore or my mirror sites www.dissidents.com and www.jimfiore.orgYouTube Channel: Electronics with Professor FioreCover art, Canadian Shield II, by the author4Laboratory Manual for Operational Amplifiers & LIC
IntroductionThis manual is the companion to the OER (Open Educational Resource) Operational Amplifiers & LinearIntegrated Circuits/3E text. It is intended for use in an operational amplifiers course and is appropriate foreither a two or four year electrical engineering technology curriculum. The manual contains sufficientexercises for a typical 15 week course using a two to three hour practicum period. The topics cover basicdifferential amplifiers through active filters. For equipment, each lab station should include a dualadjustable DC power supply, a dual trace oscilloscope, a function generator and a quality DMM. Someexercises also make use of a distortion analyzer and a low distortion generator (generally, THD below0.01%), although these portions may be bypassed. For components, a selection of standard value ¼ wattcarbon film resistors ranging from a few ohms to a few mega ohms is required along with an array oftypical capacitor values (film types recommended below 1 µF and aluminum electrolytics above). A 100ohm 5 watt power resistor is needed for the Linear Regulator exercise. A 10k Ω potentiometer will also beuseful for the DC Offset exercise. Active devices include small signal diodes such as the 1N914 or1N4148, the NZX5V1B and NZX3V3B Zeners (or 1N751/1N5231 and 1N5226 in a pinch), small signalNPNs such as the 2N3904 or 2N2222, a medium power NPN transistor such as the 2N5192G, and avariety of inexpensive op amps such as the 741, LF351 or TL081, LF411 and LM318. Most circuits usestandard / 15 VDC power supplies. All DC supplies should be bypassed with 1 µF capacitors positionedas close to the IC and ground as possible. The DC supplies are not drawn in detail on the schematics inorder to reduce visual clutter, although the bypass capacitors are included in the parts lists as a reminder.Each exercise begins with an Objective and a Theory Overview. The Equipment List follows with spaceprovided for model and serial numbers, and measured values of components. Schematics are presentednext along with the step-by-step procedure. Many exercises include sections on troubleshooting and/ordesign. Computer simulations are often presented as well, and almost any quality simulation packagesuch as Multisim, PSpice, LTspice or TINA-TI can be used. All data tables are grouped together,typically with columns for the theoretical and experimental results, along with a column for the percentdeviations between them. Finally, a group of appropriate questions are presented.Other laboratory manuals in this series include DC and AC Electrical Circuits, Semiconductor Devices(diodes, bipolar transistors and FETs), Computer Programming with Python and Multisim , andEmbedded Controllers Using C and Arduino. Texts are also available for Embedded Controllers as wellas Semiconductor Devices. Workbooks are available for DC and AC Electrical Circuits. All of these titlesare Open Educational Resources using a Creative Commons non-commercial share-alike with attributionlicense. The latest versions may be found at my MVCC site: www.mvcc.edu/jfiore and at my mirror site:www.dissidents.comLaboratory Manual for Operational Amplifiers & LIC5
A Note from the AuthorThis manual was created to accompany the text Operational Amplifiers & Linear Integrated Circuits:Theory and Application. It is used at Mohawk Valley Community College in Utica, NY, for our ABETaccredited AAS program in Electrical Engineering Technology. I am indebted to my students, co-workersand the MVCC family for their support and encouragement of this project. The text and this manual werepublished originally via the traditional route. When the opportunity arose, as a long-time supporter andcontributor to the Open Educational Resource movement, I decided to re-release these titles using aCreative Commons non-commercial, share-alike license. I encourage others to make use of this manualfor their own work and to build upon it. If you do add to this effort, I would appreciate a notification.“We need not stride resolutely towards catastrophe, merely because those are the marching orders.”- Noam Chomsky6Laboratory Manual for Operational Amplifiers & LIC
Table of ContentsDecibels and Bode Plots.8The Differential Amplifier.14The Op Amp Comparator .22The Non-inverting Voltage Amplifier.28The Inverting Voltage Amplifier.34The Op Amp Differential Amplifier .38Parallel-Series and Series-Series Negative Feedback.44Gain-Bandwidth Product.50Slew Rate and Power Bandwidth .56The Non-compensated Op Amp .60DC Offset.64The Operational Transconductance Amplfier.70Precision Rectifiers .74Function Generation.80The Linear Regulator.86The Triangle-Square Generator.90The Wien Bridge Oscillator .94The Integrator.98The Differentiator.102VCVS Filters .106The Multiple Feedback Filter.114The State-Variable Filter.120Appendix A: Creating Graphs Using a Spreadsheet.128Appendix B: Manufacturer’s Datasheet Links.130.Laboratory Manual for Operational Amplifiers & LIC.7
Decibels and Bode PlotsObjectiveIn this exercise, the usage of decibel measurements and Bode plots will be examined. The investigationwill include the relationship between ordinary and decibel gain, and the decibel-amplitude and phaseresponse of a simple lag network.Theory OverviewThe decibel is a logarithmic-based measurement scheme. It is based on ratios of change. Positive valuesindicate an increase while negative values indicate a decrease. Decibel schemes can be used for gains and,with minor modification, signal levels. A Bode plot shows the variations of gain (typically expressed indecibels) and phase across a range of frequencies for some particular circuit. These will prove to be veryvaluable in later design and analysis work.ReferenceFiore, Op Amps and Linear Integrated CircuitsSection 1.2, The DecibelSection 1.3, Bode PlotsEquipment(1) Oscilloscope(1) Function generator(1) Decibel-reading voltmeter(1) DMMmodel: srn:model: srn:model: srn:model: srn:Components(1) 100n Factual:(1) 100 actual:(1) 1k actual:(1) 4k7 actual:(2) 10k actual:(1) 22k actual:8Laboratory Manual for Operational Amplifiers & LIC
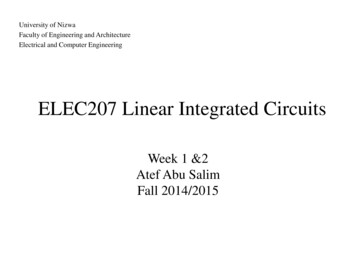
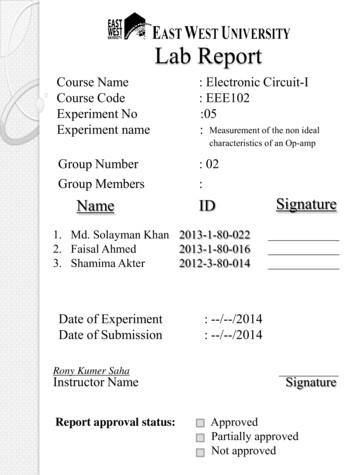
SchematicsFigure 1Figure 2Laboratory Manual for Operational Amplifiers & LIC9
Procedure1. Calculate the voltage gains (losses) for the voltage divider of Figure 1 for the resistor valuesspecified, and record them in Table 1. Also, convert each of the ordinary gains into decibel form.2. Assemble the circuit of Figure 1 using the 22k resistor.3. Set the generator to a 100 Hz sine wave, 0 dBV (Note: If the meter is calibrated in dBu, then use 0dBu).4. Apply the generator to the circuit. Measure and record the output voltage in Table 1 using the decibelreading voltmeter. Also, compute the resulting experimental decibel voltage gain and gain deviation.5. Repeat step 4 for the remaining resistor values in Table 1.6. To create a simple Bode plot, the lag network of Figure 2 will be used. Assemble this circuit andrecord its theoretical critical frequency in Table 2.7. Set the generator to a 1 kHz sine wave, 0 dBV.8. Apply the generator to the circuit. Determine the experimental critical frequency by adjusting thefrequency of the generator until the circuit’s output voltage is –3 dBV. Record the measuredfrequency in Table 2.9. Set the generator to a sine wave at one-tenth of the experimental critical frequency.10. Adjust the generator’s output level to 0 dBV.11. Apply the generator to the circuit. Measure and record the output level in decibels in Table 3. Also,measure and record the phase angle between the input and output waveforms and record it in Table 3.12. Repeat steps 9 through 11 for the remaining frequencies listed in Table 3.13. Using the values from Table 3, create a Bode plot for this circuit using a log scaled horizontal axis(i.e., semi-log paper).10Laboratory Manual for Operational Amplifiers & LIC
Computer Simulation14. Build the lag network of Figure 2 in a simulator and run an AC Analysis. Be sure to run this from atleast one decade below the critical frequency to at least one decade above. Also, use a decibel scalefor the gain amplitude. Compare the results to the Bode plot generated in Step 13 and include thisgraph with the technical report.Data TablesRAv TheoryAv’ TheoryVout’Experimental Av’% Deviation22k 10k 4k7 1k 100 Table 1Theoretical fcExperimental fcTable 2Laboratory Manual for Operational Amplifiers & LIC11
FactorFrequencyA v’Phase.1 fc.2 fc.5 fcfc2 fc5 fc10 fcTable 3Questions1. Is the logarithmic nature of the decibel apparent in the data of Table 1?2.Using the plot created in step 13, determine the slope in dB-per-octave in the region above fc.3.What would the plot of step 13 look like if ordinary gains had been used instead of decibel gains?12Laboratory Manual for Operational Amplifiers & LIC
Laboratory Manual for Operational Amplifiers & LIC13
The Differential AmplifierObjectiveIn this exercise, the performance of a differential amplifier will be examined. The investigation willinclude the DC parameters of input bias and offset current, and output offset voltage. The AC parametersof interest are the differential and common-mode gains, and the resulting common-mode rejection-ratio(CMRR).Theory OverviewThe ideal differential amplifier is perfectly symmetrical producing identical DC input bias currents andoutput collector voltages. Several factors ranging from the mismatch of transistor parameters to resistortolerances prevent perfect symmetry in a practical circuit. The DC quality of the circuit can be expressedin terms of the mismatches. The difference between the input bias currents is known as the input offsetcurrent. The difference between the output collector voltages is known as the output offset voltage. ForAC performance, the primary items of concern are the differential and common-mode gains. The idealdifferential amplifier will only amplify differential input signals, and thus, has a common-mode gain ofzero. Due to component mismatches and internal design limits, the common-mode gain is never zero,allowing some portion of the common-mode input signal to make its way to the output. The measure ofthe suppression of common-mode signals is given by the common-mode rejection-ratio, or CMRR. CMRRcan be found by dividing the differential gain by the common-mode gain.ReferenceFiore, Op Amps and Linear Integrated CircuitsSection 1.6, The Differential AmplifierEquipment(1) Oscilloscope(1) Function generator(1) Dual DC power supply(1) DMM14model: srn:model: srn:model: srn:model: srn:Laboratory Manual for Operational Amplifiers & LIC
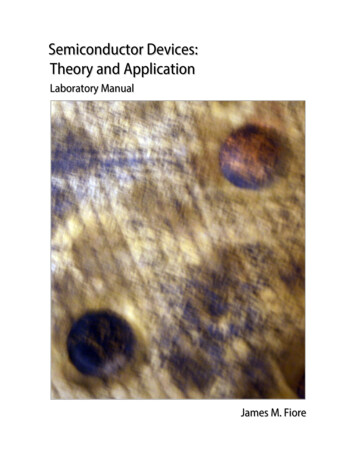
Components(3) Small signal NPN transistors (2N3904, 2N2222, etc.)(2) 100 actual:(2) 330 actual:(2) 470 actual:(1) 3k3 actual:(2) 4k7 actual:(1) 5k6 actual:(1) 10k actual:(2) 22k actual:(1) 33k actual:2N3904 Datasheet: SchematicsFigure 1Laboratory Manual for Operational Amplifiers & LIC15
Figure 2Figure 316Laboratory Manual for Operational Amplifiers & LIC
ProcedureDC Parameters1. Assume that the transistors of Figure 1 have a current gain of 150. Calculate the base currents andcollector voltages for the amplifier of Figure 1 and record them in Table 1. Also, compute and recordthe theoretical (ideal) input offset current and output offset voltage.2. Assemble the circuit of Figure 1.3. Measure and record the base currents in Table 1. (Note: You may wish to measure the voltage acrossthe base resistors and compute the base currents if the DMM cannot measure small DC currents.)Based on these currents, compute and record the experimental input bias and offset currents alongwith the corresponding deviations.4. Measure and record the collector voltages in Table 1. Based on these voltages, compute and recordthe experimental output offset voltage and the corresponding deviation.AC Parameters5. Calculate the differential voltage gain and collector voltages for the amplifier of Figure 2 using aninput of 20 millivolts, and record them in Table 2.6. Assemble the circuit of Figure 2.7. Set the generator to a 1 kHz sine wave, 20 millivolts peak.8.Apply the generator to the amplifier. Measure and record the AC collector voltages in Table 2 whilenoting the phase relative to the input. Also, compute the resulting experimental voltage gain from theinput to collector one, and the deviations.9. Apply the generator to both inputs. Set the generator’s output to 1 volt peak.10. Measure the AC voltage at collector one and record it in Table 3.11. Based on the value measured in step 10, compute and record the common-mode gain and CMRR inTable 3.Improved CMRR12. Assemble the circuit of Figure 3. This circuit uses an improved tail current source that exhibits muchhigher internal impedance than the circuit of Figure 2. This should yield a decrease in common modegain which, in turn, should yield an improved CMRR. Note that the new circuit sets up virtually theLaboratory Manual for Operational Amplifiers & LIC17
same tail current, therefore producing approximately the same DC parameters and differential gain asthe original.13. Repeat steps 9 through 11 recording the results in Table 4.Troubleshooting14. Continuing with the amplifier of Figure 3, turn the signal down to 0. Estimate and then measure theresults for each individual error presented in Table 5.Computer Simulation15. Build the amplifier of Figure 2 in a simulator and run a Transient Analysis echoing steps 5 through 8.Compare the results to the data found in Table 2.Data TablesDC QuantityTheoreticalExperimental% Table 118Laboratory Manual for Operational Amplifiers & LIC
AC QuantityTheoreticalExperimental% DeviationVC1VC2AvTable 2VC1AcmCMRRTable 3VC1AcmCMRRTable 4Laboratory Manual for Operational Amplifiers & LIC19
Error3k3 is replacedwith 33kQuantityEstimateActualVC1 DCQ1’s 4k7 is 470VC1 DCBoth 4k7 are 470VC1 DCTable 5Questions1. How might the input offset current of Figure 1 be reduced?2. What are some causes of output offset voltage in the circuit of Figure 1?3. What are the effects if the two collector resistors not identical in value?4. What is the significance of a high CMRR?5. How significant is the change in CMRR when using the improved current source? Based on theimprovement, estimate the internal impedance of the current source.20Laboratory Manual for Operational Amplifiers & LIC
Laboratory Manual for Operational Amplifiers & LIC21
The Op Amp ComparatorObjectiveIn this exercise, the performance of a typical op amp will be examined in the open-loop mode. Thiscircuit is often referred to as a comparator. The investigation will include the effect of both DC and ACinput signals.Theory OverviewThe open-loop voltage gain of the typical op amp is very high, approaching 100,000 at low frequencies.With such a high gain, even minute differences between the inverting and non-inverting input signals willbe magnified to the point of causing saturation. Thus, if the non-inverting input signal exceeds theinverting input signal, the output will be at positive saturation. If the signals are reversed, then negativesaturation results. If both inputs are identical, then the output will go to either positive or negativesaturation, depending on the internal offsets of the op amp.ReferenceFiore, Op Amps and Linear Integrated CircuitsSection 2.2, What Is An Op Amp?Equipment(1) Oscilloscope(1) Function generator(1) Dual DC power supply(1) DMM22model: srn:model: srn:model: srn:model: srn:Laboratory Manual for Operational Amplifiers & LIC
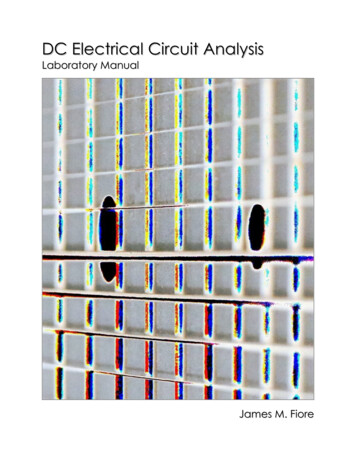
Components(1) General purpose op amp (741, 351, 411, 081, etc.)(2) 1µ Factual:(1) 2k2 actual:(1) 4k7 actual:(2) 10k actual:(1) 15k actual:(1) 22k actual:LM741 Datasheet: http://www.ti.com/lit/ds/symlink/lm741.pdfLF351 Datasheet: LF411 Datasheet: http://www.ti.com/lit/ds/symlink/lf411.pdfTL081 Datasheet: cFigure 1Laboratory Manual for Operational Amplifiers & LIC23
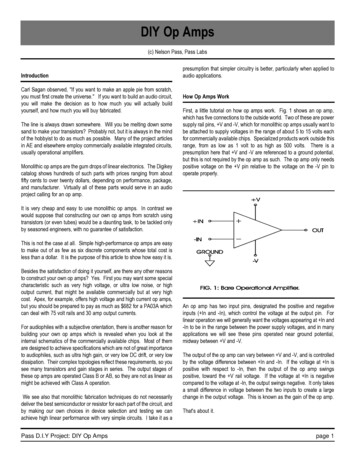
Procedure1. Calculate the voltages at points A, B, and C, and record them in Table 1.2. Assemble the circuit of Figure 1.3.Using the input combinations listed in Table 2, apply the appropriate signals to V1 and V2. Measurethe output signal using the oscilloscope, and record the values in Table 2.4.Connect V1 to a 10 volt peak-to-peak 1 kHz sine wave. Make sure the oscilloscope inputs are set toDC Coupling, and then connect probe 1 to V1, probe 2 to V2 and probe 3 to Vout.5.Connect V2 to point A. Measure the output voltage and save a copy of the oscilloscope display asGraph 1.6.Connect V2 to point B. Measure the output voltage and save a copy of the oscilloscope display asGraph 2.7.Connect V2 to point C. Measure the output voltage and save a copy of the oscilloscope display asGraph 3.Computer Simulation8.Build the circuit of Figure 1 in a simulator and run a Transient Analysis echoing steps 4 through 7.Compare the results to the waveforms generated experimentally.Data TablesConnection NodeVoltageABCTable 124Laboratory Manual for Operational Amplifiers & LIC
V1V2AAABACBABBBCCACBCCVoutTable 2Questions1.What happens when V1 V2? Why?2.What happens when V1 V2? Why?Laboratory Manual for Operational Amplifiers & LIC25
3.What happens when V1 V2? Why?4. Explain the differences in the waveforms recorded in Graphs 1 through 3.5. How would the waveform displays be altered if the oscilloscope inputs were set to AC Couplinginstead of DC Coupling in step 4?6. How would the results of this exercise change if the op amp had a very low gain, say only 1 or 2?26Laboratory Manual for Operational Amplifiers & LIC
Laboratory Manual for Operational Amplifiers & LIC27
The Non-inverting Voltage AmplifierObjectiveIn this exercise, the performance of the non-inverting voltage amplifier will be examined. Theinvestigation will include the effect of feedback resistors on setting voltage gain, stability of gain withdiffering op amps, and input impedance.Theory OverviewThe non-inverting voltage amplifier is based on series-parallel negative feedback. As the ideal voltagecontrolled voltage source, this amplifier exhibits high input impedance, low output impedance, and stablevoltage gain. The voltage gain is set by the two feedback resistors, R i and Rf.ReferenceFiore, Op Amps and Linear Integrated CircuitsSection 3.4, The Four Variants of Negative FeedbackSection 4.2, Inverting and Non-inverting AmplifiersEquipment(1) Oscilloscope(1) Function generator(1) Dual DC power supply(1) DMMmodel: srn:model: srn:model: srn:model: srn:For Distortion Measurement Only(1) Low distortion sine source(1) Distortion analyzermodel: srn:model: srn:Components(3) General purpose op amps (1 each of 741, 351, 318, 411, 081, etc.)(2) 1µ Factual:(1) 1k actual:(1) 4k7 actual:(1) 10k actual:(1) 22k actual:28Laboratory Manual for Operational Amplifiers & LIC
(1) 33k actual:(1) 47k actual:(1) 100k actual:LM741 Datasheet: http://www.ti.com/lit/ds/symlink/lm741.pdfLF351 Datasheet: LF411 Datasheet: http://www.ti.com/lit/ds/symlink/lf411.pdfLM318 Datasheet: http://www.ti.com/lit/ds/symlink/lm318-n.pdfTL081 Datasheet: csFigure 1Figure 2Laboratory Manual for Operational Amplifiers & LIC29
Procedure1.The voltage gain of the non-inverting amplifier can be determined accurately from the feedbackresistors Ri and Rf. Calculate the voltage gains for the amplifier of Figure 1 for the Rf valuesspecified, and record them in Table 1.2.Assemble the circuit of Figure 1 using the 4k7 resistor.3. Set the generator to a 1 kHz sine wave, 100 millivolts peak.4. Apply the generator to the amplifier. Measure and record the output voltage in Table 1. Also,compute the resulting experimental voltage gain and gain deviation.5.Repeat step 4 for the remaining Rf values in Table 1.6.For any given Ri, Rf combination, the voltage gain should be stable regardless of the precise op ampused, even if it is of an entirely different model. To verify this, first set R f to 22k .7. Set the generator to a 1 kHz sine wave, 100 millivolts peak.8. Apply the generator to the amplifier. Measure and record the output voltage in Table 2. Also,compute the resulting experimental voltage gain and gain deviation.9. Repeat step 8 for two other op amps.10. It is not practical to use an ohmmeter to determine the input impedance of an active circuit. Instead,input impedance can be found by utilizing the voltage divider effect. Modify the circuit by adding theextra input resistor as shown in Figure 2.11. Set Rf to 4k7 .12. Set the generator to a 200 Hz sine wave, 1 volt peak.13. Apply the generator to the amplifier. Use a DMM to measure and record the AC potential from Vin topoint X (i.e.,VA, the voltage across the 100k) in Table 3. Using KVL, determine the voltage frompoint X to ground (VB) and record in Table 3 (don’t forget to compensate for peak versus RMSreadings). Finally, compute the resulting input impedance by using the voltage divider rule. Note: Ifthe DMM is not sensitive enough and registers 0 volts for V A, it is safe to assume that Zin isconsiderably larger than the 100k sensing resistor.30Laboratory Manual for Operational Amplifiers & LIC
Distortion Measurement14. Return to the amplifier of Figure 1 with Rf set to 10k . If available, the LF351 is a good choice forthe op amp in this portion. Replace the general purpose generator with the low distortion sine sourceset to 1 kHz. Adjust its output level so that the output of the op amp is approximately 0 dBV.15. Apply the distortion analyzer to the output of the op amp, read the resulting THD percentage andrecord it in Table 4.16. Repeat steps 14 and 15 using the remaining Rf values in Table 4.Troubleshooting17. Continuing with the amplifier of Figure 1, reset Rf to 4k7 . Estimate and then measure the resultsfor each individual error presented in Table 5.Data TablesRfTheoretical AvVoutExperimental Av% Deviation4k7 10k 22k 33k 47k Table 1Laboratory Manual for Operational Amplifiers & LIC31
Op AmpTheoretical AvVoutExperimental Av% Deviation123Table 2VAVBZinTable 3Rf% THD10k 22k 47k Table 432Laboratory Manual for Operational Amplifiers & LIC
ErrorQuantityRi’s third band isorangeVoutfin is 100 HzVoutRi is swappedwith RfVout and – signalinput pinsswappedVoutEstimateActualTable 5Questions1.What is the effect as Rf is increased?2. How does the voltage gain vary as the op amp is changed?3. Does the non-inverting voltage amplifier exhibit a predictable and stable voltage gain?4. What can be said about the input impedance of this type of amplifier?5. What is the relationship between gain, feedback and distortion?Laboratory Manual for Operational Amplifiers & LIC33
The Inverting Voltage AmplifierObjectiveIn this exercise, the performance of the inverting voltage amplifier will be examined. The investigationwill include the effect of feedback resistors on setting voltage gain, stability of gain with differing opamps, and the concept of virtual ground.Theory OverviewThe inverting voltage amplifier is based on parallel-parallel negative feedback. This amplifier exhibitsmodest input impedance, low output impedance, and stable inverting voltage gain. The voltage gain is setby the two feedback resistors, Ri and Rf.ReferenceFiore, Op Amps and Linear Integrated CircuitsSection 4.2, Inverting and Non-inverting AmplifiersEquipment(1) Oscilloscope(1) Function generator(1) Dual DC power supply(1) DMMmodel: srn:model: srn:model: srn:model: srn:Components(3) General purpose op amps (1 each of 741, 351, 318, 411, 081, etc.)(2) 1µ Factual:(1) 1k actual:(1) 4k7 actual:(1) 10k actual:(1) 22k actual:(1) 33k actual:(1) 47k actual:34Laboratory Manual for Operational Amplifiers & LIC
SchematicFigure 1Procedure1.The voltage gain of the inverting amplifier can be determined accurately from the feedback resistorsRi and Rf. Calculate the voltage gains for the amplifier of Figure 1 for the Rf values specified, andrecord them in Table 1.2.Assemble the circuit of Figure 1 using the 4k7 resistor.3. Set the generator to a 1 kHz sine wave, 100 millivolts peak.4. Apply the generator to the amplifier. Measure and record the output voltage in Table 1, noting itsphase relative to the input. Also, compute the resulting experimental voltage gain and gain deviation.5.Repeat step 4 for the remaining Rf values in Table 1.6.For any given Ri, Rf combination, the voltage gain should be stable regardless of the precise op ampused, even if it is of an entirely different model. To verify this, first set R f to 22k .7. Set the generator to a 1 kHz sine wave, 100 millivolts peak.8. Apply the generator to the amplifier. Measure and record the output voltage in Table 2. Also,compute the resulting experimental voltage gain and gain deviation.9. Repeat step 8 for two other op amps.Laboratory Manual for Operational Amplifiers & LIC35
10. The concept of virtual ground is very important. A virtual ground exists at the inverting input of theop amp in this circuit. Ideally, the voltage at this point should be very close to 0. Through voltagedivider effect, this implies that all of the input signal must be dropping across R i, and thus Ri mustestablish the input impedance of the amplifier.11. Set Rf to 4k7 .12. Set the generator to a 200 Hz sine wave, 1 volt peak.13. Apply the generator to the amplifier. Use a DMM to measure and record the AC potential at theinverting terminal of the op amp. Record the value in Table 3.Computer Simulation14. Build the circuit in a simulator and run a Transient Analysis echoing steps 2 through 5. Compare theresults to the waveforms generated experimentally.15. Repeat step 14 but this time use the Distortion Analyzer instrument to compare voltage gain to THD.Data TablesRfAv TheoryVoutPhaseExperimental Av% Deviation4k7 10k 22k 33k 47k Table 136Laboratory Manual for Operational Amplifiers & LIC
Op AmpAv TheoryVoutExperimental Av% Deviation123Table 2Vinverting-inputTable 3Questions1.What is the effect as Rf is increased?2. How does the voltage gain vary as the op amp is changed?3. Does the inverting voltage amplifier exhibit a predictable and stable voltage gain?4. What can be said about the input impedance of this type of amplifier?5.Based on the simulation, what is the relationship between gain, feedback and distortion for this circuit?Laboratory Manual for Operational Amplifiers & LIC37
The Op Amp Differential AmplifierObjectiveIn this exercise, the performance of an op amp based differential amplifier will be examined. Theinvestigation will include the effects of differential gain and common-mode rejection ratio (CMRR).Theory OverviewAn op amp differential amplifier can be created by combining both a non-inverting voltage amplifier andan inverting voltage amplifier in a single stage. Proper gain matching between the two paths is essential tomaximize the common-mode rejection ratio. Differential gain is equal to the gain of the inverting path.ReferenceFiore, Op Amps and Linear Integrated CircuitsSection 4.2, Inverting and Non-inverting AmplifiersEquipment(1) Oscilloscope(1) Function generator(1) Dual DC power supply(1) DMMmodel: srn:model: srn:model: srn:model: srn:Components(2) General purpose op amps (741, 351, etc.)(2) 1 µFactual:(2) 10 k actual:(1) 15 k actual:(1) 22 k actual:(2) 100 k actual:(1) 10 k potentiometer38Laboratory Manual for Operational Amplifiers & LIC
SchematicsFigure 1Figure 2Laboratory Manual for Operational Amplifiers & LIC39
Procedure1. This circuit can be examined through the use of the Superposition Theorem. The contribution of eachinput can be measured individually, combined, and then compared with common-mode anddifferential inputs.2. Calculate the differential voltage gain for the amplifier and record it in Table 13.Assemble the circuit of Figure 6.1. Try to get the Ri/Rf ratio as close as possible to the Ri’/Rf’ ratio,even if you have to mix and match several resistors.4. Set the generator to a 1 kHz sine wave, 500 millivolts peak.5.Apply the generator to the Vinv input, and ground the Vnon input.6. Measure and record the output voltage in Table 2, noting the phase
A Note from the Author This manual was created to accompany the text Operational Amplifiers & Linear Integrated Circuits: Theory and Application.It is used at Mohawk Valley Community College in Utica, NY, for our ABET accredited AAS program in Electrical Engineering Technology. I am indebted to my students, co-workers