Transcription
TECHNICAL ANALYSISJAMES SMITHSONRediscovering10Gann’s Law of VibrationOCTOBER 2008 / VOL. 4 ISSUE 10
James Smithson discusses the discovery and use of Gann’s ‘Law ofVibration,’ a method for accurately forecasting the trends of the stockand commodities marketsIntroductionWilliam D. Gann (1878 – 1955) was an outstandingtechnical analyst. He was also a prolific teacher of howto make speculation a profitable profession, writing sevenbooks and producing two courses on trading the stock andcommodities markets. However, Gann’s superlative skillwas his ability to accurately forecast the stock and commodities markets. Gann’s forecasting method was basedupon what he called the ‘Law Of Vibration.’ This articleseeks to rediscover Gann’s ‘Law Of Vibration.’GANN’S GREAT DISCOVERY OF AUGUST 8TH, 1908Almost one hundred years ago, Gann made one of hismost important discoveries.More specifically, as Gann recorded in his booklet entitled“Why Money is Lost on Commodities and Stocks and How toMake Profits” (1954):“1908 May 12th left Oklahoma City for New York City. August 8th made one of (his) greatest mathematical discoveriesfor predicting the trend of stocks and commodities. Startedtrading with a capital of 300 and made 25,000. Startedanother account with 130 and made 12,000 in thirty days’time.”On August 8, 1908, Gann was 30 years old. Moreover,he was 76 years old when in 1954 he wrote his booklet“Why Money is Lost on Commodities and Stocks and How toMake Profits.” Gann clearly made an important discoveryon August 8, 1908, because he recalled the precise date 46years later.In December 1909, he gave an interview to the “TickerAnd Investment Digest” magazine, sixteen months afterhis important discovery. The overall conclusion from thisinterview is that Gann had discovered a unique methodto precisely forecast the trend of stocks and commodities.The forecast was based upon what he called the ‘Law OfVibration,’ and he was achieving great financial success inits practical application.Gann’s major discovery appears to have been some crucialand practical part of his forecasting method that he calledthe ‘Law Of Vibration’ and he provided a partial explanation of this Law Of Vibration in his interview. Morespecifically, he made it clear that he would not provide adetailed explanation (“Mr. Gann has refused to disclosehis method at any price”, Ticker interview). However, hewas willing to provide a general description of his Law OfVibration (“We have asked Mr. Gann for an outline of hiswork, and have secured some remarkable evidence as tothe results obtained therefrom,” Ticker interview).THE PRINCIPLES OF GANN’S LAW OF VIBRATIONThe principles of Gann’s Law Of Vibration, as discernedfrom his interview of December 1909 to the “Ticker AndInvestment Digest” are as follows.1. Stocks and commodities (and everything else on earth)vibrate. Moreover, vibration provides a comprehensiveexplanation of price movement in financial markets.“Vibration is fundamental; nothing is exempt from thislaw; it is universal, therefore applicable to every class ofphenomena on the globe . After years of patient studyI have proven to my entire satisfaction, as well as demonstrated to others, that vibration explains every possiblephase and condition of the market” (Ticker interview).2. Stocks and commodities vibrate in accordance withboth their own individual energy/vibration (i.e. internal vibration) and also in accordance with energy/vibration transmitted through space (i.e. external vibration).“From my extensive investigations, studies and appliedtests, I find that not only do the various stocks vibrate, butthat the driving forces controlling the stocks are also in astate of vibration” (Ticker interview).3. The overall energy/vibration of a stock or commodity isreflected in its price.“These vibratory forces can only be known by the moveOCTOBER 2008 / VOL. 4 ISSUE 1011
TECHNICAL ANALYSISments they generate on the stocks and their values in themarket” (Ticker interview).8. The external energy/vibration acting on a stock or commodity is in fact astrological influences.4. Financial markets essentially comprise a series of impulses that produce price movements with specificrates of vibration.Unfortunately, Gann does not explicitly state this inhis Ticker interview. This is not surprising in view ofthe fact that Gann made it clear he would not providea detailed explanation of his Law Of Vibration (“Mr.Gann has refused to disclose his method at any price”,Ticker interview).“Science teaches that an original impulse of any kind finally resolves itself into periodic or rhythmical motion”(Ticker interview).5. The price movement of a stock or commodity unfoldsin a coherent way because stocks and commodities areessentially centres of energies and these energies (or vibrations) are controlled mathematically.“Stocks, like atoms, are really centres of energies. Therefore, they are controlled mathematically . There is nochance in nature because mathematical principles of thehighest order lie at the foundation of all things” (Tickerinterview).6. When the overall vibration of a stock or commodityis in balance, its price will maintain a constant rate ofvibration (i.e. prices will form a trend). Consequently,this overall rate of vibration (or trend line) can be precisely measured and future prices forecast by means ofthe so-called Gann angles or Gann fan lines (i.e. 1 x 1,1 x 2, 1 x 4, 1 x 8 angles, etc. and their subdivisions).“The power to determine the trend of the market is dueto my knowledge of the characteristics of each individualstock and a certain grouping of different stocks under theirproper rates of vibration. Stocks are like electrons, atomsand molecules, which hold persistently to their own individuality in response to the fundamental Law Of Vibration . After exhaustive researches and investigations ofthe known sciences, I discovered that the Law Of Vibration enabled me to accurately determine the exact pointsto which stocks or commodities should rise and fall withina given time. The working out of this law determines thecause and predicts the effect long before the Street is awareof either” (Ticker interview).7. These principles can be applied to forecast the trend ofstocks or commodities over multiple timeframes. Forexample, a minor impulse may produce a price movement with a specific rate of vibration that lasts only afew hours. Alternatively, a major impulse may produce a price movement with a specific rate of vibrationthat lasts for a number of years (e.g. the rise in the DowJones Industrial Average from 1921 to 1929).“The law which I have applied will not only give theselong cycles or swings, but the daily and even hourly movements of stocks” (Ticker interview).12OCTOBER 2008 / VOL. 4 ISSUE 10Consequently, one has to turn to Gann’s semi-autobiographical novel entitled “The Tunnel Through the Air,” written eighteen years later in 1927, for supporting evidenceon this key principle. Such supporting evidence includesthe following excerpts.“Robert was a great believer in astrology because he had foundthis great science referred to so many times in the Holy Bible . He had made notes as he read “The Bible” at differenttimes where it referred to astrology or the signs in the heavensand was thoroughly convinced that the influence of the heavenly bodies govern our lives” (The Tunnel Through the Air,page 172).“I believe in the stars, I believe in astrology, and I have figuredout my destiny. “The Bible” makes it plain that the stars dorule” (The Tunnel Through the Air, page 66).“Through my study of “The Bible,” I have determined the major and minor time factors which repeat in the history of nations, men and markets” (The Tunnel Through the Air, page70).“I have studied “The Bible” very carefully because I believeit is the greatest scientific book ever written. The laws areplainly laid down how to make a success. There is a time anda season for everything and if a man does things accordingto the time, he will succeed” (The Tunnel Through the Air,page 204).“Robert had gone deeply into “The Bible” study in order tolearn more about the great science of astrology” (The TunnelThrough the Air, page 213).“He read all the books he could get on astrology and began tounderstand why things had happened as they had” (The Tunnel Through the Air, page 215).1. Astrological influences act in a way that is analogous toradio waves; i.e. they have a specific wavelength, theytravel through space and they are received by and influence those stocks and commodities that vibrate with aresonant frequency.“It is impossible here to give an adequate idea of the LawOf Vibration as I apply it to the markets. However, the
TECHNICAL ANALYSISlayman may be able to grasp some of the principles whenI state that the Law Of Vibration is the fundamental lawupon which wireless telegraphy, wireless telephones andphonographs are based” (Ticker interview).1. Identify the point in time that marks the start of anuptrend or downtrend. This can be achieved by examining the daily, weekly or monthly price chart of thestock or commodity.2. From time to time, a stock or commodity will lose itssensitivity (or receptivity) to astrological influences (i.e.to external energy/vibration). As a consequence, it willbecome inert (i.e. its rate of vibration will fall) and itsprice will typically enter a downtrend.2. Identify the predominant astrological influence (orcycle) driving the uptrend or downtrend. In order toachieve this, it will be necessary to examine previouscycles of the stock or commodity in order to identifywhich particular astrological influences have driven thestock or commodity in the past. In this task, it will beespecially helpful to examine the all-time high and alltime low price of the stock or commodity because atthese price extremes the astrological influences will typically be very strong or very weak, respectively. Thus,under the Law Of Vibration, a high price is caused bya high rate of vibration, which in turn is caused bystrongly positive astrological influences (and vice versa).“Stocks create their own field of action and power; powerto attract and repel, which principle explains why certainstocks at times lead the market and ‘turn dead’ at othertimes” (Ticker interview).3. Thus, the key technique in applying the Law Of Vibration is to accurately identify the major astrologicalinfluence driving a particular stock or commodity, toidentify the resultant rate of vibration and to forecasthow future astrological influences will impact this rateof vibration.“By my method, I can determine the vibration of eachstock and by also taking certain time values into consideration I can in the majority of cases tell exactly what thestock will do under given conditions” (Ticker interview).4. Taken together, these principles of the Law Of Vibration constitute a coherent theory of how financial markets work. Indeed, they constitute a new paradigm.However, as with any new paradigm, it challenges theconventional wisdom and therefore encounters resistance from practitioners of the conventional wisdom.“It appears to be a fact that Mr. Gann has developed anentirely new idea as to the principles governing stock market movements . We have asked Mr. Gann for an outlineof his work and have secured some remarkable evidence asto the results obtained therefrom. We submit this in fullrecognition of the fact that in Wall Street a man with anew idea, an idea which violates the traditions and encourages a scientific view of the proposition, is not usuallywelcomed by the majority, for the reason that he stimulatesthought and research. These activities said majority abhors” (Ticker interview).THE PRACTICAL APPLICATION OF GANN’S LAW OF VIBRATIONNow, we will turn from an examination of the general principles of the Law Of Vibration, as discerned from Gann’sinterview to the “Ticker And Investment Digest,” to anexamination of the key steps in its practical application.These key steps in the practical application of Gann’s LawOf Vibration are as follows.14OCTOBER 2008 / VOL. 4 ISSUE 103. Identify the general rate of vibration of the uptrend ordowntrend. This can be achieved by placing the originof the Gann angles (or Gann fan lines) at the startingpoint (in time and price) of the uptrend or downtrend.In this task, it will be helpful to have prepared a transparent plastic chart overlay inscribed with the majorGann angles (i.e. 1 x 8, 1 x 4, 1 x 2, 1 x 1, 2 x 1, 4 x 1,8 x 1, etc.) and their subdivisions.4. Forecast the approximate date when the predominantastrological influence (or cycle) that is driving the uptrend (and was identified in point 2) will end. This canbe achieved by consulting an ephemeris and the astrological chart of the start of the uptrend or downtrend.5. Forecast the future price when the uptrend or downtrend will end. This can be achieved by identifyingthe intersection of the general rate of vibration of theuptrend or downtrend (point 3) and the forecast datethat the uptrend or downtrend will end (point 4).6. Monitor one’s forecast, which comprises all of the aboveelements. In particular, note that short-term positiveastrological influences will increase the rate of vibration and temporarily drive prices above the long-termrate of vibration (i.e. above the long-term Gann angleidentified in point 3). Conversely, note that short-termnegative astrological influences will decrease the rate ofvibration and temporarily drive prices below the longterm rate of vibration (i.e. below the long-term Gannangle). However, when these short-term influencesexpire, stock or commodity prices will revert to theirlong-term rate of vibration (i.e. the long-term Gannangle).
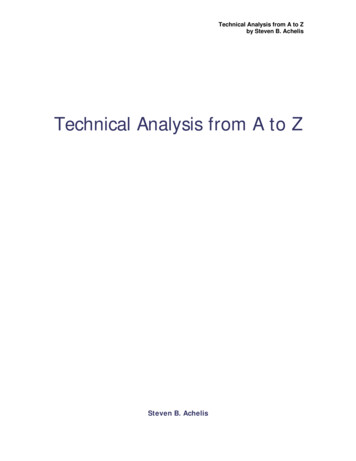
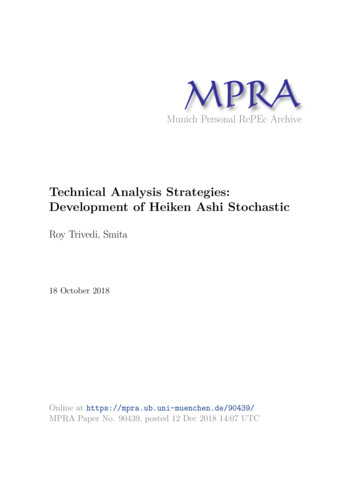
TECHNICAL ANALYSISEXAMPLES OF THE PRACTICAL APPLICATION OF GANN’S LAW OFVIBRATIONNow, we will examine two examples of the practical application of Gann’s Law Of Vibration, which are provided inhis interview to the “Ticker And Investment Digest.”1) September 1909 Wheat futures contract (please seechart 1).“One of the most astonishing calculations made by MrGann was during last summer (1909) when he predictedthat September wheat would sell at 1.20. This meantthat it must touch that figure before the end of the monthof September. At twelve o’clock, Chicago time, on September 30th (the last day) the option was selling below 1.08 and it looked as though his prediction would notbe fulfilled. Mr. Gann said, ‘If it does not touch 1.20 bythe close of the market it will prove that there is somethingwrong with my whole method of calculation. I do not carewhat the price is now, it must go there.’ It is common history that September wheat surprised the whole country byselling at 1.20 and no higher in the very last hour of thetrading, closing at that figure” (Ticker interview).1) Gann identified the start of the uptrend in the September 1909 wheat futures contract as a price of 94 centson January 26, 1909.2) Gann identified the predominant astrological influences driving this uptrend.16OCTOBER 2008 / VOL. 4 ISSUE 103) Gann identified the long-term rate of vibration of thisuptrend, which was 0.1053 cents per day (or 1 cent per9.5 days).4) Gann forecast that the predominant astrological influences driving this uptrend would remain in force untilat least the end of this futures contract (i.e. until at leastSeptember 30, 1909).5) Gann forecast that at the end of the futures contractthe price would be 1.20. This was based on the starting point of the uptrend (point 1 above), the long-termrate of vibration (point 3) and the contract’s expiry dateof September 30, 1909.6) In monitoring his forecast, Gann observed that sincethe beginning of the uptrend on January 26, 1909,short-term astrological influences had temporarily driven prices above and below the long-term trend or rateof vibration. Gann also observed that between July 21and August 26, 1909, stronger short-term negative (ormalefic) astrological influences had driven prices downwell below the long-term rate of vibration. Moreover,Gann observed that commencing August 26, 1909,(i.e. the low point of 96¾ cents) these strongly negativeshort-term influences started to expire and he forecastthat they would fully expire over the next month, whenprices would revert to their earlier long-term rate ofvibration.Importantly, Gann received corroboration of the low
OCTOBER 2008 / VOL. 4 ISSUE 1017
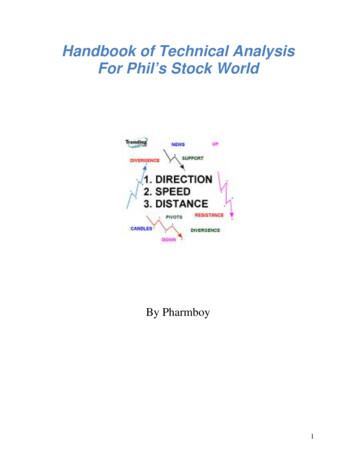
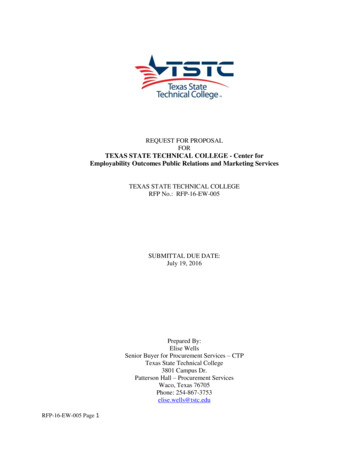
TECHNICAL ANALYSISpoint in August from the fact that a price of 96¾ cents onAugust 26, 1909, equates to a rate of vibration of 0.0132cents per day (based on the starting point of 94 cents onJanuary 26, 1909). This rate of vibration is one eighth ofthe long-term rate of vibration of 0.1053 cents per day.Another perspective is that on August 26, 1909, the longterm rate of vibration of this wheat futures contract hadhalved three times. Thus, from August 26, 1909, Gannforecast and observed the simultaneous expiration of theshort-term negative astrological influences and the doubling three times of the rate of vibration, as the long-termrate of vibration was regained on September 30, 1909.2) United States Steel stock price (please see chart 2).“He (Mr. Gann) came to me when United StatesSteel was selling around 50 and said, ‘This Steel willrun up to 58 but it will not sell at 59. From there, itshould break 16¾ points.’ We sold it short around 583/8 with a stop at 59. The highest it went was 58¾.From there it declined to 41¼; -17½ points” (Tickerarticle).1) Gann identified the start of the uptrend in U.S. Steel asa price of 21-7/8 cents on October 23, 1907.2) Gann identified the predominant astrological influences driving this uptrend.3) Gann identified the long-term rate of vibration of thisuptrend, which was 0.0950 cents per day (or 1 cent per10.5 days).4) Gann forecast that the predominant astrological influences driving this uptrend would remain in force untilOctober 1909, and hence in November 1908 he wasonly forecasting a short-term correction. More specifically, Gann made his forecast “When United StatesSteel was selling around 50,” which was in early November 1908. Gann forecast that due to short-termnegative astrological influences a correction would starton November 14, 1908 (i.e. within two weeks).5) Based on the starting point of the uptrend (point 1)and the long-term rate of vibration (point 3) and thestarting date of the correction (point 4), Gann was ableto forecast that “Steel will run up to 58 but it will notsell at 59.” In fact, the price of U.S. Steel peaked at58¾ on November 14, 1908.6) Gann forecast that the short-term negative astrologicalinfluences that he had identified would remain in forceuntil February 23, 1909.7) Gann forecast what the rate of vibration would fall toon February 23, 1909 (i.e which Gann angle would18OCTOBER 2008 / VOL. 4 ISSUE 10provide support before the long-term uptrend was resumed). Importantly, in making this forecast Gann subdivided the rate of vibration. More specifically, and asthe price chart of U.S. Steel shows, Gann forecast thatthe price of U.S. Steel would fall to the bottom of itscurrent vibratory band and finally fall three quarters ofthe band below. Thus, Gann forecast that the shortterm correction would last until February 23, 1909,and that the rate of vibration of U.S. Steel would fallon that day from its long-term rate of 0.0950 cents perday to (1/1.5) X (1.25/2) X 0.0950 0.0396 cents perday. This is in fact exactly what happened. More specifically, on February 23, 1909, U.S. Steel made a lowprice of 41¼ cents (which based on the starting pointof 21 7/8 cents on October 23, 1907, equates to a rateof vibration of 0.0396 cents per day). From that point,the long-term uptrend of U.S. Steel was resumed.An important point from this example is that Gann didnot merely use his so-called Gann angles as a crude measure of the rate of vibration of stocks and commodities.More specifically, he did not use them simply to measurethe doubling and halving of the rate of vibration. Rather,he also discovered and employed sub-shells within a principal energy level, which is analogous to modern quantumtheory. Therefore, we have discovered another importantprinciple of Gann’s Law Of Vibration; namely the rate ofvibration of stocks and commodities, as measured by socalled Gann angles, conforms to a series of principal energy levels and sub-shells.As we have seen, an important implication (and practicalapplication) of this is that rates of vibration, as measuredby these principal energy levels and sub-shells, constitutesupport and resistance levels. This clarifies the statementmade by Gann: “By knowing the exact vibration of eachindividual stock, I am able to determine at what pointeach will receive support and at what point the greatestresistance is to be met” (Ticker interview).Moreover, this principle in turn sheds light upon a somewhat obscure concept that Gann briefly introduced in hisstock market course and his commodities course, namelythe ‘concept of lost motion:’“As there is lost motion in every kind of machinery, sothere is lost motion in the stock market due to momentum, which drives a stock slightly above or below a resistance level. The average lost motion is 1 7/8 points. Whena stock is very active and advances or declines fast on heavyvolume, it will often go from 1 to 1 7/8 points above ahalfway point or other strong resistance level and not go3 points. The same rule applies on a decline. It will often pass an important resistance point by 1 7/8 points butnot go 3 full points beyond it. That is why I advise using
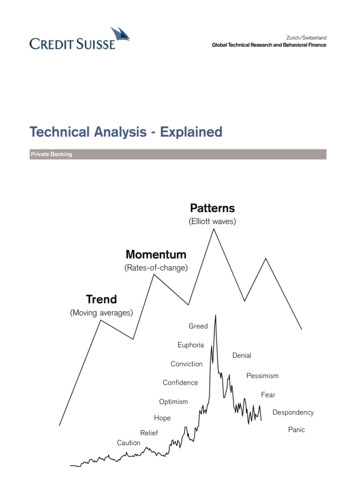
TECHNICAL ANALYSISa stop-loss order 3 points above a top or 3 points belowa bottom” (W. D. Gann Stock Market Course, Chapter10).In summary, from examining examples of the practical application of Gann’s Law Of Vibration, we have identifiedthree further principles of the Law Of Vibration:1) The rate of vibration of stocks and commodities conforms to a series of principal energy levels and subshells. More specifically, the principal energy levelsequate to a doubling and halving of the rate of vibration and the sub-shells equate to a fourfold division ofa principal energy level.2) These principal energy levels and sub-shells constituteimportant support and resistance points.3) When a stock or commodity is very active, momentumwill often drive the price very slightly above or belowthe precise support or resistance point, which is determined by the rate of vibration (in conjunction withastrological influences).GANN’S ANNUAL FORECASTSAs the examples from the Ticker interview show, around1909 Gann was employing his Law Of Vibration to precisely forecast stock and commodity prices up to severalmonths forward. However starting around 1915, Gannproduced and sold annual forecasts of the stock and commodity markets. Although Gann produced these annualforecasts up to his death in 1955, relatively few survive.Nevertheless, from the surviving annual forecasts, it appears that Gann produced them in exactly the same way ashe had produced his earlier shorter-term forecasts; namelybased on the Law Of Vibration.One particularly accurate annual forecast was Gann’s 1929stock market forecast (which Gann reproduced in theappendix of his book “Wall Street Stock Selector” writtenin 1930). In summary, Gann’s 1929 annual stock marketforecast was completed and distributed on November 23,1928, and included the following elements:1) A narrative that stated “General Outlook For 1929.This year occurs in a cycle that shows the ending ofthe bull market and the beginning of a prolonged bearcampaign . The fact that it has run longer and priceshave advanced to such abnormal heights means thatwhen the decline sets in it must be in proportion to theadvance. The year 1929 will witness some sharp, severepanicky declines in many high-priced stocks.”2) A projected graph or chart of the Dow Jones IndustrialAverage that forecasts this index would peak on August20OCTOBER 2008 / VOL. 4 ISSUE 107, 1929, and then starts a major downtrend for the restof the year.3) A projected graph or chart of the Dow Jones RailroadAverage that forecasts this index would peak on August8 or 9, 1929, and then start a major downtrend for therest of the year.Although it should be noted that the Dow Jones IndustrialAverage and the Dow Jones Railroad Average both peaked on September 3, 1929, (rather than in early August),overall Gann’s annual stock market forecast for 1929 washighly accurate.Moreover, from a careful examination of Gann’s 1929 stockmarket forecast, it is possible to discern further principlesof the Law Of Vibration. These principles are as follows.1) Although the Law Of Vibration comprises a number ofelements, the time factor is the most important. Morespecifically, throughout his career Gann used the term“time factor” as a substitute or synonym for astrological influences. Therefore astrological influences are themost important element in the Law Of Vibration.“The time given for tops and bottoms is the most important factor for you to know and watch. It makes nodifference about the price a stock is selling at. So longas you know when it will reach low or high levels youcan buy or sell and make money . Remember youmust buy and sell at the right time regardless of prices.No matter how high stocks are, if they are going higher,you should buy. It makes no difference how low theyare; if the trend is down and they are going lower, youmust sell short and go with the trend” (1929 AnnualStock Market Forecast).2) In applying the Law Of Vibration to the stock market,it is important not only to assess the astrological influences (i.e. external vibrations) but also the internalvibrations of a stock. For example, assume that duringa general stock market uptrend there is a short-termcorrection (due to negative astrological influences) andmost stocks fall in price. If during that period of time,a particular stock merely moves sideways, rather thanfalls, it indicates that the internal vibrations of thatstock are especially strong and therefore it will subsequently perform strongly when the overall uptrend (i.e.positive astrological influence) is resumed.“The Dow Jones 30 Industrial stocks are representativeof the active industrials and most of them will followthe Industrial Curve (i.e. Gann’s forecast) very closely.But some of the individual stocks that are in strong orweak position will vary from this curve and make topsand bottoms at different times. These special stocks
and their position will be covered in the supplementseach month” (1929 Annual Stock Market Forecast).3) Stocks and commodities typically do not switch froman uptrend to a downtrend until their rate of vibrationhas slowed down. This reduction in the rate of vibration can be observed as prices move sideways (or down)over time to lower (and slower) Gann angles.“The ones (i.e. the stocks) that make top in the earlypart of the year and fail to reach higher levels in Julyor August will be the ones to lead the decline, becausethey will have had longer time for distribution. Guardagainst selling short the late movers until they havehad time to complete distribution” (1929 Annual StockMarket Forecast).It is important to note that although for many years Gannproduced and sold annual forecasts of the stock and commodities markets, he did not intend for his subscribers torely on these alone. Indeed, Gann recognised the importance of his subsequent monitoring of these markets andhis regular updates. Consequently, Gann issued supplements, or updates, three times each week by means of his“Supply And Demand Letter,” which he described as follows:“People often write for my opinion on Baldwin, U.S. Steel,General Asphalt or some special stock. I judge the stockby the position of time and volume as it is today. If in afew days, I see a large amount of volume, up or down, Ichange my position, so it is not always what I think of astock today, but what I am going to think of it later thatcounts. That is why I issue a tri-weekly letter because themarket changes and I can advise my subscribers to changetheir position and protect themselves against losses. If themarket never reversed its trend, there would be no need ofa tri-weekly letter” (“Wall Street Stock Selector”, 1930, appendix).In the practical application of the Law Of Vibration, thetime factor, or astrological influences are the most important element. Consequently, in preparing his annual forecasts, Gann was required to assess numerous astrologicalinfluences over the subsequent year. Assessing months inadvance how strong astrological influences (both positiveand negative) will be and how long they will remain inforce is a complex task prone to error on occasion. Gannfound it necessary to issue regular letters to his subscribersin order to clarify and correct his annual forecasts whennecessary, as well as to identify particular stocks and commodities that were especially strong or weak. Therefore, ata fundamental level, Gann was constantly forecasting andmonitoring external vibrations (in the form of astrologicalinfluences) and internal vibrations (in the form of assess-ing the particular strength or weakness of individual stocksand commodities).CONCLUSIONThis paper has identified, or rediscovered, many of the elements of Gann’s Law Of Vibration. However, the mostimportant and most difficult element is to identify andassess the past, present and future astrological influenceson a stock or commodity.Consequently over the next year, around the centenary onAugust 8, 2008, of Gann’s discovery of the Law Of Vibration, this should be the principal focus of Gann researchersworldwide. Indeed, correctly identifying the true principles of astrology and the precise astrological influencesimpacting a particular financial market should perhaps bethe focus of technical analysts in general who truly wishto extend the frontiers of technical analysis in the earlytwenty-first century.Finally, the centenary of Gann’s discovery of the Law OfVibration, August 8 20
“Why Money is Lost on Commodities and Stocks and How to Make Profits.” Gann clearly made an important discovery on August 8, 1908, because he recalled the precise date 46 years later. In December 1909, he gave an interview to the “Ticker And Investment Digest” magazin