Transcription
Zurich/SwitzerlandGlobal Technical Research and Behavioral FinanceTechnical Analysis - ExplainedPrivate BankingPatterns(Elliott waves)Momentum(Rates-of-change)Trend(Moving ic
Technical Analysis - ExplainedContentsWhat is technical analysis? . . . . . . . . . . . . . . . . . . . . . . . . . 3Technical analysis pre-empts fundamental data . . . . . . . 4Mood governs ratio . . . . . . . . . . . . . . . . . . . . . . . . . . . . . . 5Optimism, pessimism, greed and fear . . . . . . . . . . . . . . . 6Chart types and chart construction . . . . . . . . . . . . . . . . . . 7Support and resistance . . . . . . . . . . . . . . . . . . . . . . . . . . . 8Trendlines . . . . . . . . . . . . . . . . . . . . . . . . . . . . . . . . . . . . . 9Investment horizons . . . . . . . . . . . . . . . . . . . . . . . . . . . . . 10What trend? . . . . . . . . . . . . . . . . . . . . . . . . . . . . . . . . . . . . 11Moving averages . . . . . . . . . . . . . . . . . . . . . . . . . . . . . . . 12The simple moving average . . . . . . . . . . . . . . . . . . . . . . 13Long-, medium- and short-term averages . . . . . . . . . . . 14Moving average crossover . . . . . . . . . . . . . . . . . . . . . . . . 15Momentum . . . . . . . . . . . . . . . . . . . . . . . . . . . . . . . . . . . 16Momentum, indicator signals . . . . . . . . . . . . . . . . . . . . . 17Long-, medium- and short-term indicators . . . . . . . . . . . 189500Trend and momentum combination . . . . . . . . . . . . . . . . 19Reversal and redistribution . . . . . . . . . .9000. . . . . . . . . . . . . . 20Equity analysis . . . . . . . . . . . . . . . . . . . 8500. . . . . . . . . . . . . . 21Cycle phase distribution . . . . . . . . . . . . . . . . . . . . . . . . . 22The Elliott Wave Principle . . . . . . . . . . .8000.23Catalog of impulsive waves . . . . . . . . . . . . . . . . . . . . . . 24Catalog of corrective patterns . . . . . . .7500. . . . . . . . . . . . . 25Impulsive wave patterns, example. . . . . . . . . . . . . . . . . 267000Corrective wave patterns, example . . . . . . . . . . . . . . . . 27Head and shoulder reversal pattern . . .6500. . . . . . . . . . . . . 28Fascinating Fibonacci . . . . . . . . . . . . . . . . . . . . . . . . . . . 29Wave correlations . . . . . . . . . . . . . . . . . . . . . . . . . . . . .306000Fibonacci correlation - more than coincidence . . . . . . 31Diploma in basic technical analysis . . . . . . . . . . . . . . .32Global Technical Research-2-
Technical Analysis - ExplainedPrice chart650060005500Technical gSepOctNovDec2010FebMarAprWhat is technical analysis?Technical analysis is the study of financial market action. The technician looks at price changes thatoccur on a day-to-day or week-to-week basis or over any other constant time period displayed ingraphic form, called charts. Hence the name chart analysis.A chartist analyzes price charts only, while the technical analyst studies technical indicators derivedfrom price changes in addition to the price charts.Technical analysts examine the price action of the financial markets instead of the fundamental factors that (seem to) effect market prices. Technicians believe that even if all relevant information of aparticular market or stock was available, you still could not predict a precise market "response" to thatinformation. There are so many factors interacting at any one time that it is easy for important onesto be ignored in favor of those that are considered as the "flavor of the day."The technical analyst believes that all the relevant market information is reflected (or discounted) inthe price with the exception of shocking news such as natural distasters or acts of God. These factors, however, are discounted very quickly.Watching financial markets, it becomes obvious that there are trends, momentum and patterns thatrepeat over time, not exactly the same way but similar. Charts are self-similar as they show the samefractal structure (a fractal is a tiny pattern; self-similar means the overall pattern is made up of smallerversions of the same pattern) whether in stocks, commodities, currencies, bonds. A chart is a mirrorof the mood of the crowd and not of the fundamental factors. Thus, technical analysis is theanalysis of human mass psychology. Therefore, it is also called behavioral finance.Global Technical Research-3-
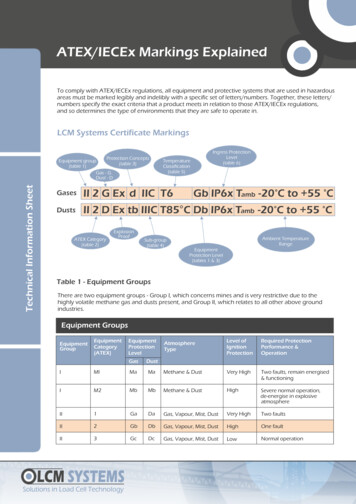
Technical Analysis - ExplainedAEconomicrecessionEconomicrecessionStock marketEconomic growthBBTechnical analysis pre-empts fundamental dataFundamentalists believe there is a cause and effect between fundamental factors and price changes.This means, if the fundamental news is positive the price should rise, and if the news is negative theprice should fall. However, long-term analyses of price changes in financial markets around the worldshow that such a correlation is present only in the short-term horizon and only to a limited extent. It isnon-existent on a medium- and long-term basis.In fact, the contrary is true. The stock market itself is the best predictor of the future fundamentaltrend. Most often, prices start rising in a new bull trend while the economy is still in recession (positionB on chart shown above), i.e. while there is no cause for such an uptrend. Vice versa, prices startfalling in a new bear trend while the economy is still growing (position A), and not providing fundamental reasons to sell. There is a time-lag of several months by which the fundamental trend follows thestock market trend. Moreover, this is not only true for the stock market and the economy, but also forthe price trends of individual equities and company earnings. Stock prices peak ahead of peak earnings while bottoming ahead of peak losses.The purpose of technical analysis is to identify trend changes that precede the fundamentaltrend and do not (yet) make sense if compared to the concurrent fundamental trend.Global Technical Research-4-
Technical Analysis - ExplainedGREEDFEARMood governs ratioKnow yourself and knowledge of the stock market will soon follow. Ego and emotions determine farmore of investors stock market decisions than most would be willing to admit.For years, we have dealt with professional money managers and committees and found they were asmuch subject to crowd following and other irrational emotional mistakes as any novice investor. Theywere, for the most part, better informed, but facts alone are not enough to make profitable decisions. The human element, which encompasses a range of emotions fromfear to greed, plays a much bigger rolein the decision-making process thanmost investors realize.In a practical sense, most investors actexactly opposite to the rational wisdomof buying low and selling high based onvery predictable emotional responses torising or falling prices. Falling prices thatat first appear to be bargains generate fear of loss at much lower prices when opportunities are thegreatest. Rising prices that at first appear to be good opportunities to sell ultimately lead to greedinduced buying at much higher levels. Reason is replaced by emotion and rationalization with suchcyclical regularity, that those who recognize the symptoms and the trend changes on the charts canprofit very well from this knowledge.Investors who manage to act opposite to the mood of the crowd and against their own emotions arebest positioned to earn money in the financial markets. Financial risk and emotional risk correlateinversely.Global Technical Research-5-
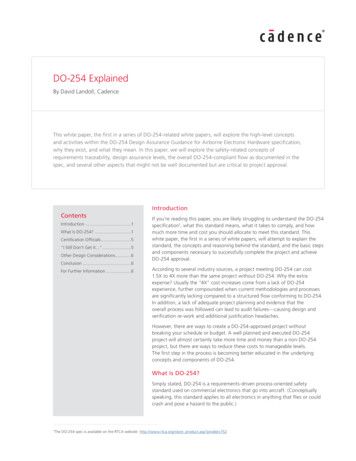
Technical Analysis - Explained(Optimism, Greed, Euphoria)ConvictionConfidenceComplacencyPrice trendConcernCautionCapitulation(Pessimism, Fear, Panic)Optimism, pessimism, greed and fearWhy aren t more people making more money in the financial markets? Because, as we have seen,people are motivated by greed (optimism) when buying and by fear (pessimism) when selling. Peopleare motivated to buy and sell by changes in emotion from optimism to pessimism and vice versa.They formulate fundamental scenarios based on their emotional state (a rationalization of the emotions), which prevents them from realizing that the main drive is emotion.The chart above shows that if investors buy based on confidence or conviction (optimism) they BUYnear or at the TOP. Likewise, if investors act on concern or capitulation (pessimism) they SELL nearor at the BOTTOM. Investors remain under the bullish impression of the recent uptrend beyond theforming price top and during a large part of the bear trend. Vice versa, they remain pessimistic underthe bearish impression from the past downtrend through the market bottom and during a large part ofthe next bull trend. They adjust their bullish fundamental scenarios to bearish AFTER having becomepessimistic under the pressure of the downtrend or AFTER having become optimistic under the pressure of the uptrend. Once having turned bearish, investors formulate bearish scenarios, looking formore weakness just when it is about time to buy again. The same occurs in an uptrend when moodshifts from pessimism to optimism. Investors formulate bullish scenarios AFTER having turned bullish,which is after a large part of the bull trend is already over. Emotions are the drawback of fundamentalanalysis. Investors must learn to buy when they are fearful (pessimistic) and sell when they feel euphoric (optimstic). This may sound easy (simple contrary opinion), but without Technical Analysis it ishard to achieve.The main purpose of technical analysis is to help investors identify turning points which theycannot see because of individual and group psychological factors.Global Technical Research-6-
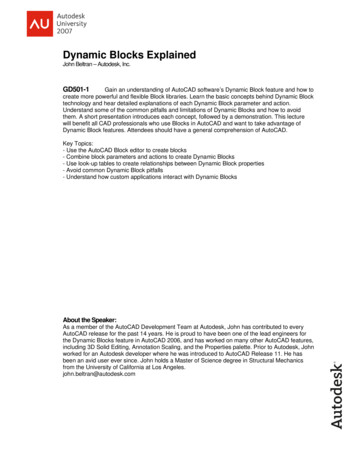
Technical Analysis - ExplainedMonthly OHLCbar chartWeekly OHLCbar 03200420052006200720082009201020112012Daily OHLCbar chartA MJ AS O ND 2009A M J J AS O N D 2010A M J J AHourly OHLCbar aryMarchApril81522February1MarchBar chartsthe end of the period. For example, on themonthly chart, a bar indicates the high and theFour bar charts of the Swiss Market Index are low at which the SMI traded during that singleshown above. They are the most widely used month.chart types.The bar charts are:Line chartsHigh-low charts orHigh-low-close charts orSometimes we use line charts, especially forOpen-high-low-close chartsElliott wave analysis. A line chart is the simplest ofOne single bar shows the high and the low of the all methods. It is constructed by joining togetherrespective trading period. A vertical bar is used to the closing price of each period, for example dailyconnect the high and the low. Horizontal lines are closings for the daily line chart, weekly closingsused to show the opening price (left) of that spe- for the weekly chart or monthly closings for thecific trading period and the closing price (right) at monthy line chart.Daily closing line chartHighHigh6500Open6000Close5500LowLowMay Jun JulGlobal Technical ResearchAug Sep OctNov Dec 2010-7-
Technical Analysis - ExplainedBreak of resistanceLast peak t peak becomesresistanceLast peak becomesresistance303025Resistancebecomes support1920Support becomesresistance15Last lowbecomes support10Last lowbecomes supportBreak of supportLast lowbecomes support5199619971998Support and resistanceResistance lines are horizontal lines that start at a recent extreme price peak with the line pointinghorizontally into the future. Support lines are horizontal lines that start at a recent extreme of a correction low and also point toward the future on the time axis. An uptrend continues as long as themost recent peak is surpassed and new peak levels are reached. A downtrend continues as long aspast lows are broken, sustaining a series of lower lows and lower highs. Notice that the previoussupport often becomes resistance and resistance becomes support. A resistance or a support linebecomes more important and breaks above or below these lines gain more credibility as the numberof price extremes (peaks for resistance; or lows for support) that can be connected by a single lineincreases.Some examples for Microsoft are shown on the chart above. Microsoft reached a high of 19 in July1997. The price started to correct from there and Microsoft remained below this level until February1998. The 19 level became the resistance, meaning that only if 19 (the highest peak so far in theuptrend) had been broken on the upside would the stock have confirmed its uptrend. The same istrue for the peak at 30 in July 1998. The uptrend was confirmed when the price rose above thisresistance in November 1998.Support levels are positioned for example at 11, 15, 20.5 or 22. As long as the price pushes abovepast peaks (resistance levels) and holds above past support levels (does not break them) the uptrendremains intact. The same is true for the bear trend. The downtrend remains intact as long as the pricefalls below the recent lows (support levels) and fails to rise above past resistance levels.A bearish trend reversal occurs when the price breaks through the most recent support afterfailing to rise above the most recent resistance. A bullish trend reversal occurs when the pricepenetrates the most recent resistance after holding above the most recent support.Global Technical Research-8-
Technical Analysis - Explained212019Trendline isbroken18171615141312Trendline isbroken111098JJASOND1997MATrendlinesResistance levels can either be drawn by horizontal lines (as discussed on the previous page) or canbe uptrending or downtrending lines.The trendline is nothing more than a straight line drawn between at least three points. In an upmovethe low points are connected to for
Technical indicators - 4 - Technical Analysis - Explained Global Technical Research Technicalanalysis pre-emptsfundamental data Fundamentalists believe there is a cause and effect between fundamental factors and price changes. This means, if the fundamental news is positive the price should rise, and if the news is negative the price should fall. However, long-term analyses of