Transcription
Munich Personal RePEc ArchiveTechnical Analysis Strategies:Development of Heiken Ashi StochasticRoy Trivedi, Smita18 October 2018Online at https://mpra.ub.uni-muenchen.de/90439/MPRA Paper No. 90439, posted 12 Dec 2018 14:07 UTC
Heiken Ashi Strategies: Development of HA stochasticDr. Smita Roy Trivedi *6th December, 2018Corresponding author:Dr. Smita Roy Trivedi,National Institute of Bank Management, NIBM Campus, NIBM PO, Kondhwe Khurd,Pune-411048 (India)Email:smita@nibmindia.org; akshmita@gmail.comDr. Smita Roy Trivedi is Assistant Professor at National Institute of Bank Management,Pune, India1
Heiken Ashi Strategies: Development of HA stochasticDr. Smita Roy Trivedi **Assistant Professor, National Institute of Bank Management, NIBM Campus, NIBMPO, Kondhwe Khurd, Pune-411048Corresponding author: Dr. Smita Roy Trivedi, National Institute of Bank Management,NIBM Campus, NIBM PO, Kondhwe Khurd, Pune-411048.Email:smita@nibmindia.org; akshmita@gmail.comAbstract:To trade effectively and profitably, we must understand the trend in the market. While aplethora of popular technical analysis indicators attempt to provide a greater understanding of thetrend in the market, they are limited in signaling both trend generation and momentum. Based onthe Japanese Heiken Ashi (HA) candles we develop the Heiken Ashi stochastic or HASTOC,which can reflect in a single number both the likelihood of trend generation and momentum in themarket. We back test ten strategies using HA and HASTOC for three currencies, one index andone currency for three major time frame in each market. We find the strategies give consistentprofits for these markets. The study contributes to economic literature as well as to practical tradingscenario by the development of a new indicator, HASTOC which in a single number, gives thetrend generation and momentum in the market.Key Words: Technical analysis, Back testing, Heiken Ashi StochasticJEL codes:2
1. INTRODUCTIONAs always, there is the good news and the bad news. The good news, the one that you haveheard ever since you begin trading, is that 'trend is your friend'. The bad news, the one youunderstood soon into the game, is that this illusory friend 'trend' is as difficult to catch. While trendfollowing strategies have historically been in place and are proven to be profitable (Hurst et al.,2017), the challenge for the trader on the desk is to understand the trend early on. To be whatMurphy (1999) calls for the astute trader (who understands the trend generation before others inthe market) you have to be able to the proverbial early bird. The trader who understands the trendgeneration before others in the market is likely to make the major profits. The 'early trader whogets the trend, gets the profits'. So how to be the early trend catcher has remained a perennialquestion for traders. Trend following indicators are abundant but the problem remains that theyare 'following'. The signals are generated later so that you miss a major portion of the market withsuch strategies. Can then momentum-based indicators work? The momentum-based indicatorshelp to understand the trend earlier than others, the signals generated often turn out to reflectmarket vagaries or 'moods of the moment', rather than the general market trend. To be effective,indicators therefore should try to blend in an understanding of trend following with the momentum.Heiken Ashi (HA), the variant of the Japanese candlestick bar, gives an indication of thetrend in the market. Based on the study of trend reversals in HA charts, this paper develops anindicator, the HA Stochastic or HASTOC which can give a unique insight into the trend as well asmomentum in the market. The HASTOC gives a numerical value to show if the trend is changingor about to change and how much is the momentum in the market. I further develop ten strategiesusing the HA candles and HASTOC and back test them on data from five markets: three currencies,GBP/USD, EUR/USD, USD/INR; one index, NIFTY 501, and one equity, State Bank of India2. Ineach market, three time frames are taken to understand how well the strategies work duringintraday and daily frames. We find three strategies which give consistent abnormal profits in allmarket and time frames.The contribution of this study extends to the practical trading scenario as much to theliterature on technical analysis. first, it gives a new indicator which is effective in understandingtrend generation and momentum, and the strategies developed on the basis of this indicator is foundto be effective in back tests involving major markets, across securities, involving popularly tradedtime frames. The findings also add to the literature on technical analysis in two ways. It extendsthe evidence on profitability of technical analysis through back testing of indicators. A host ofempirical studies have shown that technical analysis generates excess returns, eschewing theacademic distrust of it (Pinches, 1970, Menkoff & Taylor, 2007, Surajaras and Sweeney 1992;Menkhoff and Schlumberger 1995; Neely 1997; LeBaron 1999; Saacke, 2002). We add on to theexisting evidence in this context, albeit with a new indicator.2. WHAT DO WE KNOW ABOUT TECHNICAL ANALYSIS PROFITABILITY?12Nifty 50 is the National Stock Exchange of India ( NSE)'s index for the Indian equity marketSBI is India's largest commercial bank3
Technical analysis is the ability to forecast price movements based on qualitative andquantitative study of historical price data. Strategies developed either from visual analysis ofgraphs or statistical analyses of price patterns are used to forecast with reasonable accuracy futureprices to generate profits.Economic literature concedes that technical analysis serves as an important tool in thehands of market practitioners as they take their trading decisions (Pinches, 1970, Menkoff &Taylor, 2007, Surajaras and Sweeney 1992; Menkhoff and Schlumberger 1995; Pilbeam 1995;Neely 1997; LeBaron 1999; Saacke, 2002). The earliest empirical studies on profitability oftechnical analysis indicators centered on questioning the success of technical analysis strategies inthe presence of random walk. Brock et al (1992) showed, using technical analysis based on filtertechniques, that profit can be generated substantially in excess of buy and hold returns. Fama(1970) points out that efficient markets should eliminate the presence of excess returns, and in thiscontext, many of the empirical studies have focused closely on whether technical analysis leads togeneration of excess reruns as opposed to positive returns in general.In popular parlance, profitability of technical analysis contradicts the random walkhypothesis. If random walk holds, consequential changes in prices are random, implyingforecasting of prices cannot be done "in any meaningful way" (Fama & Blume 1966). If with newinformation coming the changes in prices behave in a random manner or is distributedindependently as a random variable (Pinches 1970), the forecasting of future prices is ruled out.Following the seminal work of Messe and Rogoff (1983), it is strongly held that random walkexists in forex markets and fundamental forecasting has largely failed to beat random walks (Neelyet al., 2000). However, if technical analysis success comes from under reaction or overreaction toinformation as sentiment sways the market, it may not in fact be violating market efficiency. Forexample, Fama & Blume (1998) points out that if overreaction to market is matched by underreaction in some of the time, it would suggest efficiency exists over longer run.Is technicals then self-fulfilling (Murphy, 1999)? If traders are confident on the ability oftechnical analysis indicators in interpreting psychological biases, logical reasoning suggests thetechnical analysis will be self-fulfilling. This suggests same kind of signals will elicit the similarresponses from traders so that herd behaviour ensues. However the wide variety of technicalanalysis rules often leads to non- uniform signals, rejecting the possibility of herd behaviour.Why should technical analysis be profitable? Menkoff & Taylor (2007) points to the beliefamong traders that technical analysis can represent changes in market psychology. If fundamentalfactors cannot reflect changes or swings in sentiment, prices may not be reflecting all information.The reaction of prices to new information coming from random events is likely to generate newmovement in the market. At the same time, as these prices do not reflect new information, thefundamental analysis may not help to predict prices. Technical analysis strategies do better ininterpreting both the reaction to newer information and consequent generation of new trends.What are these random events? Silber (1994), Andrew C. Szakmary and Mathur (1997),Neely (1998) show the presence of intervention is strongly associated with profits from technicalanalysis indicators. Le Baron (1999) points out that central bank intervention would introducenoticeable trends into the evolution of exchange rates making it possible for market participants togain from trading.4
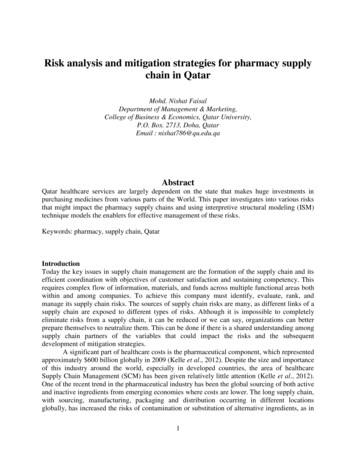
The success of technical analysis indicators in the presence of any market event comesfrom the ability to recognize trend creation. This empirical evidence makes it utmost important forthe trader at the desk to understand trend generation. The basic premise of technical analysis isthat market move in trends which can be recognized through suitable indicators (Murphy, 1999).A majority of technical analysis indicators are trend following trying to recognize trend creationor turn in the market. Indicators based on moving averages try to understand the start of a newtrend by comparing the present price movement to longer term averages.However, as any trader knows, the onset of trend and the reversal of trend remain difficultto predict even with a wide variety of technical analysis indicators. While trend followingindicators have long been used and are profitable (Hurst, et al, 2017), the interpretation of suchsignals to take positions in live trading is far from easy. This explain the wide variety of indicatorsused by traders, from moving averages which give lagged signals, to momentum indicators, whichgive fast signals. In live trading the trader is often confused when with small correction in anuptrend, the momentum indicator goes negative, suggesting a change in position. This is shown inthe Exhibit 1. A trader would like to get the entire uptrend market, between points 1 & 3, in thechart. However, with moving average crossover the signal would come at 2, which would makethe trader lose half the market move. The downtrend that states at point 3, also gets the signal muchlater at 4.The second panel in Exhibit 1 shows Relative Strength Index (RSI)3, a popular momentumindicator. As can be seen RSI gives the signal for trend generation early. RSI going up and above5 can be taken as a buy signal and RSI going down and below 50 as a sell signal. As is seen bypoints B and D, the trend reversal may not captured by above 50 move. RSI moves up and downtoo often as market corrects for us to stay with the trend. Even if we enter market at point A or C,as RSI starts moving up (down) from oversold (overbought) range, the frequent sharp moves inRSI and points like C would be confusing to trader. Traders frequently use two or more indicatorstherefore to form the trading view. Is it possible to combine trend generation and momentumidentification in a single indicator? Effective trading in live markets requires an indicator canpredict the trend generation, the high points with big momentum in the market as well as nextreversal. Heiken Ashi Stochastic developed in the next segment addresses this gap in technicalanalysis by providing an indicator which expresses in a single number both the likelihood of trendgeneration as well as the momentum in the market.The paper adds to the existing literature of technical analysis by development of a newindicator, HASTOC, and presenting of empirical evidence on the profitability of strategies basedon the HASTOC through back testing. For practitioners, the paper presents a new indicatoreffective in live trading.3. DEVELOPMENT OF HA BASED INDICATOR: HASTOC3Relative Strength Index (RSI) indicator forms the basis of the next three strategies. RSI, like any other momentumindicator, gives the strength in the market. It is given byRSIα 100- 100/(1 RS ) .(12)Where RS Up closes/ Down closes over a period of α daysCommonly values of RSI over 70 are interpreted as overbought condition in the market, giving a sell signal. Valuesof RSI below 30 are represented as oversold conditions in the market, giving a buy signal. Further, RSI going above(below) 50 is taken as a buy (sell) signal.5
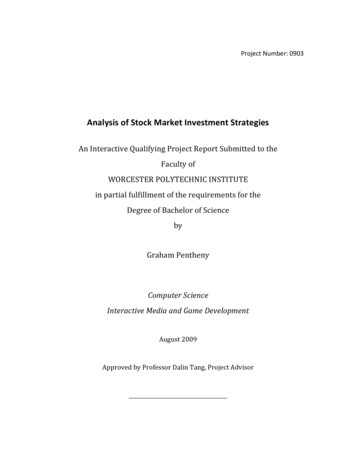
Construct of HA candlesHeiken Ashi is a variant of the very popular Japanese candlestick technique. Candlesticksreflect the Japanese bar charting technique and similar to a bar construct, it also records the fourimportant information that technical analysis traders are seeking namely, open, high, close, low.On the candlestick chart, the open and close is reflected in the broad portion of the bar of thecandle. The high and close for the day is reflected in the shadows or the wicks of the candle. Letus look at figure 1 to understand the candlestick technique. The wide portion shows the body ofthe candle, with the upper and lower lines reflecting either the open or close for the day. If theclose is on the higher side as compared to the open, the shaded area is shown in blue or white. Ifthe close is on the lower side as compared to the open, the shaded area or the candle is shown asred or black. The wicks of the candle show the high and low as shown in the Exhibit 2.Heinken Ashi uses a form of averaging to smooth out the movement in the market. As withthe traditional candlestick pattern, Heinken Ashi also uses the open, high, low, close prices.However, in the Heinken Ash
Heiken Ashi Stochastic developed in the next segment addresses this gap in technical analysis by providing an indicator which expresses in a single number both the likelihood of trend generation as well as the momentum in the market. The paper adds to the existing literature of technical analysis by development of a new indicator, HASTOC, and presenting of empirical evidence on the .