Transcription
Campbell River Project Water Use PlanUpper Campbell, Lower Campbell and John Hart Reservoirsand Diversion Lakes Littoral versus Pelagic Fish ProductionAssessmentImplementation Year 2Reference: JHTMON-5Year 2 Annual Monitoring ReportStudy Period: March 1, 2015 to April 30, 2016Laich-Kwil-Tach Environmental Assessment Ltd. Partnershipand Ecofish Research Ltd.October 17, 2016
JHTMON-5: Littoral versus Pelagic Fish ProductionAssessmentYear 2 Annual Monitoring ReportPrepared for:BC Hydro Water License Requirements6911 Southpoint Drive, 11th FloorBurnaby, BC, V3N 4X8October 17, 2016Prepared by:Laich-Kwil-Tach Environmental Assessment Ltd. PartnershipEcofish Research Ltd.
JHTMON5 – Year 2 Annual Monitoring ReportPage iPhotographs and illustrations copyright 2016Published by Ecofish Research Ltd., Suite F, 450 8th St., Courtenay, B.C., V9N 1N5For inquiries contact: Technical 2Citation:Hocking, M., J. Abell, N. Swain, N. Wright, A. Yeomans-Routledge, M. Marquardson, and T.Hatfield. 2016. JHTMON5 – Littoral versus Pelagic Fish Production Assessment. Year 2Annual Monitoring Report. Consultant’s report prepared for BC Hydro by Ecofish ResearchLtd, October 17, 2016.Certification: stamped version on fileSenior Reviewer:Todd Hatfield, R. P. Bio. No. 927Senior Environmental Scientist/Project ManagerTechnical Leads:Morgan Hocking, Ph.D.Senior Fisheries BiologistDisclaimer:This report was prepared by Ecofish Research Ltd. for the account of BC Hydro. The material in itreflects the best judgement of Ecofish Research Ltd. in light of the information available to it at thetime of preparation. Any use which a third party makes of this report, or any reliance on or decisionsto be made based on it, is the responsibility of such third parties. Ecofish Research Ltd. accepts noresponsibility for damages, if any, suffered by any third party as a result of decisions made oractions, based on this report. This numbered report is a controlled document. Any reproductions ofthis report are uncontrolled and may not be the most recent revision.1230-04
JHTMON5 – Year 2 Annual Monitoring ReportPage iiEXECUTIVE SUMMARYWater Use Plans (WUPs) were developed for all of BC Hydro’s hydroelectric facilities through aconsultative process and monitoring is being undertaken to address outstanding managementquestions in the years following implementation of a WUP. As the Campbell River Water Use Planprocess reached completion, a number of uncertainties remained with respect to the effects of BCHydro operations on aquatic resources. The Upper Campbell, Lower Campbell, John Hart Reservoirs andDiversion Lakes Littoral versus Pelagic Fish Production Assessment (JTHMON-5) is part of widermonitoring of the Campbell River WUP. JTHMON-5 is designed to assess the extent to which fishproduction is driven by littoral vs. pelagic production and how this relates to BC Hydro operations.The Campbell River WUP project area is complex and includes facilities and operations in theCampbell, Quinsam and Salmon watersheds. In addition to the mainstem rivers, there are three largereservoirs, nine diversion lakes influenced by water diverted from the Quinsam and Salmon rivers,and many tributaries and small lakes that are not directly affected by operations. Duringdevelopment of the Campbell River WUP, the Fish Technical Committee (FTC) hypothesized thatfish production in Upper and Lower Campbell reservoirs was negatively impacted by largefluctuations in water level through its effect on littoral production. The FTC also hypothesized thatshort water residence time of the diversion lakes as a result of the BC Hydro diversion operationscould negatively impact pelagic productivity.The JTHMON-5 monitoring program aims to address the following two management questions:1. To what extent do stabilized reservoir levels, as affected by BC hydro operations, benefit fishpopulations?2. What is the relationship between residence time (as affected by diversion rate) and lakeproductivity?JHTMON-5 is scheduled for 10 years and has two components: stable isotope analysis of food websin reservoirs and diversion lakes, and production estimates of pelagic bacteria in reservoirs anddiversion lakes. This report presents data from Year 2 of the stable isotope analysis of food webscomponent. Under the current TOR, sampling using stable isotope methods is scheduled for years1, 2 and 3 of JHTMON-5, with a potential for a fourth year of sampling to be determined at the endof Year 3. Estimates of pelagic bacteria as an indicator of pelagic productivity will be addressed inyears 7, 8, and 9 and thus will be discussed in future years of the program.Substantial information regarding the structure and functioning of lake food webs can be gained byusing stable isotopes to reconstruct the diets of lake biota. JHTMON-5 uses stable isotope analysisof nitrogen and carbon in fish tissues and their potential diet items to assess relative energy flows tofish from littoral vs. pelagic areas. Sampling in Year 2 was completed for Lower Campbell Reservoir,Beavertail Lake, Snakehead Lake and Upper Quinsam Lake. Lower Campbell Reservoir was chosenbecause it experiences some fluctuations in water levels but less than those observed at UpperCampbell Reservoir, which was sampled in Year 1. Beavertail Lake, Snakehead Lake and Upper1230-04
JHTMON5 – Year 2 Annual Monitoring ReportPage iiiQuinsam Lake were chosen because they are either part of the Quinsam River diversion or arenearby control lakes. Snakehead Lake is a receiving lake that is part of the same diversion as MiddleQuinsam (donor lake) and Gooseneck Lake (receiving lake) that were sampled in Year 1. UpperQuinsam is above the water diversion and is therefore a control lake. Beavertail is a nearby controllake.The primary species of interest in JHTMON-5 are Cutthroat Trout (Oncorhynchus clarkii) andRainbow Trout (O. mykiss). Sampling was designed to improve understanding of the diets and energysources of these two fish species, which are the resident fish species of primary managementconcern in reservoirs and lakes of the Campbell River system. Additional sampling of Dolly Varden(Salvelinus malma) was also completed. Gill netting, trap netting and minnow trapping was completedin June through October of 2015 to obtain representative tissue samples from Cutthroat Trout,Rainbow Trout, Dolly Varden and their prey fish including Threespine Stickleback (Gasterosteusaculeatus), Sculpin spp. (Cottus spp.), and juvenile trout (Oncorhynchus spp.) from Lower CampbellReservoir and Beavertail, Snakehead and Upper Quinsam lakes. Primary diet items for CutthroatTrout and Rainbow Trout also include zooplankton (pelagic source), and benthic/littoral, streamand terrestrial invertebrates (littoral source). Invertebrate sampling occurred in June, July and Augustto obtain representative samples from the four lakes. Invertebrates were sorted and counted in thelaboratory to order and family by Elan Downey (BC Centre for Aquatic Health Sciences) and CaseyInrig (A-Tlegay Fisheries Society).Invertebrate and fish samples were processed for nitrogen and carbon stable isotopes at the StableIsotope in Nature Laboratory located within the Canadian Rivers Institute at the University of NewBrunswick in Fredericton, New Brunswick. A total of 246 samples of invertebrates and fish weresent for analysis. The relative contributions of pelagic vs. littoral sources to Cutthroat Trout,Rainbow Trout and Dolly Varden diets were assessed through dual isotope (δ13C and δ15N), four tosix-source Bayesian isotopic mixing models implemented in the program SIAR (Stable IsotopeAnalysis in R). SIAR takes isotope data from consumers (fish) and sources (diet items) along withestimates of diet-tissue isotopic fractionation, and fits Bayesian models that estimate sourcecontributions to diet.In the Year 1 report, we recommended that water residence time be determined for all lakes so thatestimates of littoral versus pelagic production in the target fish species could be modelled as afunction of water residence. Water residence time was calculated for all lakes sampled in Year 1 andYear 2 of JHTMON-5 during Year 2. Water residence time was calculated for the whole year andfor the growing season stratified period using a water balance method. To estimate residence timeduring the stratified period, an effective lake volume was used, which is defined as the averagevolume of the surface mixed layer (epilimnion) times the proportion of year that each study lakebecomes stratified. Based on historical lake temperature records, thermal stratification was assumedto establish within each lake around May 15 and to break down around September 30.1230-04
JHTMON5 – Year 2 Annual Monitoring ReportPage ivNitrogen and carbon stable isotope signatures of all fish and invertebrates were similar among allseven lakes and reservoirs sampled in Year 1 and Year 2. Large Cutthroat and Rainbow trout had thehighest δ15N levels consistent with their top position within lake food webs, followed by smaller preyfish with intermediate trophic level positions. Zooplankton had the lowest δ13C levels consistentwith their pelagic habitat, while littoral, stream, and terrestrial invertebrates had higher δ13C isotopicsignatures, consistent with their terrestrial and littoral sources of carbon in diet. Among the smallprey fish, Threespine Stickleback had the lowest δ13C levels indicative of a pelagic dominated diet.Nitrogen and carbon stable isotope signatures in bulk zooplankton varied by month of collection.Across all lakes, δ15N signatures in zooplankton were significantly higher in August compared toJune or July while δ13C signatures were significantly higher in both July and August compared toJune.In Lower Campbell Reservoir, only 8% of Cutthroat Trout diet is estimated to be derived frompelagic sources and 92% is estimated to be derived from littoral sources, while Rainbow Trout havea pelagic contribution to diet of 23% and a littoral contribution to diet of 77%. In contrast, in Year 1of data collection from Upper Campbell Reservoir, 26% of the diet of Cutthroat Trout wasestimated to be derived from pelagic sources, while 74% was estimated to be derived from littoralsources. Rainbow Trout were estimated to have a pelagic contribution to diet of 44% and a littoralcontribution to diet of 56%.Analysis confirmed the initial hypothesis that top fish consumers have a reduced littoral contributionto diet in Upper Campbell Reservoir compared to Lower Campbell Reservoir. Upper CampbellReservoir has greater fluctuations in water levels than Lower Campbell Reservoir, which may reducelittoral production for fish. However, there are other factors that may explain the patterns weobserved. For example, the seasonal water residence time at Lower Campbell Reservoir was foundto be one of the shortest among all study lakes, and possibly shorter than Snakehead Lake, which isless than 1/100th its area. A short water residence time is due to the relatively large inflows andoutflows of water, which create conditions during the stratification period that may limit pelagicproduction. Despite the large pelagic areas of each reservoir, the top fish consumers in bothreservoirs appear to be supported by littoral production to a greater extent than pelagic production.Shorter water residence time is hypothesized to decrease the pelagic contribution to fish diets indiversion lakes and ultimately decrease fish production. There was some evidence to support thishypothesis, although a more complete synthesis analysis will be conducted after Year 3 of sampling.Estimates for pelagic sources of production to Cutthroat Trout in the lakes and reservoirs rangedfrom 14% at Middle Quinsam Lake to 24% at Snakehead Lake and 8% in Lower CampbellReservoir to 26% in Upper Campbell Reservoir. These estimates for pelagic contributions to dietwere compared to estimates of annual and seasonal water residence time for each lake. Anasymptotic relationship was found with reduced but variable pelagic contribution to diet observedwhen seasonal water residence is less than 25 days.1230-04
JHTMON5 – Year 2 Annual Monitoring ReportPage vGooseneck and Snakehead lakes receive water from the Quinsam River diversion whereas MiddleQuinsam Lake has water diverted upstream of the lake and thus is a donor lake. The originalprediction was that water residence time will be shorter in Gooseneck and Snakehead lakes(receiving lakes) than Middle Quinsam Lake (donor lake), which could result in decreasedzooplankton production. Seasonal water residence time was indeed found to be lower in bothGooseneck (6.1 days) and Snakehead (4.1 days) lakes compared to Middle Quinsam Lake (26.7days). However, the annual residence time at Gooseneck Lake (75.6 days) was estimated to be overthree times longer than the annual residence time at Middle Quinsam Lake (21.1 days). Theestimates of % pelagic production at these lakes do not always follow the predictions of waterresidence time; a greater pelagic source of production (ultimately from plankton) in both Gooseneck(21%) and Snakehead (24%) lakes was observed in Cutthroat Trout diets compared to MiddleQuinsam Lake (14%). Absent from this current analysis, however, is an estimate for the total littoralhabitat in each lake relative to total lake area. For example, Middle Quinsam Lake has a very similarsurface area to Gooseneck Lake but is much shallower and has a greater percentage of its lake areadominated by shoal habitat.We observed a strong negative relationship between lake volume and the δ13C signature ofzooplankton. This suggests that carbon from non-phytoplankton sources increasingly contributes tozooplankton production as lake volume declines, which may further explain some of the variabilityin fish diets across lakes that have short lake water residence time. Therefore, carbon originatingfrom terrestrial sources (e.g., leaf litter) and/or lake macrophytes seems to be relatively moreimportant in smaller lakes. This suggests that declines in pelagic production due to reduction inwater residence times may be buffered in small lakes by large contributions of alternative carbonsources to zooplankton production.In Year 3, a more complete synthesis analysis is planned. A significant goal for Year 3 is to add morelakes into the analysis and to finalize a model between water residence time and pelagic versuslittoral contribution to diet. However, % pelagic production will be modeled as a function of waterresidence time and % littoral habitat in the same model. This will enable predictions of howdifferent water diversion scenarios affect pelagic contributions to fish diets in the diversion lakeswhile controlling for the amount of littoral habitat available.Conclusions and recommendations for Year 3 of the program include the following:1. The following lakes will be sampled in Year 3: Gray Lake, Brewster Lake and WhymperLake. In addition, we propose to sample John Hart Reservoir, although it is necessary toconfirm whether field crews can access the reservoir given the current works that areunderway to replace the generating station.2. Stable isotope analysis of nitrogen and carbon, combined with the use of Bayesian mixingmodels, was used successfully in Year 2 to understand the diets of species or functionalgroups in lake food webs, and ultimately to provide estimates of total littoral and pelagiccontributions to diets of adult Cutthroat Trout, Rainbow Trout and Dolly Varden. These1230-04
JHTMON5 – Year 2 Annual Monitoring ReportPage vimethods will be continued in Year 3 to address the management questions posed in theTOR.3. The amount of littoral habitat in each lake will influence the proportion of fish diets derivedfrom littoral versus pelagic sources. In Year 3, we recommend that the relative area of littoralhabitat in each study lake is estimated. This can then be used as an independent variable inmodels to predict the relative pelagic contributions to fish diets. This desktop exercise willrequire analysis of bathymetry data that have been collected, or will be collected in Year 3(Grey and Whymper lakes). We anticipate that this task can be completed within the scopeof the outstanding water residency time analysis.4. The lake levels of the three reservoirs are monitored continuously by BC Hydro. Werecommend that metrics relating to the frequency and range of water level fluctuations beidentified and compared across the three reservoirs. We propose to integrate this into thescope of the final data analysis tasks.5. We recommend undertaking invertebrate sampling as planned, which will include threeseparate trips to each lake in June, July and August. Minnow traps should be deployed duringeach of these trips with the primary aim of catching Sculpin spp. and reducing effortnecessary in the main fish sampling trip in late August or early September. This trip willinclude gill netting, and we also recommend that trap netting is undertaken with the aim ofsampling Threespine Stickleback, Sculpin spp., and juvenile trout. We do not recommendthat a separate trip is undertaken in June to sample Threespine Stickleback; this wasundertaken in Year 2 and was unsuccessful.6. There is high overlap in the δ13C and δ15N isotope signatures of the three littoral invertebrateprey sources (benthic/littoral, stream and terrestrial invertebrate groups). In Year 3, werecommend that the Bayesian isotope mixing model be simplified to fewer sources byaggregating the three littoral invertebrate prey sources into one prey group.7. As undertaken in Year 2, we recommend that all zooplankton samples collected in Year 3are enumerated so an estimate of zooplankton biomass can be made for each lake. This willinvolve collecting body length measurements for a sub-sample of individuals to estimatemean body mass. This is important because zooplankton biomass provides a direct measureof food availability to fish and we aim to examine relationships between this variable andlake water residence time. We plan to integrate this work into the existing scope of thezooplankton sample analysis. In addition, we recommend that zooplankton sample analysisis undertaken after each sampling trip, rather than at the end of the field season. This willbreak up the work, which will aid scheduling and allow for preliminary analysis of resultsbefore the sampling is completed.1230-04
JHTMON5 – Year 2 Annual Monitoring ReportPage vii8. We recommend that lake water temperature profiles are collected during each zooplanktonsampling trip. This will provide data regarding how the thermocline depth changesthroughout the growing season, which will support the water residency time analysis.1230-04
JHTMON5 – Year 2 Annual Monitoring ReportPage viiiTABLE OF CONTENTSEXECUTIVE SUMMARY . IILIST OF FIGURES . XLIST OF TABLES . XIVLIST OF MAPS. XVII1.INTRODUCTION . 11.1. BACKGROUND TO WATER USE PLANNING . 11.2. BC HYDRO INFRASTRUCTURE, OPERATIONS AND THE MONITORING CONTEXT . 11.2.1. Reservoirs . 11.2.2. Diversion Lakes . 21.3. MANAGEMENT QUESTIONS AND HYPOTHESES . 21.4. SCOPE OF THE JHTMON 5 STUDY . 31.4.1. Overview . 31.4.2. Summary of the Main Method to Test Management Questions . 31.4.3. Sampling in Year 2 . 41.4.4. Water Residence Time. 72.METHODS . 92.1. INVERTEBRATE SAMPLING . 92.1.1. Zooplankton . 92.1.2. Littoral Invertebrates . 142.1.3. Stream Invertebrates . 172.1.4. Terrestrial Invertebrates . 202.2. FISH SAMPLING . 232.2.1. Gill Netting. 232.2.2. Trap Netting . 242.2.3. Minnow Trapping. 262.2.4. Individual Fish Analysis . 282.2.5. Stomach Contents. 302.3. STABLE ISOTOPE DATA . 302.3.1. Stable Isotope Processing . 302.3.2. Assessing Fish Diet Using Mixing Models . 312.3.3. Correlations with Fish Size and Age . 322.4. WATER RESIDENCY ANALYSIS . 322.4.1. General . 322.4.2. Thermocline Depth. 342.4.3. Precipitation and Evaporation . 341230-04
JHTMON5 – Year 2 Annual Monitoring Report2.4.4.3.Page ixInflow Rate . 38RESULTS . 423.1. INVERTEBRATE SAMPLING. 423.1.1. Zooplankton . 423.1.2. Littoral Invertebrates . 473.1.3. Stream Invertebrates . 483.1.4. Terrestrial Invertebrates . 483.2. FISH CATCH . 513.2.1. Gill Netting. 513.2.2. Trap Netting . 523.2.3. Minnow Trapping. 543.2.4. Individual Fish Analysis . 563.2.5. Stomach Contents. 623.3. STABLE ISOTOPE DATA . 623.3.1. Summary of Stable Isotope Signatures by Taxa . 623.3.2. Seasonal Variation in Zooplankton . 673.3.3. Assessing Fish Diet Using Mixing Models . 683.3.4. Diet Variation with Fish Size . 783.4. WATER RESIDENCE TIME . 793.4.1. Data Limitations and Error Analysis. 813.5. ANALYSIS OF MANAGEMENT QUESTIONS . 853.5.1. To what extent do stabilized reservoir levels, as affected by BC hydro operations,benefit fish populations? . 853.5.2. What is the relationship between residence time (as affected by diversion rate) andlake productivity? . 854.CONCLUSIONS . 894.1. RESERVOIR LEVELS AND BENEFITS TO FISH POPULATIONS . 894.2. WATER RESIDENCE TIME AND LAKE PRODUCTIVITY . 905.RECOMMENDATIONS . 92REFERENCES . 94PROJECT MAPS. 991230-04
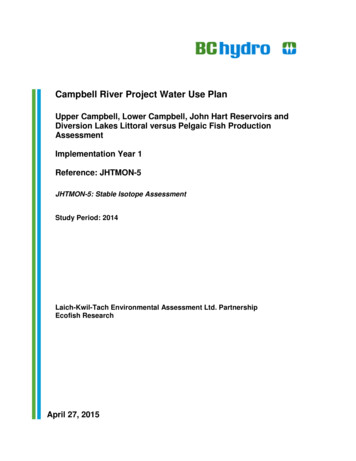
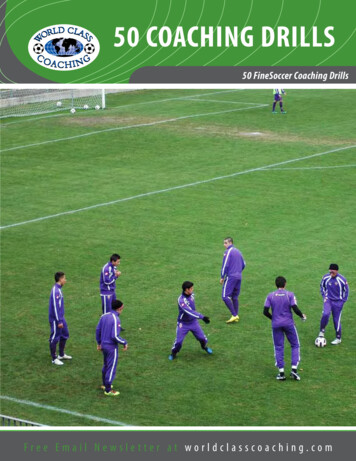
JHTMON5 – Year 2 Annual Monitoring ReportPage xLIST OF FIGURESFigure 1.Conceptual framework for the interpretation of stable isotope analysis (SIA) data whereb) is the pre-treatment state, a) is dominance of a pelagic-derived energy in fish diet, andc) is dominance of littoral-derived energy in fish diet. . 4Figure 2.Hypothetical relationship between lake water residence time and pelagic productivity asindicated by the proportion of pelagic diet in Cutthroat Trout. Each point represents adifferent diversion or control lake with data accumulated over several years of theJHTMON-5 program. . 6Figure 3.Zooplankton net. .10Figure 4.Zooplankton samples prior to adding ethanol. Note high density of captured specimens.10Figure 5.Body lengths of Daphniidae (n 15–20) measured in samples collected from BeavertailLake (BVR), Lower Campbell Lake reservoir (LCR), Snakehead Lake (SNA) and UpperQuinsam Lake (UPQ). Data are presented for samples collected from each lake in June,plus July and September samples for UPQ. Bold horizontal lines denote medians, boxesdenote interquartile ranges and whiskers denote ranges. .14Figure 6.Ponar grab sampling at Lower Campbell Reservoir (site LCR–BIV01).15Figure 7.Littoral habitat sampled using travelling kick and sweep sampling at Beavertail Lake (siteBVR–BIV01; left) and example sample (right). .16Figure 8.Littoral habitat sampled using travelling kick and sweep sampling at Upper QuinsamLake (site UPQ–BIV01). .16Figure 9.Littoral habitat sampled on Snakehead Lake (left), with freshwater mussels (family:Unionidae) collected from lake bed (right). .17Figure 10. Stream invertebrate sampling site at an inflow to Lower Campbell Reservoir (site BVR–SIV01; left) and example sample (right). .18Figure 11. Stream invertebrate sampling site at the outflow of Beavertail Lake (site BVR–SIV01).19Figure 12. Stream invertebrate sampling site at the outflow of Snakehead Lake (site BVR–SIV01).19Figure 13. Stream invertebrate sampling site at an inflow to Upper
Oct 17, 2016 · In Lower Campbell Reservoir, only 8% of Cutthroat Trout diet is estimated to be derived from pelagic sources and 92% is estimated to be derived from littoral sources, while Rainbow Trout have a pelagic contribution to diet of 23% and a littoral contributio