Transcription
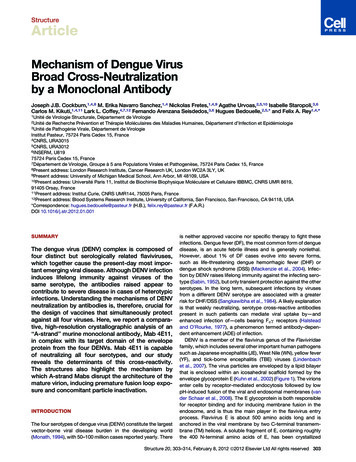
ArticleIRAK-M Expression in Tumor Cells SupportsColorectal Cancer Progression through Reduction ofAntimicrobial Defense and Stabilization of STAT3Graphical AbstractAuthorsRebecca Kesselring,Joachim Glaesner,Andreas Hiergeist, .,Hans-Juergen Schlitt,Edward K. Geissler,Stefan In BriefKesselring et al. show that combined TLRand Wnt activation leads to IRAK-Mexpression in colorectal cancer cells,which is also associated with poor patientprognosis. Tumor cell-intrinsic IRAK-Mregulates antimicrobial response andSTAT3 stability, both promoting tumorprogression.HighlightsdIRAK-M deficiency results in enhanced inflammation butdiminished tumor growthdIRAK-M is induced in colon tumor cells due to combined Wntand TLR activationdIRAK-M in tumor cells stabilizes STAT3 and enhances tumorbarrierdIRAK-M expressed in tumor cells of CRC patients isassociated with poor prognosisKesselring et al., 2016, Cancer Cell 29, 684–696May 9, 2016 ª2016 Elsevier Inc.http://dx.doi.org/10.1016/j.ccell.2016.03.014
Cancer CellArticleIRAK-M Expression in Tumor Cells SupportsColorectal Cancer Progression through Reductionof Antimicrobial Defense and Stabilization of STAT3Rebecca Kesselring,1 Joachim Glaesner,2 Andreas Hiergeist,2 Elisabeth Naschberger,3 Helmut Neumann,4Stefan M. Brunner,1 Anja K. Wege,5 Caroline Seebauer,1 Gudrun Köhl,1 Susanne Merkl,3 Roland S. Croner,3Christina Hackl,1 Michael Stürzl,3 Markus F. Neurath,4 André Gessner,2 Hans-Juergen Schlitt,1 Edward K. Geissler,1and Stefan Fichtner-Feigl1,6,*1Departmentof Surgeryof Microbiology and HygieneUniversity Medical Center Regensburg, Franz-Josef-Strauß-Allee 11, 93053 Regensburg, Germany3Department of Surgery, University Medical Center Erlangen, Schwabachanlage 12, 91054 Erlangen, Germany4Department of Internal Medicine, University Medical Center Erlangen, Ulmenweg 18, 91054 Erlangen, Germany5Clinic of Gynecology and Obstetrics, Caritas Hospital St. Josef, University of Regensburg, 93053 Regensburg, Germany6Regensburg Center for Interventional Immunology, University Medical Center Regensburg, Franz-Josef-Strauß-Allee 11,93053 Regensburg, Germany*Correspondence: ccell.2016.03.0142InstituteSUMMARYColorectal cancer (CRC) is associated with loss of epithelial barrier integrity, which facilitates the interactionof the immunological microenvironment with the luminal microbiome, eliciting tumor-supportive inflammation. An important regulator of intestinal inflammatory responses is IRAK-M, a negative regulator of TLRsignaling. Here we investigate the compartment-specific impact of IRAK-M on colorectal carcinogenesisusing a mouse model. We demonstrate that IRAK-M is expressed in tumor cells due to combined TLR andWnt activation. Tumor cell-intrinsic IRAK-M is responsible for regulation of microbial colonization of tumorsand STAT3 protein stability in tumor cells, leading to tumor cell proliferation. IRAK-M expression in humanCRCs is associated with poor prognosis. These results suggest that IRAK-M may be a potential therapeutictarget for CRC treatment.INTRODUCTIONColorectal carcinoma (CRC) represents the third most prevalentmalignancy and is one of the leading causes of cancer-relateddeaths worldwide. The etiology of CRC is known to be multifactorial and is associated with predisposing mutations, diet, lifestyle, chronic inflammations, and gut microbiota (Balkwill andMantovani, 2001; Gallimore and Godkin, 2013; Goel et al.,2011). Inflammation is a critical player in the development ofboth colitis-associated cancer (CAC) and sporadic CRC, andinfluences all stages of CRC pathogenesis including initiation,progression, and metastasis. Ongoing research has confirmedthat the gut microbiome is an important driver of inflammationand is linked to the pathogenesis of CRC (Arthur and Jobin,2013; Jobin, 2013). The colon harbors more than 36,000 bacterialentities, amounting to more than 100 trillion aerobic and anaerobic bacteria (Ohtani, 2014). In steady state the intestine isin crosstalk with its microbiome, thereby maintaining intestinalhomeostasis. In this regard, Streptococcus bovis/gallolyticus,enterotoxigenic Bacteroides fragilis, and Escherichia coli NC101have been implicated as risk factors for CRC (Arthur et al.,2012; Grivennikov, 2013). However, the precise mechanismsare far from being understood. Disruption of the intestinal homeostasis due to loss of epithelial barrier integrity enables activationSignificanceDespite advances in the diagnosis, surgery, and therapy of colorectal cancer (CRC), only minor improvements have beenachieved in the clinical outcome of CRC patients. Here we show that IRAK-M, an inhibitor of TLR signaling, is expressedin tumor cells and is associated with enhanced tumor cell proliferation. This could be explained through our findings thatIRAK-M supports barrier breach at tumor sites through inhibition of antimicrobially acting proteins and is responsible forSTAT3 stability in tumors. IRAK-M expression in human CRCs is associated with poor prognosis. These results suggestthat IRAK-M may be a potential therapeutic target for the treatment of CRC.684 Cancer Cell 29, 684–696, May 9, 2016 ª2016 Elsevier Inc.
of immune responses through triggering of microbial sensors,namely the pathogen recognition receptors (PRRs) (Pandeyet al., 2014). The sensing of microbial pathogen-associated molecular patterns by PRRs activates signaling pathways involvedin inflammatory responses (Fukata and Arditi, 2013; McDermottand Huffnagle, 2014). These pathways lead to the secretion ofproinflammatory cytokines such as interleukin-1b (IL-1b), IL-6,IL-11, and tumor necrosis factor (TNF) triggering the activationof nuclear factor kB (NF-kB) and STAT3 in intestinal epithelialcells (IECs). Both NF-kB and STAT3 are activated in CRCs,leading to the induction of genes for cell proliferation andsurvival, and are well described to be major players in the pathogenesis of CRCs (Ben-Neriah and Karin, 2011; Bollrath andGreten, 2009; Bollrath et al., 2009). There are extensive studiesdescribing the crucial role of PRRs in CRC pathogenesis, especially Toll-like receptors (TLRs) and nucleotide oligomerizationdomain (NOD)-like receptors and their downstream moleculesMyD88 and RIP2, respectively (Couturier-Maillard et al., 2013;Fukata and Abreu, 2009; Fukata et al., 2011; Rakoff-Nahoumand Medzhitov, 2007; Salcedo et al., 2010). Therefore, it isessential that sensing of microbes through PRRs and their downstream signaling pathways are tightly regulated. Negative regulators of PRR signaling include A20, IRAK-M, SIGIRR, Tollip,SOCS1, and PPARg. It is already described that A20 suppressescolorectal cancerogenesis through restriction of Wnt signalingand that SIGIRR deficiency enhances tumor promotion andprogression through hyperactivation of the NF-kB and STAT3signaling pathways, but less is known about the other inhibitorymolecules for TLR signaling (Shao et al., 2013; Xiao et al., 2007).IRAK-M is a member of the IL-1 receptor-associated kinases(IRAK) family of adaptor molecules (Kobayashi et al., 2002). Incontrast to other IRAK family members, IRAK-M lacks kinaseactivity. IRAK-M blocks the formation of IRAK-1/TRAF6 complexes, preventing dissociation of IRAK-1/IRAK-4 from the TLRreceptor and thereby inhibiting downstream signaling and activation of NF-kB (Shibolet and Podolsky, 2007). In the gut,IRAK-M is described as an important factor for the establishmentof epithelial barrier integrity. Hence, it was shown that theabsence of IRAK-M exacerbates colitis in IL-10-deficient miceas well as in acute dextran sodium sulfate (DSS) colitis by deregulation of proinflammatory cytokines and T helper 1 (Th1)- andTh17-inducing cytokines (Berglund et al., 2010; Biswas et al.,2011). However, less is known about the impact of IRAK-M ontumor pathogenesis. Here, we analyzed the role of IRAK-M inthe development of CRCs.RESULTSIRAK-M Protects against Colitis but Enhances TumorGrowthIt is already described that IRAK-M protects against colitis inIL-10 / mice and in acute DSS colitis (Berglund et al., 2010; Biswas et al., 2011). Therefore, it is reasonable to analyze the impactof IRAK-M on the progression of chronic colitis and CRC. In theazoxymethane (AOM)/DSS model of CAC we observed severesigns of intestinal inflammation in IRAK-M / mice and significant weight loss compared with wild-type (WT) mice (Figures1A and S1A–S1C). Histologically, IRAK-M / mice present asignificant extent of inflammation throughout the mucosa,alterations of epithelial structure, loss of crypts, and enhancedlymphocytic infiltration compared with WT mice (Figure 1B).IRAK-M / mice have a significantly elevated histopathologicalscore (Figure 1C). The enhanced inflammation is accompaniedby dense infiltration of CD45 lymphocytes in the lamina propria(Figures 1D and S1D). Despite an increase in inflammation, weobserved a decreased tumor load in IRAK-M-deficient micecompared with WT mice despite unchanged Wnt activation in tumor cells, as shown by nuclear b-catenin staining and activeb-catenin levels (Figures 1E and 1F). Whereas about 92% ofthe WT mice developed colon tumors, only 57% of IRAK-M /mice developed macroscopic tumors or polyps in the distalcolon. In particular, IRAK-M / mice showed both decreasedtumor numbers and reduced tumor size (Figures 1G–1J). Theaverage tumor number per mouse in WT mice (19 1.7) wasabout three times higher than that in IRAK-M / mice (6 1.5)(Figure 1H). Regarding tumor size, about 61% of the tumors ofWT mice developed into large tumors ( 2 mm diameter) whereasonly 5% of IRAK / tumors developed into large tumors with histological characteristics of adenocarcinoma (Figure 1J). Incontrast, 64% of the IRAK-M / tumors are small tumors( 1 mm diameter) and only 12% of the WT tumors are small (Figure 1J). These results indicate that IRAK-M deficiency not onlydiminishes tumor promotion but also decreases tumor progression. This observed phenomenon seems to be contradictory toprevious studies of CAC in which enhanced inflammation wasassociated with accelerated tumor growth (Balkwill and Mantovani, 2001; Clevers, 2004). To understand this observation, weanalyzed the immunological tumor milieu of IRAK-M-deficientmice in depth. Lamina propria mononuclear cells (LPMCs) ofWT and IRAK-M / mice show increased absolute amountsof CD45 lymphocytes (Figures 1D and S1D). Flow cytometricanalysis revealed that in the late phase the tumor-associatedimmune milieu is not altered in IRAK-M / mice in respect ofpercentage of special subpopulations of LPMC-infiltrating lymphocytes. There are similar relative amounts of T cells, regulatory T (Treg) cells, Th1, and Th17 cells in the lamina propria ofWT and IRAK-M / mice (Figure S1E), and the percentages ofdendritic cells, monocytes, and macrophages are also similar(Figure S1E). Antigen-presenting cells produce the sameamount of the proinflammatory cytokines (Figure S1E). Theanalysis of the chemokine milieu of the inflamed colon ofIRAK-M / and WT mice, however, revealed a strong upregulation of various chemokines such as CCL1, 3, 4, 5, 7 and 22,and the chemokines CXCL1, 2, 3 and 5 in IRAK-M / mice (Figure S1F). The TLR signaling pathway leads to activation of thetranscription factor NF-kB. We analyzed the NF-kB pathway inIRAK-M / and WT mice treated with AOM/DSS. We foundhardly any differences both in the canonical and in the noncanonical NF-kB pathways (Figure S1G). To better assess thecourse of inflammation and understand the underlying inflammatory responses, we performed acute DSS colitis andtime course analysis of chronic DSS colitis as well as AOM/DSS colitis (Figures S1H–S1P). Here it becomes clear thatIRAK-M is mostly involved in the regulation of early and acutephases of inflammation and has a limited regulatory role inlate and chronic phases. In acute DSS colitis, there is completedamage to epithelial structure in acute DSS colitis (FiguresS1H–S1J) with persistently enhanced CD45 cell infiltrates inCancer Cell 29, 684–696, May 9, 2016 685
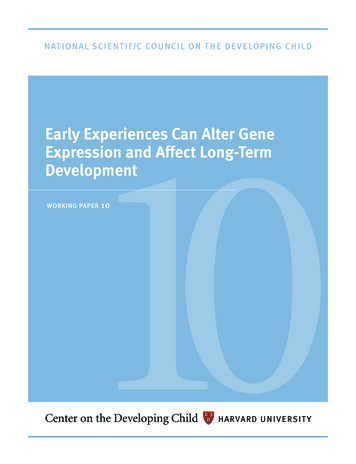
Figure 1. IRAK-M Protects against Colitis but Enhances Tumor Growth(A) Body weight curve of WT and IRAK-M / mice during the course of AOM/DSS colitis. Data are mean SD; n 15.(B) H&E-stained sections of colons from WT and IRAK-M / mice after AOM/DSS colitis (day 63), showing representative inflammation.(C) Histopathological score of WT and IRAK-M / mice analyzed from distal colonic tissue sections at the end of AOM/DSS colitis (day 63). Each dot representsthe histological score of one individual mouse. The horizontal bar represents the mean SD (n 15); p % 0.0001 by t test.(D) Analysis of CD45 infiltrating immune cells in colons of IRAK-M / and WT mice after AOM/DSS colitis (day 63). Each dot represents the number of CD45 cellsin one high-power field imaged from the colon of the specified AOM/DSS-treated mice. The horizontal bar represents the mean SD (n 25); p % 0.01 by t test.(E) Immunohistochemical analysis of b-catenin in colorectal tumors of WT and IRAK-M / mice after treatment with AOM/DSS (day 63).(F) Immunoblot analysis of active b-catenin from whole-cell protein lysates from IECs and tumors of IRAK-M / mice compared with WT mice after AOM/DSScolitis (day 63). GAPDH represents the loading control.(G) Tumor load of WT and IRAK-M / mice after AOM/DSS colitis (day 63). Data points represent the tumor load of one individual mouse. The horizontal barrepresents the mean SD (n 15); p % 0.0001 by t test.(H) Tumor count per mice of WT and IRAK-M / mice after treatment with AOM/DSS. Data represent the number of tumors detected in one individual mouse. Thehorizontal bar represents the mean SD (n 15); p % 0.0001 by t test.(I) Count of small, medium, and large tumors per mouse of WT and IRAK-M / mice after AOM/DSS colitis. Data points represent the tumor load of one individualmouse. The horizontal bar represents the mean SD (n 15); p % 0.05 for small tumors, not significant (n.s.) for medium tumors, and p % 0.0001 for large tumorsby t test.(J) Average of tumor sizes in WT and IRAK-M / mice after treatment with AOM/DSS. Data represent the average tumor size in one individual mouse. Thehorizontal bar represents the mean SD (n 15); p % 0.0001 by t test.Blue scale bar, 100 mm; red scale bar, 200 mm. See also Figure S1.IRAK-M / mice (Figures S1K–S1L). In late phases the inflammation in IRAK-M / mice remains constant, whereas theinflammation in WT mice still increases accompanied byenhanced CD45 lymphocyte infiltration, and the infiltration oflymphocytes in IRAK-M / colon remains constant after theacute phase of colitis (Figures S1M–S1P). In studies of immunecell activation, we found major differences in the acute phase ofcolitis but only minor differences in the chronic phase (Figure S1Q). In summary, we have shown that despite exacerbated colitis in IRAK-M / mice, there have to be protectivemechanisms that inhibit the inflammation-induced colorectalcarcinogenesis that is normally observed in an inflamed tumormicroenvironment.686 Cancer Cell 29, 684–696, May 9, 2016Epithelial IRAK-M Is Necessary for Sustained ColorectalCancerogenesis, whereas Hematopoietic IRAK-M SlowsDown Inflammation-Associated Cancer ProgressionAs reduced tumorigenesis in IRAK-M-deficient mice in a milieuof severe inflammation at first sight seems to be contradictoryto the hypothesis that inflammation fuels tumorigenesis, weinvestigated whether the observed decelerated tumor progression is solely an immune cell-associated effect. Therefore, wegenerated bone marrow (BM) chimera of IRAK-M / mice. Weincluded four different groups; IRAK-M / mice that receivedWT BM (WT BM IRAK-M / ), WT mice that receivedIRAK-M / BM (IRAK-M / BM WT), and two control groupsof IRAK-M / mice that received IRAK-M / BM (IRAK /
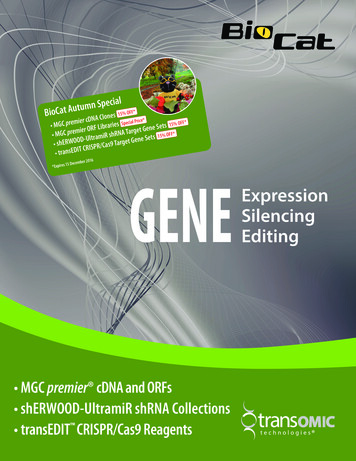
Figure 2. Epithelial IRAK-M Is Necessary for Sustained Colorectal Cancerogenesis whereas Hematopoietic IRAK-M Slows Down Inflammation-Associated Cancer Progression(A) Body weight curve of BM chimera of WT BM WT, IRAK-M / BM IRAK-M / , IRAK-M / BM WT, and WT BM IRAK-M / mice during the course ofAOM/DSS colitis. Data are mea mean SD; n 8.(B) Histopathological score of BM chimera of WT BM WT, IRAK-M / BM IRAK-M / , IRAK-M / BM WT, and WT BM IRAK-M / mice after AOM/DSScolitis (day 63). Each dot represents the histological score of one individual mice. The horizontal bar represents the mean SD (n 8); p % 0.0001 by t test.(C) Analysis of CD45 infiltrating immune cells in colons from BM chimera of WT BM WT, IRAK-M / BM IRAK-M / , IRAK-M / BM WT, and WTBM IRAK-M / mice after AOM/DSS colitis (day 63). Each dot represents the number of CD45 cells in one high-power field imaged from the colon of thespecified AOM/DSS-treated mice. The horizontal bar represents the mean SD (n 25); p % 0.01 by t test.(D) H&E-stained sections of colons from BM chimera of WT BM WT, IRAK-M / BM IRAK-M / , IRAK-M / BM WT, and WT BM IRAK-M / mice afterAOM/DSS colitis (day 63), showing representative inflammation.(E) Tumor load of BM chimera of WT BM WT, IRAK-M / BM IRAK-M / , IRAK-M / BM WT, and WT BM IRAK-M / mice after AOM/DSS colitis (day 63).Data points represent the tumor load of one individual mouse. The horizontal bar represents the mean SD (n 8); p % 0.0001 by t test.(F) Immunohistochemical analysis of IRAK-M in colorectal tumors of Tp53DIEC mice 16 weeks after the first of six weekly AOM injections (lower panel) and WT micetreated with AOM/DSS (day 63) (upper panel).(G) Immunoblot analysis for IRAK-M in lysates from IECs and tumors of WT and IRAK-M / mice after AOM/DSS treatment (day 63). b-Actin represents theloading control.(H) Immunoblot analysis for IRAK-M in lysates from native and AOM/DSS-treated IECs, AOM/DSS-treated LPMCs, and different sizes of tumors (small, medium,large) of WT mice after AOM/DSS treatment (day 63). b-Actin represents the loading control.Green scale bar, 50 mm; blue scale bar, 100 mm; red scale bar, 200 mm. See also Figure S2.BM IRAK-M / ) and WT mice that received WT BM (WT BM WT). During chronic colitis, mice that received IRAK-M / BMshowed more severe weight loss and increased histology scorethan mice with WT BM (Figures 2A, 2B, and S2A–S2C). Further,IRAK-M deficiency in the irradiation-insensitive compartmenthardly had any impact on the extent of inflammation, as depictedby the weight curves and histology score (Figures 2A and 2B).H&E staining also showed severe inflammation in mice withIRAK-M-deficient BM with elevated levels of CD45 lymphocytic infiltrations (Figures 2C and 2D) and a high percentage ofmucosal damage represented by a high histopathological score(Figure 2B). Regarding tumorigenesis, mice with an IRAK-Mdeficient, irradiation-insensitive compartment showed reducedtumor load compared with the WT control group (Figure 2E),whereas a deficiency of IRAK-M in the BM led to an enhancedtumor progression (Figure 2E). Mice deficient for IRAK-M in theirradiation-insensitive compartment showed smaller tumor sizeand diminished tumor incidence compared with mice with aWT epithelial compartment (Figures S2D–S2F). b-Catenin staining revealed a shift of catenin expression from the membrane toward cytoplasmic and nuclear localization in tumor regions in allfour groups, indicating no obvious difference in tumor formationbetween WT and IRAK-M / mice (Figure S2G). As these resultssuggest that IRAK-M is able to exert an epithelial cell-intrinsiceffect in the irradiation-insensitive compartment, we analyzedIRAK-M expression in different CRC models (AOM/DSS andCancer Cell 29, 684–696, May 9, 2016 687
Tp53DIEC models) and in human CRC cell lines. We demonstrated that IRAK-M is expressed in tumor cells of CRC in bothmouse models and in a diverse set of well-established CRCcell lines (Figures 2F–2G, S2H, and S2I). Untransformed/nontumorous IECs did not express IRAK-M in the AOM/DSS andTp53DIEC models (Figures 2G and S2H). Deeper analysis ofIRAK-M expression in the gastrointestinal tract revealed thatneither native IEC- nor DSS-treated IECs show IRAK-M expression (Figure 2H) whereas LPMCs, most likely macrophages,show positive IRAK-M staining (Figure 2H). Comparison ofdifferent tumor sizes revealed that IRAK-M is expressed to arather similar degree irrespective of tumor size (Figure 2H). Toconfirm that IRAK-M is expressed specifically in tumor cells ofCRCs, we performed co-staining analysis of colonic tissue ofthe different cell types present in the colon (fibroblasts, lymphocytes, tumor cells, and endothelial cells) in WT mice (FiguresS2J–S2M). IRAK-M is expressed neither in endothelial cells norfibroblasts but is expressed in tumor cells and partially infiltratinglymphocytes (Figures S2J–S2M).IRAK-M Is Induced in Epithelial Cells through CombinedTLR2/4 and Wnt Activation and Is per se Associated withAltered Fecal Gut Microbiota Composition and BacterialDiversityThe specific expression of IRAK-M in tumor cells but not in untransformed/non-tumorous IECs raises the question as to howIRAK-M is induced in tumor cells. As IRAK-M is known to beinvolved in TLR signaling, we hypothesized that TLR activationis involved in IRAK-M induction. Additionally, we hypothesizedthat the activation of the Wnt pathway might be involved in theinduction of IRAK-M expression, as its aberrant activationpattern is a prominent difference between tumor cells and untransformed IECs. To verify this hypothesis, we stimulated themurine and human IEC cell lines muIntepi and HCoEpiC withdifferent TLR ligands (TLRs 1–9) and with the Wnt agonist I,and analyzed for IRAK-M expression by western blotting.Indeed, we found an upregulation of IRAK-M protein expressionunder simultaneous TLR4 and Wnt activation and under TLR2and Wnt activation (Figures 3A, S3A, and S3B). Additionally,we demonstrated that intrarectal administration of Wnt withTLR2 or TLR4 agonist also induced IRAK-M expression in IECsin vivo (Figure 3A). In mice with loss of TLR signaling (MyD88 / )we saw a slight decrease in IRAK-M induction (Figure S3C).We then analyzed whether this close interaction was associated with changes in the composition of the intestinal microbiome of IRAK-M / mice compared with WT mice. In feces ofIRAK-M / mice, the total bacterial content was approximately8-fold lower than in WT mice as reflected by the amount of16S-rDNA gene copies (Figure 3B). In addition, estimating thespecies richness of the microbiome in feces samples we detected a more diverse composition of bacteria in WT micecompared with IRAK-M / mice (Figure 3B). When analyzingthe data obtained from the deep 16S-rRNA sequencing on ataxonomical level, some striking differences were identified.Thus, some bacterial taxa (Roseburia, Blautia, Parasutterella)were found to be markedly less abundant or nearly absentin IRAK-M / feces, whereas others were more abundant(Turicibacter and further undefined members of the Erysipelotrichaceae family) (Figure 3C). Similar differences regarding these688 Cancer Cell 29, 684–696, May 9, 2016bacterial taxa could also be observed in a replicate experimentwhich additionally included colonic and tumor tissue of therespective mice (Figures S3E–S3H). In these colon and tumortissues differences in the species richness between the twogroups similar to those in luminal microbiota were observed(Figure S3H). Assessing the diversity of the fecal microbiota between IRAK-M / and WT mice by a principal coordinates analysis, we found that all samples derived from IRAK-M / miceclustered apart from those of WT controls (Figure 3D), althoughwe revealed less overall microbial content in IRAK-M / micewith less diversity and fewer changes in taxa distribution.To analyze whether the reduced bacterial content as shown inFigures 3E and S3E–S3H in IRAK-M / mice is a consequence ofa more intact epithelial barrier or of enhanced antibacterialresponses, we analyzed antibacterial responses and intestinalpermeability separately from non-tumorous epithelium and tumor sites, comparing WT and IRAK-M / mice. This is of particular importance, as the local barrier function at tumor sitesfuels tumorigenesis, as shown by Grivennikov et al. (2012) andSchwitalla et al. (2013). Regarding non-tumorous epithelium,we demonstrated that intestinal permeability is increased inIRAK-M / mice as indicated by fluorescein isothiocyanatedextran measurements (Figure S3J). Furthermore, the numberof translocated bacteria was increased in mesenteric lymph nodes of IRAK-M / mice (Figure S3N). We evaluated the mucuslayer thickness on the colonic epithelium and observed adecreased thickness of this layer in IRAK-M / mice (FiguresS3L and S3M). Periodic acid-Schiff staining revealed no differences in the number of goblet cells in the colon of WT andIRAK-M / mice (Figure S3D). Finally, evaluation of tight junction protein expression showed reduced ZO-1 expression inIRAK-M / IECs but no difference in the tight junction architecture in tumors (Figures S3I and S3K). In contrast to inflamedcolonic epithelium, at tumor sites we found highly increasedMucin2 deposition and enhanced expression of the antibacterialpeptides Galectin 8 and Cathelicidin in tumors from IRAK-M /mice (Figure 3E and 3F). In conclusion, we found a barrier breachin the inflamed intestine of IRAK-M / mice on various levels. Attumor sites of IRAK-M / mice we found highly increased antibacterial response and barrier function, suggesting that luminalbacteria cannot translocate into IRAK-M / tumors.The Exaggerated Colitis of IRAK-M–/– Mice IsTransmissible through the IRAK-M–/– Microbiota,whereas Tumorigenesis in IRAK-M–/– Mice IsIndependent of the Present MicrobiotaThe verified differences in the microbiota of IRAK-M / mice incombination with alterations in antibacterial responses in tumorsof IRAK-M / mice led us to ask whether bacterial dysbiosis isthe basis for the exacerbated colitis and reduced tumorigenesisin IRAK-M / mice or is merely a consequence of the underlyingdisorder. Therefore, we performed co-housing experiments withIRAK-M-deficient and WT mice to study the alterations in inflammation and tumor growth in the AOM/DSS model dependingon the quantity and quality of the different microbiota. Wecompared four different groups of WT mice that were co-housedwith IRAK-M / mice (IRAK-M / MB WT), IRAK-M / micethat were co-housed with WT mice (WT MB IRAK-M / ), andsingle-housed IRAK-M / mice (IRAK-M / MB IRAK-M / )
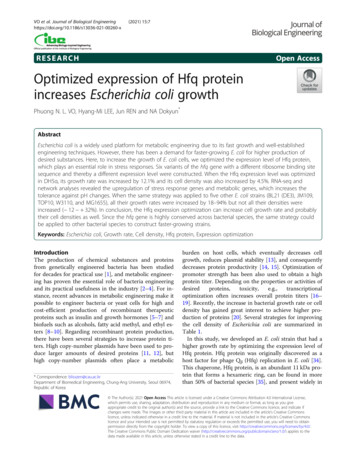
Figure 3. IRAK-M Is Induced in Epithelial Cells through Combined TLR2/4 and Wnt Activation and Is per se Associated with Altered Fecal GutMicrobiota Composition and Bacterial Diversity(A) Upper panel: immunoblot analysis for IRAK-M in lysates from the IEC lineage muIntepi stimulated with different TLR ligands (LPS, Pam3CSK4) Wntactivation. b-Actin represents the loading control. Lower panel: immunoblot analysis for IRAK-M in lysates from IECs isolated from mice intrarectally treated withdifferent TLR ligands (LPS, Pam3CSK4) Wnt activation. b-Actin represents the loading control.(B) Total eubacterial 16S-rDNA copies per gram of feces as measured by qPCR and Chao1 richness estimation in IRAK-M / (n 5) and WT (n 5) mice.The individual points that are plotted as open circles beyond the whiskers represent values deviating from the box by more than 1.2-fold interquartile range.Differences were tested for significance using the Kruskal-Wallis rank-sum test.(C) Differential abundance of selected bacterial taxa in stool samples of IRAK-M / (n 5) and WT (n 5) mice. The individual points that are plotted as opencircles beyond the whiskers represent values deviating from the box by more than 1.2-fold interquartile range. Differences were tested for significance using theKruskal-Wallis rank-sum test (p % 0.05).(D) Analysis of beta diversity between stool samples of IRAK-M / (red circles) and WT (blue squares) tumors of AOM/DSS-treated mice (day 63) by principalcoordinates analysis (PCoA) of unweighted UniFrac distances.(E) Fluorescence in situ hybridization analysis using a Cy3-labeled universal eubacteria probe (EUB 338) of WT and IRAK-M / tumors (upper panel) andimmunofluorescence analysis of Mucin2 (lower panel) in tumors of WT and IRAK-M / mice at day 63 of AOM/DSS colitis. Scale bar, 50 mm.(F) Immunoblot analysis for different antimicrobial acting proteins (Mucin2, Cathelicidin, and Galectin 8) in lysates from IECs and tumors of WT and IRAK-M /mice after AOM/DSS treatment (day 63). b-Actin represents the loading control.(G) Histopathological score of single-housed WT and IRAK-M / mice (WT MB WT, IRAK-M / MB IRAK-M / ) and co-housed WT and IRAK-M / (WT MB IRAK-M / , IRAK-M / MB WT) mice. Each dot represents the histological score of one individual mouse analyzed after AOM/DSS colitis (day 63). Thehorizontal bar represents the mean SEM (n 10); p % 0.01 by t test.(H) Tumor load of single-housed WT and IRAK-M / mice (WT MB WT, IRAK-M / MB IRAK-M / ) and co-housed WT and IRAK-M / (WT MB IRAK-M / ,IRAK-M / MB WT) mice after AOM/DSS colitis (day 63). Data points represent the tumor load of one individual mouse. The horizontal bar represents themean SEM (n 10); p % 0.0001 by t test.See also Figure S3.and single-housed WT mice (WT MB WT). Mice that were confronted with microbiota from IRAK-M / mice showed moreintestinal inflammation than mice only confronted with WT microbiota, as unveiled by a greater loss of body weight and a higherhistological score (Figures 3G and S3O–S3S). Despite these differences in induction of an inflammatory response, co-housingof WT and IRAK-M / mice has no influence on tumor growthin IRAK-M / mice, whereas tumorigenesis in WT mice confronted with IRAK-M / microbiota is enhanced through theincreased inflammation (Figures 3H and S3T–S3V). b-Cateninstaining showed no altered nuclear expression patterns betweenthe four groups (Figure S3W). Therefore, we conclude that thecolitis of IRAK-M / mice is t
IRAK-M / and WT mice treated with AOM/DSS. We found hardly any differences both in the canonical and in the non-canonical NF-kB pathways (Figure S1G). To better assess the course of inflammation and understand the underlying in-flammatory responses, we performed acute DSS colitis and time course analysi