Transcription
Original ArticleCirculating Tumor Cells Detection in Patients with Early Breast Cancer Using MACSImmunomagnetic Flow CytometryNasrin Karimi, Mana Oloomi , and Zahra OrafaDepartment of Molecular Biology, Pasteur Institute of Iran, Tehran, Iran* Corresponding author:Mana Oloomi, Ph.D.,Department of MolecularBiology, Pasteur Institute of Iran,Tehran, IranTel: 98 21 66953311Fax: 98 21 66465132E-mail:manaoloomi@yahoo.comReceived: 13 Nov 2019Accepted: 15 Feb 2020AbstractBackground: Circulating Tumor Cells (CTCs) detection in peripheral blood of epithelial cancer patients is an indicator of the presence of primary tumors and metastasis.The CTC phenotype detection uses epithelial markers in defining, detecting, andisolating CTCs. Circulating cell-separation technologies, with the epithelial origin, canbe identified by epithelial biomarkers, with different techniques such as flow cytometry. The purpose of this study was to evaluate the expression of molecular Cytokeratins (CKs), CK7, CK8, CK18, CK19 (Pan-CK) and Epithelial Cell Adhesion Molecule(EpCAM) markers for CTC detection.Methods: The Magnetic Activated Cell Sorting (MACS) was used to identify CTCs inthe blood of patients. Specific antibodies to EpCAM and Pan-CK were used andanalyzed by flow cytometry. In this study, 35 blood samples of patients with breastcancer were assessed before any treatment and 35 healthy blood samples as thecontrol were evaluated.Results: Expression of CK markers in the peripheral blood of breast cancer patientswas statistically significant with p 0.05, specifically at stages II-IV, but it was not significant in patients at stage I and healthy controls. Biomarkers expression in the bloodof patients and healthy controls was assessed along with the pathologic characteristicsof patients.Conclusion: CTC assessment by flow cytometry in patients with breast cancer couldnot only be used for detection but also can be considered as a source of specific andsubjective evaluation for monitoring the therapy. Besides, the sensitivity and specificity of CTC detection were shown that could be enhanced by specific CK markers.Avicenna J Med Biotech 2020; 12(3): 148-156Keywords: Circulating tumor cells, Cytokeratins, EpCAM, Epithelial cell adhesion molecule,Flow cytometryIntroductionBreast cancer is the oldest diagnosed cancer 1, whichis more seen in women and is the most common deadlycancer 2,3. It is considered the second cause of cancerdeath in women after lung cancer in Iran 4. Accordingto national reports of cancer cases, breast cancer is thefirst universal kind of cancer among Iranian womenand accounts for 16% of all cancers 3. The currenttreatments of breast cancer include the surgery andchemotherapy, and there is the possibility of diseaserecurrence in most of the cases due to the presence ofCirculating Tumor Cells (CTCs) 5. CTCs are tumorcells which can be detected in the blood of patientswith different types of early to advance breast cancer.It is very heterogeneous with significant clinical implycations. In breast cancer, these cells are a rare population of cells in the blood and have an essential role inthe early diagnosis of cancer development. Firstly,148148Thomas Ashworth diagnosed these cells in 1867 6. Asit is mentioned, CTCs are highly heterogeneous withcritical molecular properties 7. It seems that they aretrapped in organs in the first few minutes of enteringthe blood, and their presence in the blood is very short8. Breast cancer is among the diseases with epithelialorigins, and its specific tumor markers express on theseepithelial cells 5. There are few studies conducted onthe diagnosis of CTC at the early stages of breast cancer 9. Recently, assessment of CTCs has been shownfor early detection of metastatic breast cancer and monitoring of treatment response in breast cancer 10. CTCscontain prognostic information in metastatic breastcancer patients 11.Different markers are used to diagnose the CTC, including the epithelial markers such as Cytokeratins(CKs), and also the Epithelial Cell Adhesion MoleculeCopyright 2020, Avicenna Journal of Medical Biotechnology. All rights reserved.Vol. 12, No. 3, July-September 2020
Karimi N, et al(EpCAM) 12. CKs are the large protein structures inepithelial cells from the family of intermediate filaments 13. More than 20 different types of CKs including CK8, CK18, and CK19 as the most abundant CKsof epithelial cells are involved in cancers such asbreast, prostate, lung, and colon cancer 14. Several research groups have reported that CK8 and CK18 havea simultaneous expression in a variety of tumors 15.CK18 with CK8 also express in a variety of other epithelial organs such as the liver, lung, kidney, pancreas,gastrointestinal tract, breast, milk glands, and even thecancers which are induced by these tissues 16. CK19has the highest frequency and is useful in the diagnosisof CTCs and a variety of epithelial-derived diseases 17.Furthermore, this marker was successfully used as avery sensitive and superior marker for early diagnosisand development of breast cancer in tumor cells inbone marrow, axillary lymph nodes, and peripheralblood 18. CK8 marker can be used along with CK7,CK18, and CK19 markers to detect CTCs 16. EpCAMis another epithelial marker for diagnosis. It is a transmembrane glycoprotein19 which expresses in a varietyof epithelial cancers such as breast, stomach, prostate,and esophagus 20. This marker has high expression inprimary and metastatic breast cancer about 100 to 1000times higher than the healthy mammary breast cells.Like the CK7, CK8, CK18, and CK19, EpCAM is alsoused for diagnosis of CTCs 21. CTCs are known forearly detection of potential metastasis, determining andmonitoring the efficacy of individualized treatmentregimens.Also, immunomagnetic flow cytometry is considered as one of the essential methods for CTCs diagnosis. In this way, the enrichment process is usually oneof the prerequisites for any diagnosis and separationprotocol. CTC is diagnosed during two stages in thistechnique; the CTCs enrichment is the first stage, andthe CTC diagnosis is the second stage 22. The enrichment stage includes the interaction of target cells withconjugated antibodies to immunomagnetic granules.There are several enrichment methods for CTCs, suchas separation with immunomagnetic pellets based ondensity, centrifugation, and size. Each enrichmentmethod has positive and negative selection processes22,23. A group of markers are used for the diagnosis ofenriched CTCs, and ultimately, the tumor cells wereexamined by flow cytometry 6. In this study, immunomagnetic flow cytometry with CK7, CK8, CK18,and CK19 (Pan-C) antibodies and EpCAM microbeadswere used to detect CTCs in breast cancer and theywere compared with flow cytometry. Finally, specificity and sensitivity of two methods by CK19 flow cytometry and immunomagnetic separation was alsoevaluated for CTCs detection in the blood.Materials and MethodsPatients referred to Milad Hospital were selected ina non-randomized study after diagnosis before anytreatment. The cohort included 35 patients and 35healthy women. The healthy subjects voluntarily participated in this study after medical examination. Agematched female patients and healthy subjects were inthe same age groups, between 22 and 74 years. Theinclusion criteria were as follows; patients with breastcancer diagnosis before onset of the treatment processwere selected and the written informed consent wasobtained. Exclusion criterion was the secondary primary malignancy. The informed consent was obtainedfrom all patients for using their blood samples. Thesamples were collected using protocols approved bythe review board. The samples were transferred to thePasteur Institute of Iran and used in this study. Thisstudy was approved by the National Ethical Committeeof the Pasteur Institute of Iran (Ethical approval No.4552). All methods were performed in accordance withthe relevant guidelines and regulations based on ethicscommittee.Breast cancer diagnosed patients were at I-IV stagesof the disease. The completed questionnaires containedinformation on patient's age, marital status, family history of cancer, and then peripheral blood was takenfrom healthy cases and patients.Blood sample preparationFirst, 5 ml of blood was collected from patients andhealthy samples. Human white blood cells were isolated from adult peripheral blood using RBC lysis bufferMagnetic Activated Cell Sorting (MACS). Briefly, 1ml blood and 5 ml RBC lysis buffer were mixed withvortex and kept on ice for 15 min, then were centrifuged (1500 rpm for 10 min). Cells were suspended in5 ml RBC lysis buffer and centrifuged followed bytwice washing with Phosphate-Buffered Saline (PBS).Cell cultureHuman breast (T47D) and cervical (HeLa) cancercell line were obtained from the cell bank of PasteurInstitute of Iran. Human cervical (HeLa) cancer cellline was used as a negative breast cancer control. Briefly, cell lines were cultured in RPMI 1640 (Gibco) supplemented with 10% fetal bovine serum (FBS) (Gibco,Invitrogen) and 700 µl penicillin-streptomycin (Biosera). Cells were kept at 37 C in a humidified CO2incubator (5% CO2). Then, cell lines grown in monolayer were harvested by washing the plates once withPBS, pH 7.3, and then the cells were incubated withtrypsin/EDTA (Biosera) for 2-5 min at 37 C. Finally,cells were counted using hemocytometer.Flow cytometryIn this study, blood cells were fixed with 4% paraformaldehyde (Merck) in PBS 1 for 20 min at roomtemperature. Then, cells were washed twice with 1%PBS/FBS and were permeabilized with ice-cold 100%methanol (Merck) for 30 min at 4 C. Then, cells werewashed twice with 1% PBS/FBS and were blocked andfixed with 1% Bovine Serum Albumin (BSA) for 45min at room temperature. Then, cells were stained withAvicenna Journal of Medical Biotechnology, Vol. 12, No. 3, July-September 2020149
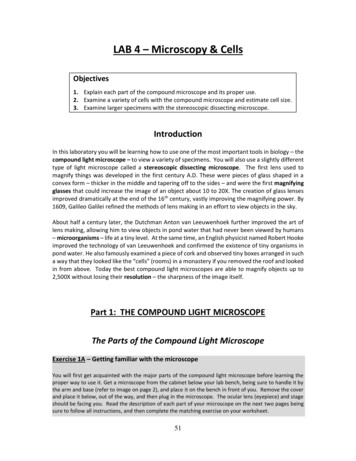
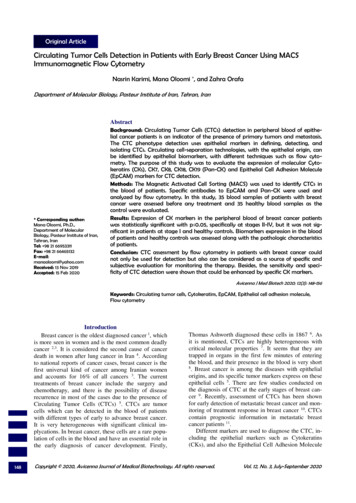
Circulating Tumor Cells Detectionthe FITC-conjugated mouse anti-human CK19 antibody (Abcam, diluted 1:300 in PBS 1 ) or FITCmouse IgG2a isotype antibody (Abcam, diluted 1:300in PBS 1 ) as a negative control and incubated for 1 hrat room temperature. After twice washing with 1%PBS/FBS, detection of bound antibodies was determined by flow cytometry (Cyflow), and the resultswere analyzed with the following program.Immunomagnetic flow cytometryBlood sample (1 ml) was added to 5 ml of RBC lysisbuffer. The sample was suspended and incubated onice for 10 min. Next, 6 ml of PBS 1 was added to thesample, and then centrifuged (1500 rpm for 10 min).Then, 1 ml of PBS 1X was added to the pellet sampleand centrifuged (1500 rpm at 4 C in 10 min). Afterward, the supernatant was discarded and MACS cellseparation kit (Miltenyi Biotec GmbH, Bergisch Gladbach, Germany), or magnetic activated cell sortingcaptured cells by labeling with immunomagnetic microbeads. Permeabilization and fixation step was doneby a membrane or intracellular staining. Magneticbeads were linked to anti-epithelial antibodies for positive selection through EpCAM. The procedure wasapplied according to the manufacturer's instructions.AutoMACS rinsing buffer (1 ml) was added to thesample and centrifuged (1500 rpm at 20 C for 10 min).The supernatant was discarded and then 300 µl of autoMACS rinsing buffer and 50 ml of blocking reagentwere added. EpCAM MicroBeads (MACS) (50 ml)were added, so the cells were enriched with EpCAMmicrobeads, and then the sample was incubated at 48 C for 30 min. Columns were placed on MiniMACSseparation, and then Macs Column was washed with500 ml of autoMACS rinsing buffer. The sample withEpCAM microbeads was transferred to Macs Column,and 1 ml of rinsing buffer from autoMACS was added.AutoMACS (500 ml) rinsing buffer was added to MacsColumn, and then MiniMACS was separated fromMacs Column, and its solution was discarded. Insidefix buffer (500 µl) was added to the sample and incubated at room temperature for 20 min. The inside perm(500 µl) and 50 µl of anti-cytokeratin (Pan-CK) antibody were mixed and incubated at room temperaturefor 10 min. Then, 50 µl of Anti-IgG conjugate PE(Phycoerythrin) was added to the sample and incubatedat room temperature for 20 min. Then, flow cytometryanalysis was done by control samples with no anticytokeratin. EpCAM microbeads were also consideredas the negative control in this experiment.Sensitivity and specificity of two methodsSensitivity of medical diagnosis test is the ability ofa test to correctly identify those with positive rate,whereas specificity is the ability of the test to identifythose without the disease, with correctly negative rate.T47D cells were serially diluted with human peripheralblood leukocytes and stained with the CK19 biomarker. A total of 70 blood samples, including 35150150healthy and 35 patients with breast cancer, were testedby flow cytometry to quantify the CK19 expression forspecificity. Briefly, 1 ml of blood and 5 ml of RBClysis buffer were mixed and kept on ice for 15 min.Subsequently, the cells were fixed with 4% paraformaldehyde for 20 min at room temperature. They werepermeabilized with methanol for 30 min on ice. Then,the cells were incubated with FITC conjugated CK19antibody or FITC-mouse IgG2a isotype antibody as thenegative control for sensitivity.In a ROC curve, the true positive rate (sensitivity) isplotted in function of the false positive rate (specificity) for different cut-off points of these two parameters.The area under the ROC curve was measured to seehow well a parameter can distinguish between two diagnostic groups (Diseased versus normal).Statistical analysisChi-square test was used to analyze biomarkers expression in peripheral blood of patients before clinicaltreatment. Pearson chi-square was performed to compare biomarkers expression level in peripheral bloodbetween patients at stages I-IV. p-values of less than0.05 were considered statistically significant.ResultsPatient characteristicsThe characteristics of 35 patients enrolled in thisstudy are listed in table 1. The age range of patientswas from 22 to74 years old, and the median age was 50years old (Table 1). There were 33 patients with noevidence of metastasis and two patients with metastaticbreast cancer.Clinical assessment was based on histological reports at different stages. Our study population contained patients at different stages. Breast cancer staging(I-IV) was classified according to the standard criteriabased on data of TNM (Tumor, Nodes and Metastases)and American Joint Committee on Cancer Staging System (AJCC). The tumors were histologically gradedaccording to the modified Bloom-Richardson gradingsystem. Clinically classified information concerningage, diagnosis and clinical pathology of breast cancerpatients is shown in table 1.Flow cytometrySamples were stained with FITC-conjugated mouseanti-human CK19 (Abcam) and FITC-mouse IgG2aisotype antibody (Abcam) as a negative control by flowcytometry (Figure 1). Healthy subjects and patients atstage I, stage II, stage III, and stage IV were detected.Twenty patients (57.14%) were found to haveCK19 cells in peripheral blood, 12 samples wereCK19 positive at stage II, five samples at stage III andtwo samples with breast cancer at stage IV but CK19was not detected in patients at stage I and healthy controls by flow cytometry. In this study, magnetic flowcytometry showed CTC with Pan-CK markers expression. Firstly, immunomagnetic flow cytometry was uti-Avicenna Journal of Medical Biotechnology, Vol. 12, No. 3, July-September 2020
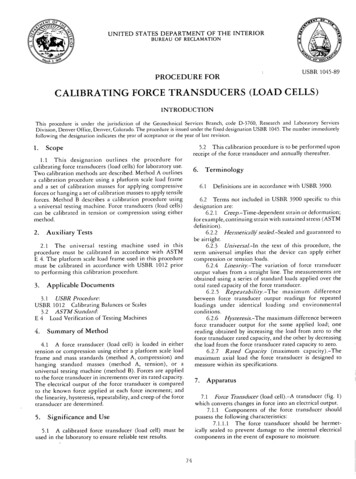
Karimi N, et alTable 1. Pathological characteristic of patientsTumor size 1 cm1–2 cm 2 cmClinical stageIIIIIIIVClinical gradeG1G2G3NDLymph nodeN0N1N2N3NXHistologyInvasive ductal carcinomaInvasive lobular carcinomaOther types of breast cancerAge 50 years 50 yearsMolecular PositiveNegativeNDHer 2PositiveNegativeNDKi 67PositiveNegativeNDDistant metastasisMetastasisWithout metastasisNumber (%)7 (20)23 (65.7)5 (14.3)4 (11.43)22 (62.85)6 (17.15)3 (8.57)3 (8.57)17 (48.57)11 (31.43)4 (11.43)14 (40)16 (45.71)1 (2.86)1 (2.86)3 (8.57)31 (88.58)2 (5.71)2 (5.71)18 (51.42)17 (48.58)20 (57.14)8 (22.86)7 (20)18 (51.43)10 (28.57)7 (20)11 (31.43)14 (40)10 (28.57)12 (34.3)16 (45.7)7 (20)21 (60)2 (5.7)12 (34.3)2 (5.7)33 (94.3)Figure 1. Flow cytometry diagrams of blood cells (%) stainedwith the FITC-conjugated mouse anti-human CK19 antibody(Abcam) or FITC-mouse IgG2a isotype antibody (Abcam) asthe negative control, in (A) healthy subjects (0%), and patientsat (B) stage I (0%), (C) stage II (1.8%), (D) stage III (6.79%),and (E) stage IV(18.37%).magnetic flow cytometry. Flow cytometry analysisshowed histograms and dot diagram. In this method,also biomarkers in Pan-CK were not expressed inhealthy blood samples and patient’s blood samples atstage I of disease (Figures 2A and B). The expressionof these biomarkers was also evaluated in blood samples at different stages of disease (Figures 2C and D).The CK19 gene expression was statistically significant(p 0.037) in flow cytometry. By immunomagneticflow cytometry, CTC detection was statistically significant (p 0.001). In table 2, CTCs detection at differentstages was compared in two flow cytometry by CK19and Pan-CK antibody.The specificity and sensitivity of flow cytometryNot defined (ND).lized by EpCAM magnetic beads, and secondly, CK7,CK8, CK18, and CK19 (Pan-CK) biomarkers wereused for CTC detection. The positive and negativesamples were determined, and the results are presentedin table 2. CTC in peripheral blood of 14 patients(40%) was detected; six samples were CTC positive atstage II, six samples at stage III and two samples withbreast cancer at stage IV while CTC was not detectedin patients at stage I and healthy controls by immuno-Flow cytometric analysis indicated that humanbreast cancer cell line (T47D) expressed the high levelof CK19 biomarker (Figure 3). However, healthy peripheral white blood cells had no CK19 expression(Figure 3).Sensitivity: T47D cells (1.5 106) were mixed withhealthy white blood cells at different ratios of 1:1,1:10, 1:102, 1:103, and 1:104 to determine the sensitivity of flow cytometry. CK19 cells were detected byflow cytometry, and they were consistent with the ratios of T47D and white blood cells. It was demonstratedAvicenna Journal of Medical Biotechnology, Vol. 12, No. 3, July-September 2020151
Circulating Tumor Cells DetectionThe ROC curve is created by plotting the exactPositive Rate (TPR) against the False Positive Rate(FPR) at various threshold settings. The area under theROC curve was measured accurately. The flow cytometry by using anti-CK19 has shown more area underthe ROC curve in figure 4.Figure 2. Flow cytometry analysis of blood cells from: A) Healthysubjects (0.1% of cells detected with control antibody). B) Patients atstage I (0.1% of cells detected with Pan-antibody). C) Patients atstages II-IV (0.25% of cells detected with control antibody). D) patients at stages II-IV (1.43% of cells detected with Pan-antibody).that flow cytometry could distinguish the percentage ofCK19 expressing cells, even one T47D cell in 10 4white blood cells.Specificity: The specificity and sensitivity of flowcytometry methods by Anti-CK19 and Pan-CK antibody with EpCAM magnetic beads was also calculatedat different stages (Table 3).DiscussionBreast cancer is one of the most common forms ofcancer which causes death every year. It is estimatedthat one out of eight women develops breast cancer 3.According to Iran’s cancer registration, breast cancer isin the first rank cancers among women 3. Despite theadvances in the early diagnosis and treatment of breastcancer, it is still the leading cause of death amongwomen, so there is still a need for new strategies toassess breast cancer 24.In recent years, the CTC was considered a uniquetarget for understanding the disease development,prognosis, and treatment of breast cancer 9. In the lastdecade, CTC detection methods and their clinical utility were studied. CTCs i
Magnetic Activated Cell Sorting (MACS). Briefly, 1 ml blood and 5 ml RBC lysis buffer were mixed with vortex and kept on ice for 15 min, then were centri-fuged (1500 rpm for 10 min). Cells were suspended in 5 ml RBC lysis buffer and centrifuged followed by twice washing with