Transcription
VO et al. Journal of Biological 0-x(2021) 15:7RESEARCHOpen AccessOptimized expression of Hfq proteinincreases Escherichia coli growthPhuong N. L. VO, Hyang-Mi LEE, Jun REN and NA Dokyun*AbstractEscherichia coli is a widely used platform for metabolic engineering due to its fast growth and well-establishedengineering techniques. However, there has been a demand for faster-growing E. coli for higher production ofdesired substances. Here, to increase the growth of E. coli cells, we optimized the expression level of Hfq protein,which plays an essential role in stress responses. Six variants of the hfq gene with a different ribosome binding sitesequence and thereby a different expression level were constructed. When the Hfq expression level was optimizedin DH5α, its growth rate was increased by 12.1% and its cell density was also increased by 4.5%. RNA-seq andnetwork analyses revealed the upregulation of stress response genes and metabolic genes, which increases thetolerance against pH changes. When the same strategy was applied to five other E. coli strains (BL21 (DE3), JM109,TOP10, W3110, and MG1655), all their growth rates were increased by 18–94% but not all their densities wereincreased ( 12 32%). In conclusion, the Hfq expression optimization can increase cell growth rate and probablytheir cell densities as well. Since the hfq gene is highly conserved across bacterial species, the same strategy couldbe applied to other bacterial species to construct faster-growing strains.Keywords: Escherichia coli, Growth rate, Cell density, Hfq protein, Expression optimizationIntroductionThe production of chemical substances and proteinsfrom genetically engineered bacteria has been studiedfor decades for practical use [1], and metabolic engineering has proven the essential role of bacteria engineeringand its practical usefulness in the industry [2–4]. For instance, recent advances in metabolic engineering make itpossible to engineer bacteria or yeast cells for high andcost-efficient production of recombinant therapeuticproteins such as insulin and growth hormones [5–7] andbiofuels such as alcohols, fatty acid methyl, and ethyl esters [8–10]. Regarding recombinant protein production,there have been several strategies to increase protein titers. High copy-number plasmids have been used to produce larger amounts of desired proteins [11, 12], buthigh copy-number plasmids often place a metabolic* Correspondence: blisszen@cau.ac.krDepartment of Biomedical Engineering, Chung-Ang University, Seoul 06974,Republic of Koreaburden on host cells, which eventually decreases cellgrowth, reduces plasmid stability [13], and consequentlydecreases protein productivity [14, 15]. Optimization ofpromoter strength has been also used to obtain a highprotein titer. Depending on the properties or activities imization often increases overall protein titers [16–19]. Recently, the increase in bacterial growth rate or celldensity has gained great interest to achieve higher production of proteins [20]. Several strategies for improvingthe cell density of Escherichia coli are summarized inTable 1.In this study, we developed an E. coli strain that had ahigher growth rate by optimizing the expression level ofHfq protein. Hfq protein was originally discovered as ahost factor for phage Qβ (Hfq) replication in E. coli [34].This chaperone, Hfq protein, is an abundant 11 kDa protein that forms a hexameric ring, can be found in morethan 50% of bacterial species [35], and present widely in The Author(s). 2021 Open Access This article is licensed under a Creative Commons Attribution 4.0 International License,which permits use, sharing, adaptation, distribution and reproduction in any medium or format, as long as you giveappropriate credit to the original author(s) and the source, provide a link to the Creative Commons licence, and indicate ifchanges were made. The images or other third party material in this article are included in the article's Creative Commonslicence, unless indicated otherwise in a credit line to the material. If material is not included in the article's Creative Commonslicence and your intended use is not permitted by statutory regulation or exceeds the permitted use, you will need to obtainpermission directly from the copyright holder. To view a copy of this licence, visit http://creativecommons.org/licenses/by/4.0/.The Creative Commons Public Domain Dedication waiver ) applies to thedata made available in this article, unless otherwise stated in a credit line to the data.
VO et al. Journal of Biological Engineering(2021) 15:7Page 2 of 9Table 1 Several studies on improving E. coli cell growthStrategyScaleReferenceAlteration in medium components/conditionsBioreactor/Fermenter[21, 22]Regulated membrane dialysis/electro-dialysis reactor/fed-batch acetylase (pta)-deleted strain expressing interleukin 2Fermenter[28]Carbon flux redirection to reduce acetate production (introduced fadR::Tn10 allele into wild-type E. coli K-12 VJS632strain)Shake flask[29]Down-regulated phosphotransacetylase (pta) and acetate kinase (ack)Shake flask[30]Chimeric GroEL (C-terminal segment from psychrophilic Pseudoalteromonas sp. combined with the remainder ofGroEL from E. coli)N/A[31]Co-expression of chaperonins GroEL/GroESShake flask[32]Random mutagenesis of GroEL/S96 well plates[33]proteobacteria and firmicutes [36, 37]. There have beenseveral studies indicating that Hfq promotes the abilityof host cells to resist stresses such as oxidative stressand pH stress [38]. In addition, the role of Hfq in thecontrol of growth-related genes has also been reported[39, 40]. Therefore, we hypothesized that theoptimization of Hfq expression could increase bacterialgrowth rate.Here, we designed diverse ribosome-binding site (RBS)sequences of the hfq gene to fine-tune its expressionlevel by using a computational RBS design tool, RBSDesigner [41], or random screening. A conventional approach to control gene expression in E. coli is to use aninducible promoter or a synthetic promoter. The nativepromoter of hfq gene was replaced with an induciblepromoter such as lac promoter and then its expressionlevel can be controlled by the concentration of its inducer, isopropyl β-d-1-thiogalactopyranoside (IPTG)[42–44]. However, hfq transcription is driven from several promoters including three σ32-dependent heat shockpromoters within the miaA open reading frame,PmutLHS, PmiaAHS, and P1hfqHS, and four σ70-dependentpromoters, PmutL, PmiaA, P2hfq, and P3hfq [45]. Thus, replacement of the hfq promoters may result in disruptionof cellular regulation systems, and which may lead tounexpected outcomes. Therefore, we designed variousRBS sequences to control the level of Hfq protein expression without modifying its promoter. Thereafter, weinvestigated whether Hfq expression levels affect thegrowth of various E. coli strains.Material and methodsBacterial strains, plasmids, and antibioticsBacterial strains and plasmids used in this study arelisted in Table S1. The media used for E. coli culturewere Luria-Bertani broth (10 g Bacto Tryptone, 5 g yeastextract, and 10 g NaCl per L) [46] and cells were cultured in 250-mL Erlenmeyer flasks at 37 C shakingincubator. Antibiotic was added to reach the followingfinal concentration: chloramphenicol, 25 μg/mL.Various hfq RBS sequences and plasmid constructionDifferent E. coli hfq variants with a variety of translationefficiencies were designed by RBSDesigner. The variants1–4 were designed by RBSDesigner. To achieve a higherexpression level, randomly generated RBS sequenceswere screened, and variants 5 and 6 were selected. Sequences of primers and genes are shown in Table S2.Briefly, the amplified hfq gene from E. coli DH5αstrain using HfqF AatII and HfqR XhoI primers wascloned into the corresponding restriction sites inpSC101 plasmid. A strong transcriptional terminatorT1/TE was cloned downstream of the inserted hfq sequence. The hfq variant plasmids were constructed byinverse PCR on the pSC-WT hfq template. pSC-hfq-xgfp had the gfp gene cloned downstream of the Hfq coding sequence using SpeI/XhoI and thereby their codingsequences were fused. To increase the structural flexibility between Hfq and GFP proteins, a stretch of Gly andSer residues (“GS” linker) was used to connect hfq andgfp genes. All constructed RBS sequences of the hfq variants are listed in Table S3.Growth measurementThe hfq-harboring cells of E. coli DH5α and hfq-deletedDH5α were cultured in a 250-mL flask, and their opticaldensities (OD600) were measured every 2 h. The growthof other E. coli strains was measured by using BiotekSynergy H1 plate reader (Winooski, VT, USA) at OD600every 1 h for 24 h. All experiments were carried out intriplicate. E. coli cells harboring an empty vector wereused as a control.Growth rate (μ) was determined by the equationbelow [47]:
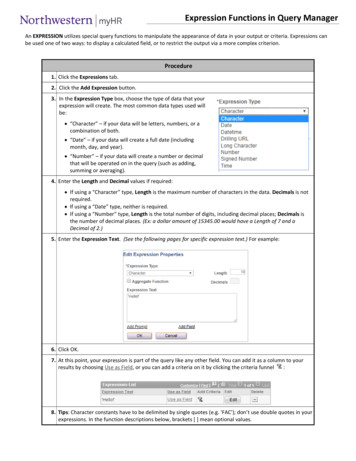
VO et al. Journal of Biological Engineering(2021) 15:7ln OD2 ln OD1μ¼t2 t1Page 3 of 9Results and discussionRole of Hfq protein in cell growthTo confirm the expression level of hfq variants, the gfpgene was cloned downstream of the hfq coding sequenceas a fusion protein. The fluorescence intensity of GFPwas measured by Guava Easycyte HT BG Flow Cytometer (Millipore, Billerica, MA, USA) to determine theexpression level of hfq variants. For fluorescence measurement, harvest cells were washed and resuspended in1 phosphate-buffered saline (PBS) buffer at pH 7.4(Sigma-Aldrich, St. Louis, USA), and subsequently diluted 1000 times with 1 PBS buffer. All experimentswere performed in triplicate.There have been reports that the host factor for phageQβ (Hfq) is closely related to cell growth [39]. For example, Hfq protein is associated with stress resistance inE. coli [38] and it showed to be crucial for cell survivalunder nutrient limitation [54]. Hfq protein is also knownas a global regulator and is involved in posttranscriptional regulation by facilitating the interactionbetween small regulatory RNAs (sRNAs) and mRNAs[55, 56], and regulations of RNA stability [57, 58]. Hfqprotein also controls the activity of several proteins involved in mRNA turnover by directly or indirectly interacting with RNase E [59], polynucleotide phosphorylase,and poly(A) polymerase [60–63]. Therefore, we hypothesized that increased Hfq protein expression may promote cell growth by enhancing resistance toenvironmental stresses. However, since over-expressionof Hfq protein may disrupt cellular physiology by extensive protein expression alteration, which may retard cellgrowth, we also hypothesized that the expression of Hfqprotein should be finely optimized.mRNA-seq analysisConstruction of various RBS sequences to diversify theexpression level of Hfq protein in E. coliwhere (t2 – t1) denotes the interval between two sampling points at t1 and t2, and OD1 and OD2 denote theoptical densities of cells sampled at times t1 and t2,respectively.Fluorescence measurementTo investigate the effect of hfq variants on cellular geneexpressions, RNA-seq analysis was conducted. When thehfq variant 4 was introduced into hfq-deleted DH5α, itachieved the highest cell density and comparably highgrowth rate. The mRNAs in the cells were prepared forthe analysis. mRNAs extracted from hfq-deleted DH5αand wild-type DH5α were used as a control. Three samples from individual cultures at stationary phase wereused for RNA-seq analysis.The number of reads for each gene was determinedusing HTSeq [48]. To reduce gene length bias, ReadsPer Kilobase Million (RPKM) of each gene were calculated by dividing the total number of read count alignedto a gene by 1,000,000 and by the length of the gene inkilobase [49].To identify differentially expressed genes (DEGs),genes were filtered as the following criteria: log2(foldchange) 2; p-value 0.05; and normalized read count 10. Gene Ontology (GO) and Kyoto Encyclopedia ofGenes and Genomes (KEGG) enrichment of DEGs wereanalyzed by the Database for Annotation, Visualizationand Integrated Discovery (DAVID) [50]. Enriched GOterms and KEGG pathways were selected by a p-value 0.05.The protein-protein interaction (PPI) network ofDEGs was constructed using the STRING database [51]and Cytoscape [52]. Highly interconnected clusters wereidentified using Molecular Complex Detection(MCODE) [53].We constructed six RBS variants of the hfq gene by acomputational model and random screening (Table S3)to achieve a desired expression level of Hfq protein(Fig. 1a) and thereby increase cell growth. To avoid thedisruption of inherent regulation of hfq transcription, itsnative promoters were used without modification (Fig.1a). To maintain a low copy number of the hfq gene, theconstructed genes were introduced into the pSC101plasmid with only 5 copies in E. coli.To confirm the expression levels of the constructedhfq variants, the GFP coding sequence was fused at theC-terminus of the hfq coding sequence with a stretch ofGly and Ser residues (GS linker). The constructed variants show diverse expression levels of Hfq protein (Fig.1b). The cells harboring hfq variant 6 displayed the highest expression level, whereas hfq variant 1 demonstratedthe lowest expression level, which was 19.5-fold lowerthan that of hfq variant 6.Fine optimization of Hfq expression increased E. coligrowthTo effectively investigate the difference in cell growth,the hfq variants were introduced into hfq-deleted DH5αcells (Fig. 2a). For comparison, the variants were also introduced into wild-type DH5α cells (Fig. 2b). As shownin Fig. 2a, deletion of hfq gene dramatically reducedgrowth rate and maximum cell density (optical densitymeasured at 600 nm): the measured growth rate was0.422 0.005 h 1 and the highest OD was 3.36.
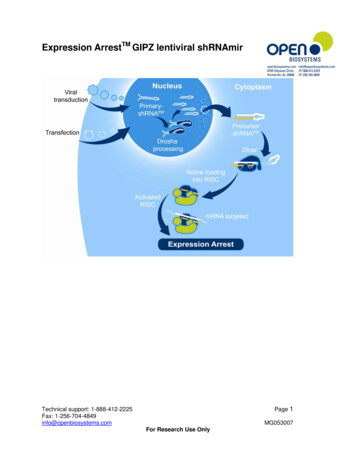
VO et al. Journal of Biological Engineering(2021) 15:7Page 4 of 9Fig. 1 Constructed hfq variants and their expression levels. a Constructed hfq gene structure and RBS variants. Four to six nucleotides upstreamof Shine Dalgarno (SD) sequence and eight nucleotides downstream of SD designed or randomly generated. To avoid prolonged transcriptiondownstream of the hfq gene, a transcription terminator was added to the gene construct. b GFP-fused Hfq expression levels. The greenfluorescence intensity emitted from E. coli DH5α with a hfq variant was measured. Three replicates and mean SD. When tested with each otherby t-test, there were no statistically significant differences only between the expression levels of variants 2 and 3 (p-value 0.05)Fig. 2 The effect of diverse hfq variants on the growth of wild-type DH5α and Δhfq DH5α cells. Growth curves of Δhfq DH5α cells (a) and wildtype DH5α cells (b) when an hfq variant was introduced. Relative growth rate increase (c) and relative cell density increase (d) by the hfq variants.To calculate the relative values, the measured values were compared with that of control cells that did not harbor any hfq variants. * denotes pvalue 0.05 and ** denotes p-value 0.0001
VO et al. Journal of Biological Engineering(2021) 15:7Introduction of the hfq variants recovered the growthrate as well as maximum cell density. Variant 4 achievedthe highest cell density (42.2% increase) in hfq-deletedDH5α cells. Though the variant 6 achieved the highestgrowth rate (94.3% increase), the variant 4 also achieveda comparably high growth rate (83.4% increase) (Fig. 2cand d). Regarding wild-type DH5α cells, since the cellsalready harbor an inherent hfq gene, the hfq variantscould not significantly increase growth (Fig. 2b, c, andd). The growth rate and maximum OD of wild-typeDH5α cells were 0.587 0.001 h 1 and 4.47, respectively. When Hfq expression was optimized in wild-typeDH5α cells, the growth rate was increased by 12.1% bythe variant 6 and the cell density was increased only by4.5% by the same variant. These results represent thatHfq expression optimization is able to increase cellgrowth.Differentially expressed genesTo investigate the biological effect of Hfq expression oncellular physiology leading to the increase in bacterialgrowth, we performed RNA-seq analysis to discover upand down-regulated genes of the three strains (hfq variant 4 in hfq-deleted DH5α, hfq-deleted DH5α, and wildtype DH5α). Hfq protein is an RNA-binding protein,specifically interacts with sRNAs to regulate mRNAs atpost-transcription stage. Thus, RNA-seq analysis doesnot reveal the direct relationship between Hfq proteinand transcripts. However, since transcripts encoding forproteins are actual players in cellular physiology, RNAseq approach is useful to capture which cellular functions are implicated in increased cell growth.Firstly, we compared the up- and down-regulatedgenes between hfq variant 4 in hfq-deleted DH5α andhfq-deleted DH5α. It was expected that hfq-deleted cellswere an effective control to clearly reveal the underlyingmechanisms related to improved cell growth. However,as explained in Text S1, the absence of the global regulator, Hfq protein, globally affected the cellular expressionof genes even that are not related to cell growth, and asa result the RNA-seq analysis results misled to an inappropriate conclusion (Fig. S1).Thus, we compared the expression patterns of hfqvariant 4 in hfq-deleted DH5α and wild-type DH5α. Thehfq-deleted DH5α cells harboring variant 4 showed ahigher growth rate as well as a higher cell density thanwild-type DH5α, and therefore wild-type DH5α cellsalready expressing the inherent hfq gene would be a better control to eliminate the global effect of Hfq protein.From the RNA-seq analysis, we found 110 differentiallyexpressed genes (DEGs) with log2(fold change) 2 andp-value 0.05. Of the 110 genes, 64 genes were upregulated and the remaining 46 genes were downregulated. We performed enrichment analysis of GOPage 5 of 9terms and KEGG pathways within the DEGs to investigate physiological differences between variant 4 andwild-type DH5α E. coli. The DAVID bioinformatics tool[50] was utilized to identify the functions enrichedwithin DEGs. The enriched terms are listed in Fig. 3a. Inaddition to the enrichment analyses, we generated aprotein-protein interaction network of the DEGs usingSTRING database [64] and identified densely interconnected clusters. As shown in Fig. 3b, six highly interconnected clusters were identified by using Cytoscape [52]and MCODE [53]. The clusters were functionally similarto the enriched GO terms and KEGG pathways.As bacterial cells grow in LB broth, alkalinization occurs and cells are exposed to alkaline stress (Fig. S1C)[46]. Compared with wild-type E. coli, the cells harboring the variant 4 showed up-regulated biological processes such as “Arginine catabolic process to succinate”(GO:0019545, p-value 2.79 10 7), “Arginine catabolicprocess to glutamate” (GO:0019544, p-value 2.79 10 7), and “Arginine and proline metabolism”(eco00330, p-value 9.23 10 4). These processes convert molecules into acids instead of producing alkalineamines, and which could reduce the alkaline stress. Additionally, of the three up-regulated genes (aldB, gabD,and astD) involved in “Aldehyde dehydrogenase (NAD)activity” (GO:0004029, p-value 7.0 10 3), gabD encodes for a succinic semialdehyde dehydrogenase(SSDH) that plays an important role in γ-aminobutyricacid (GABA) shunt pathway to produce succinate. TheastD encodes for succinylglutamic semialdehyde dehydrogenase involved in the arginine catabolism to glutamate. Aldehyde dehydrogenase B (aldB) waspreviously reported as an NADP -dependent general detoxifying enzyme [65]. Besides, arginine is an importantcarbon and nitrogen source during starvation (stationaryphase) [66], and the production of glutamate and succinate also fuels the tricarboxylic acid cycle (TCA) for energy generation.The processes “Butanoate metabolism” (eco00650, pvalue 3.4 10 3) and “Pentose and glucu
was measured by Guava Easycyte HT BG Flow Cyt-ometer (Millipore, Billerica, MA, USA) to determine the expression level of hfq variants. For fluorescence meas-urement, harvest cells were washed and resuspended in 1 phosphate-buffered saline (PBS) buffer at pH7.4 (Sigma-Aldrich, St. Louis, U