Transcription
NutritionArtsAlgebraEarth ScienceGeographyEnglishLanguage ArtsUS HistorySpanishPhysical le UbD Units
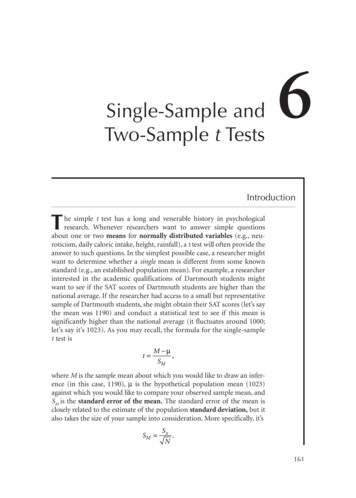
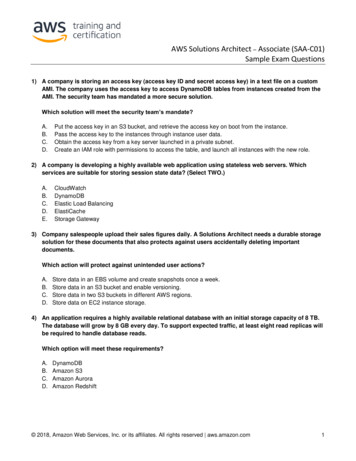
Figure 1a (Nutrition)UbD Template 2Stage 1 – Desired ResultsTransferEstablished GoalsStudents will be able to independently use their learning to.GT Determine what and how much they should eat to maintain optimum health andavoid nutritionally-related problems.MeaningStandard 6Students will understandessential concepts aboutnutrition and diet.6a -Students will use anunderstanding of nutritionto plan appropriate dietsfor themselves and others.6c -Students will understand one’s own eatingpatterns and ways in whichthese patterns may beimproved.UNDERSTANDINGSStudents will understand that.U A balanced diet contributes to physical andmental health. The USDA Food Pyramid presentsrelative guidelines for nutrition. Dietary requirements vary for individualsbased on age, activity level, weight, andoverall health. Healthful living requires an individual to acton available information about good nutrition even if it means breaking comfortablehabits. 2009 Grant Wiggins & Jay McTigheESSENTIAL QUESTIONSStudents will keep considering.Q What is healthful eating? Are you a heathful eater? How could a healthy diet for oneperson be unhealthy for another? Why are there so many healthproblems in the modern world causedby poor eating despite all of theavailable information?Acquisition of Knowledge & SkillStudents will know.K key nutrition terms - protein, fat,calorie, carbohydrate, cholesterol,vitamins, minerals types of foods in each food group &their nutritional values the USDA Pyramid guidelines variables influencing nutritional needs specific health problems caused bypoor nutritionStudents will be skilled at.S reading and interpreting nutritioninformation on food labels analyzing diets for nutritional value. planning balanced diets for themselves and others2
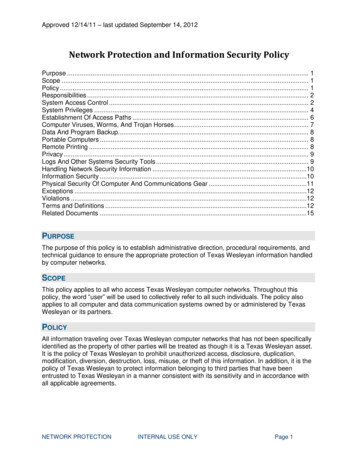
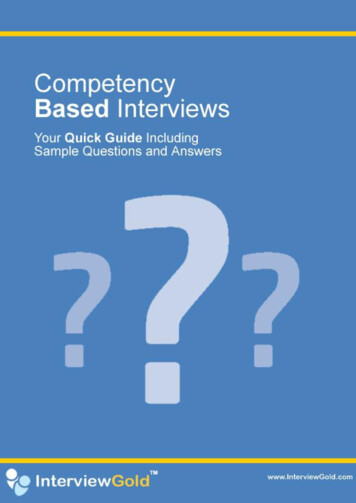
Figure 1bUbD Template 2STAGE 2 – EvidenceChecks forAlignmentStudents will show their learning by –Evaluative Criteria accurate andcomplete illustration of balancedeating menu meetsUSDA guidelines linkage betweenpoor eating &specific healthproblems accurate nutritional chart clear & understandable explanation, suited tothe audience accurateTRANSFER TASK(S):(framed using GRASPS)You Are What You Eat – Since our class has learning about nutrition, the firstgrade teachers have asked us to help their students learn about healthfuleating. Your job is to create a picture book to use in teaching the first gradersabout the importance of good nutrition for healthful living. Include picturesto show what a “balanced diet” is, and show at least two health problems thatcan result from poor eating habits.Camp Menu – Since we have been learning about nutrition, the camp directorat the Outdoor Ed. Center has asked us to propose a nutritionally-balancedmenu for our three-day trip to the Center later this year. Using the USDAFood Pyramid guidelines and the Nutrition Facts on food labels, design a planfor three days, including the 3 main meals and 3 snacks (a.m., p.m., and campfire). Your goal: a tasty and nutritionally-balanced menu. In addition to yourmenu, prepare a letter to the camp director explaining how your menu meetsthe USDA nutritional guidelines. Include a chart showing a breakdown of thefat, protein, carbohydrates, vitamins, minerals, and calories.OTHER EVIDENCE:Quiz 1 - the food groupsQuiz 2 - the USDA Food Pyramid recommendations accurate complete honest perceptive 2009 Grant Wiggins & Jay McTighePrompt - Describe two health problems that could arise as a result of poornutrition and explain how these could be avoided.Student Self-Assessment/Reflection - To what the extent are you a healtheater at the end of unit (compared to the beginning)?3
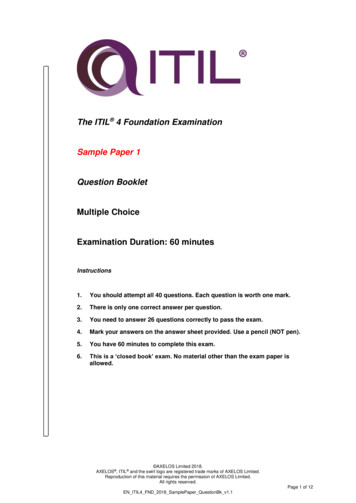
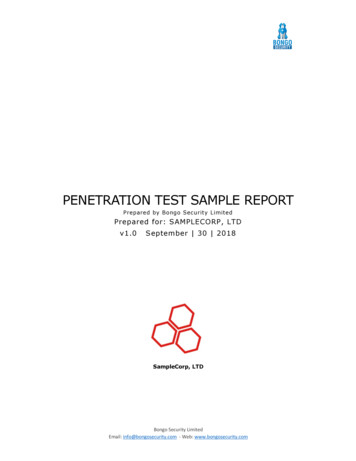
UbD Template 2Figure 1cSTAGE 3 – Learning PlanSCoding forAlignmentSummary of Key Learning Events and Instruction (coded using A-M-T)1. Begin with an entry question (Can the foods you eat cause zits?) to hook students into considering the effects of nutrition ontheir lives. M2. Introduce the essential questions and discuss the culminating unit performance tasks (Chow Down and Eating Action Plan). M3. Note: Key vocabulary terms are introduced as needed by the various learning activities and performance tasks. Students readand discuss relevant selections from the Health textbook to support the learning activities and tasks. As an on-going activitystudents keep a chart of their daily eating and drinking for later review and evaluation. A4. Present concept attainment lesson on the food groups. Then, have students practice categorizing pictures of foods accordingly.M5. Introduce the Food Pyramid and identify foods in each group. Students work in groups to develop a poster of the Food Pyramidcontaining cut-out pictures of foods in each group. Display the posters in the classroom or hallway. A6. Give quiz on the Food groups and Food Pyramid (matching format). A7. Review and discuss the nutrition brochure from the USDA. Discussion question: Must everyone follow the same diet in order tobe healthy?A M8. Working in cooperative groups, students analyze a hypothetical family*s diet (deliberately unbalanced) and make recommendations for improved nutrition. Teacher observes and coaches students as they work. M T9. Have groups share their diet analyses and discuss as a class. M(Note: Teacher collects and reviews the diet analyses to look for misunderstandings needing instructional attention.)10. Each student designs an illustrated nutrition brochure to teach younger children about the importance of good nutrition forhealthy living and the problems associated with poor eating. This activity is completed outside of class. M T11. Show and discuss the video, Nutrition and You. Discuss the health problems linked to poor eating. A12. Students listen to, and question, a guest speaker (nutritionist from the local hospital) about health problems caused by poornutrition. A13. Students respond to written prompt: Describe two health problems that could arise as a result of poor nutrition and explainwhat changes in eating could help to avoid them. (These are collected and graded by teacher.)A14. Teacher models how to read and interpret food label information on nutritional values. Then, have students practice usingdonated boxes, cans and bottles (empty!). A15. Students work independently to develop the 3-day camp menu. T16. At the conclusion of the unit, students review their completed daily eating chart and self assess the “healthfulness” of theireating. Have they noticed changes? Improvements? Do they notice changes in how they feel and/or their appearance? M T17. Students develop a personal “eating action plan” for healthful eating. These are saved and presented at upcoming student-involved parent conferences. T18. Conclude the unit with student self evaluation regarding their personal eating habits. Have each student develop a personalaction plan for their “healthful eating” goal. M T 2009 Grant Wiggins & Jay McTighe4
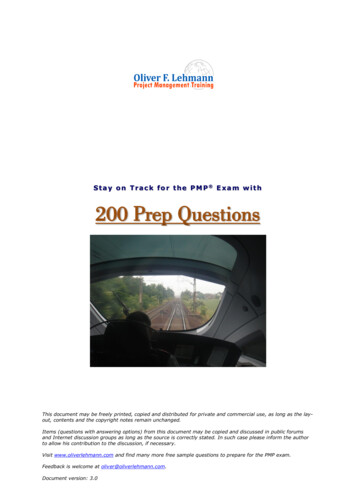
Figure 2a (Art)UbD Template 2Stage 1 – Desired ResultsTransferEstablished GoalsGMaryland Visual ArtsStandard 1.2a: Compare howartists use narrative conventions in selected artworksStandard 1.2b: Create narrativeartworks from observation,memory, and imagination thatshow setting, characters,action, and differing pointsof viewStandard 2.3b: Plan personalartworks that interpret theunique styles and forms ofdifferent artistsStandard 3.2a: Communicateideas and concepts bymanipulating elements of artand principles of design toachieve specific visualeffectsStandard 4.2c: Formulate,apply, and communicatecriteria for making aestheticjudgments about personallycreated artworks and theartworks of others 2009 Grant Wiggins & Jay McTigheStudents will be able to independently use their learning to. Create original narratives based on various themes and media. Use the artistic process in the creation of original narrative works. Select and effectively apply different media and coventions to the narrative. Analyze and critique works of art (including their own) against criteria.TMeaningUNDERSTANDINGSStudents will understand that.U Ideas for artworks may come from observations,imagination, personal experiences, and/or otherartists Artists use narrative conventions similar to oraland written storytelling to tell stories. Artists select, organize, and manipulate artelements and principles of design to create specific effects and communicate meaning Decisions about art and artmaking can be basedon established and personally developed criteria.ESSENTIAL QUESTIONSStudents will keep considering.Q Where do artists get their ideas? How do artists tell stories with images? How can meaning be communicated inartworks? What do artists consider when makingdecisions about their work?Acquisition of Knowledge & SkillStudents will know.K background information on Jacob Lawrence,Romare Bearden, and Faith Ringgold key vocabulary and processes related to visualnarrative, narrative conventions, art media andtechniques stages of planning and finalizing compositionsStudents will be skilled at.S comparing, analyzing and discussing artworks generating ideas through brainstorming andsketching planning, selecting and organizing a variety ofmaterials and images in a composition5
Figure 2bUbD Template 2STAGE 2 – EvidenceChecks forAlignmentStudents will show their learning by –Evaluative Criteria1.2a1.2b2.3b3.2a effective use ofnarrative conventions (characters,action, setting),art elements anddesign principlesto communicate astory effective use ofselected mediaTRANSFER TASK(S):Analysis/Development of Personal NarrativeStudents will analyze and compare artworks by Jacob Lawrence, RomareBearden, and Faith Ringgold to identify characteristics of their styleand ways they use narrative conventions to communicate visual stories.Students will use information learned from the analysis to generateideas for a personal narrative by planning a series of sketches, selectingone idea to enlarge and finalize in a medium (collage, mixed media, and/orpaint) influenced by their study. Students will prepare the final work foran exhibit. craftsmanship insightful,complete, andwell-writtenOTHER EVIDENCE:2.3b3.2a4.2c Student self-reflections defending decisions made in creating,selecting media, and completing narrative compositions. Teacher observations of the artistic process of planning, use ofmaterials, work habits, and safety procedures. 2009 Grant Wiggins & Jay McTighe6
Figure 2cUbD Template 2STAGE 3 – Learning PlanSCoding forAlignmentSummary of Key Learning Events and InstructionLesson 1 (Background and research, analyze, observe)Students will be introduced to three artworks. They will be asked to determine which one best “tells” a story and toidentify what in the work contributes to storytelling. Teacher will guide students in analyzing a selected artwork to identifythe narrative conventions (i.e., subject/characters, setting, time frame, action, text, sequence, etc.) used to communicatethe story. Students will then work in pairs or trios to read about Jacob Lawrence, Romare Bearden, and Faith Ringgold andother narrative works by the artists. They will analyze and compare the artists’ works to identify similarities anddifferences in themes or subject matter, use of narrative conventions/storytelling techniques and unique characteristicsof their style. Based upon their group analysis and discussions, students will work from a writing prompt to draft a summaryof their analysis.Lesson 2 – (Imagine/generate ideas, reflect)Students will share drafts from previous class then look at a teacher-made narrative sample and discuss the subjectmatter, ways that the sample incorporated narrative conventions discussed in the previous class, stylistic elements, andcompositional qualities. Students will be presented with the performance task activity and criteria for creating a personalnarrative. They will discuss themes/subjects that have significance to them and plan 3 sketches for a personal narrativethat incorporates stylistic elements and/or media choices observed in their analysis of Lawrence, Bearden, and Ringgold’swork. Students will critique their sketches to determine which one most effectively tells a personal story.Lesson 3 – (Plan, experiment, reflect)Students will select, refine, and enlarge one idea from their sketches that fulfills criteria established by the class, teacherand personal interests. Students will work in pairs to review each others’ enlarged sketches and give feedback regardingeffective narrative techniques and visual impact through choice of art elements and design principles. The teacher willdemonstrate on the teacher-made sample ways to add paint, texture, and other collage components/materials to thecomposition. Students will experiment with collage and mixed media techniques by painting and/or collaging materials toparts of their sketches before applying them to the final composition. Students will complete a journal entry to reflect onthe process and progress of their work.Lessons 4, 5, 6, 7 (Studio time: experiment, revise/refine, reflect)–Students will continue experimenting with media. Teacher will provide on-going feedback while students work and makerefinements to the final composition. Students will share their works in progress, discuss processes and techniques, andconsult with each other to determine what areas still need work and where modifications or changes may be needed.Students will complete a journal entry to reflect on the process andprogress of their work at the end of each studiosession.Lesson 8 – (Reflect/self-evaluate)Students will finalize their compositions and prepare their work for exhibition. They will complete a self-reflection of thework process, discuss whether they met the established criteria, and defend the choices they made in completing theirwork. 2009 Grant Wiggins & Jay McTighe7
UbD Template 2Figure 3a (Algebra)Stage 1 – Desired ResultsTransferEstablished GoalsGState Standards related tolinear relationships - equations,graphing, finding slope andintercepts, etc.Barriers to desired results:Some students get mixed up with negative slopes. Stress that they can placethe negative in the numerator (“downand to the right”) or the denominator(“up and to the left”) and get the sameresult. Also, they should have a holisticunderstanding that negative sloperepresent a line that falls as we read thegraph from left to right.Students are often challenged by horizontal and vertical lines, partly becauseinstructors often spend little time withthem. They need to be encouragedto approach them differently. Ratherthan just memorize rules for recognizing them, try to get them to “read”the equation. (“x 4” tells us that thex-coordinate is “4” regardless of they-coordinate. What points satisfy thiscondition? Can you list examples?) 2009 Grant Wiggins & Jay McTigheStudents will be able to independently use their learning to.TT.1. recognize and solve real-world problems that are linear in nature.MeaningUNDERSTANDINGSStudents will understand that.U1. Mathematics can efficiently describe naturally occurring patterns. 2. Linear equations and their graphsare concise methods for representing relationships thatinvolve constant rates of change. 3. We have more thanone way to represent and understand linear relationships, including equations (in various forms), graphs,and tables. One representation may be more suitablethan another for our needs. 4. Graphs of lines show usinformation that can be summarized in an equation. Anyone of these representations can be used to generate theother two.ESSENTIAL QUESTIONSStudents will keep considering.Q1. What is the best way to represent (a particular relationship)?2. What are the defining characteristics of a type of relationship? How do we best measure and interpret them?3. When would I prefer one algebraic representation of aline over another? Is there always only one best option?4. When should I use an equation? A graph? A table?How do I know?Acquisition of Knowledge & SkillStudents will know.K1. What is the formula for finding slope?2. What is the y-intercept?3. What is the slope-intercept form of a linear equation? Point-slope form?4. What is the form of the equation of a vertical line?Horizontal? What is the slope of a vertical line? Horizontal?5. How are the slopes of parallel lines related? Perpendicular lines?Students will be skilled at.S1. Find distance and midpoint between two points.2. Find the slope between two points and interpret slope.3. Identify constant rate of change in real-world examplesand recognize it as slope. 4. Write equations and graphlines given slope and y-intercept. 5. Write equationsand graph lines given two points. 6.Change between thevarious forms of lines and extract information necessaryfor graphing. 7. Recognize parallel and perpendicularlines from their equations. 8. Graph linear absolute valueequations, and compare them to related linear equationswithout absolute value. 9. Graph linear inequalities andcompare them to related linear equations.8
Figure 3bUbD Template 2STAGE 2 – EvidenceChecks forAlignmentStudents will show their learning by –Evaluative CriteriaT1,U1 - U4Q3, Q4K1 - K3,S1 - S9Accuracy of the Mathematics, Justification ofthe Routes, Justificationof the Mathematics,Clarity of the Materials,Effectiveness of the Presentation to the Owners.T1U1 - U4Q1K1 - K5S1 - S9Accuracy of the Mathematics, Clarity of theWriting, Quality of theTips, Thoroughness ofthe Guide, Suitable forthe Audience.TRANSFER TASK(S):Task #1 -Title: As a Crow Flies.In this assessment, students will do the mathematical analysis to determine the implications of anew airline's guarantees. “You are the Flight Network Adviser, in charge of analyzing how wellyour flight network will function. You need to choose the best hub for your airline, and write equations to describe the flight paths for six important destinations (chosen because they reflect thepurpose of your airline). You must express and graph the relationship between average speed anddistance traveled. Third, come up with a reference for the airline to use to estimate arrival times(give a range) to different cities. As a part of your final report, explain how the company could customize your formulas if they add new cities in the future.”Task #2: The Linear Sampler: An Identification Guide for younger studentsThe students will use their accumulated knowledge and recent experiences to write and illustratethe different types of problems and issues that they have addressed that involve linear relationships.They should give algebraic and graphic representations and identification tips. A comprehensiveguide would include lines with positive slope, negative slope, horizontal, vertical, inequalities, absolute value, and pairs of lines that are parallel or perpendicular.OTHER EVIDENCE:Accuracy of theMathematics,U3-4Q1-2K1 - K5, Work Quality.S1 - S9Quiz: Line Basics and Advanced TopicsStudents will demonstrate the ability to write equations and graph lines given y-intercept and slope,point and slope, and two points. They will demonstrate their understanding of the concept of slopeand it potential real-world applications. They will calculate the distance between two points and findthe midpoint. Students will demonstrate the ability to recognize when a set of points does not determine a line, and special lines: horizontal and vertical. They will determine when lines are parallelor perpendicular. Students will demonstrate the ability to graph and interpret linear relationshipsthat involve absolute value and linear inequalities. They will also write equations, given graphs, andinterpret these relationships in real-world contexts. 2009 Grant Wiggins & Jay McTighe9
Figure 3cUbD Template 2STAGE 3 – Learning PlanSCoding forAlignmentSummary of Key Learning Events and InstructionM1.Name That Spot (M) Students will investigate paired data from a geometric standpoint using only natural language and observation.1. Place two points on the board that are on thesame line horizontally (don't actually draw a line at this point). Label them A and B. Ask students to describe what they see. How could they compare their locations? They should describe them in terms of one being to the left or the other to the right. They could estimate how far apart they are in inches. 2. Draw a line through the points, the real number line, andchoose a zero point somewhere between A and B. Mark off dashes that indicate individual units. Now what can they say about the points? They can now give them labels that indicateposition, as well as describe the distance between them using the units indicated by the dashes. Ask them to locate the point that is exactly half-way between them. Ask for the arithmetic they used, and show them that they have simply averaged the two numbers.3. New example: Place two points on the board, A and B, that are not in a horizontal line.A2.The Cartesian-Coordinate Plane, Midpoints, and the Distance Formula (A) Students will receive direct instruction in the graphing of ordered pairs and how to find the distancebetween two points and their midpoint. Use the previous event’s discussion to generate the formula for distance between points. Show them the formula as it is given in textbooks.HOWEVER, see if anyone can relate it back to the Pythagorean Formula.M3.How Much Can That Truck Hold? (M) Students will explore how one variable has a direct impact on a second in transporting sand. Tell students that you really love the seashore, andare considering redecorating your living room like the beach - paint the walls blue with an ocean mural on one side, set-up some beach chairs and an umbrella.but first you need tobuy sand - a lot of sand. How many bags of sand do you need for an average-size living room. Solicit and check reasonable estimates. In the end, settle on something like 100 bags– 6000 pounds. Will you be able to get it all in one trip in a pick-up? . There is a constant relationship between number of bags and weight - ask students to describe it. Have themcreate a chart for Home Depot to help customers who want to figure out how heavy a certain number of bags of sand will be and which kind of vehicle is best for which loads. Howcould we create a picture to represent this relationship?A4.Students will receive direct instruction in simple linear relationships and graphing them by plotting points. Give students practice writing simple linear equations from verbal descriptions.M5.Is it a Line?Make Meaning In this event, students will explore sets of points that do not create a line and the special cases of horizontal and vertical lines.1. Give students the following four sets of points and have them graph them on separate sets of axes: a. (-3, -4), (1, 0) and (5, 4); b. (-3, -4), (1,0) and (5,5); c. (3, -5), (3, 0) and (3, 6); d. (-4, 3), (0, 3) and (2,3). First question - for each line is there a line that hits all three points? (Yes, except for (b).) If so, draw the line. For example (b), how many lines are there that hit at least two points?(3 distinct lines.) For all combinations of points (3 per exercise), evaluate slope. Discuss findings. Use (a) to discuss collinear points and the fact that all slopes are equal. Use (b) todiscuss that if points look like they might be collinear, checking the slopes between them is a way to test that. Discuss the special lines that are determined by (c) and (d). What aretheir slopes? Differentiate between slope being 0 for any horizontal line and slope not existing for a vertical line. If slope is 0, what happens to y mx b?M6.Special Meetings.or Not. Students will explore the slopes of parallel and perpendicular lines by creating graphic examples and analyzing them.T7.How Many Ways?Transfer Students will apply their understanding of parallel and perpendicular lines in an event involving multiple solutions.Give students 3 non-collinear points.Ask them to try to create a pair of equations of parallel lines so that all three points are hit by one of the lines. Is this possible (yes), and if so, find all possible solutions (3 possiblesolutions). Give students 3 non-collinear point. Ask them to try to create a pair of equations of perpendicular lines so that all three points are hit by one of the lines. Is this possible(yes), and if so, find all possible solutions (3 possible solutions). 3. Give students 3 collinear points. Ask them to try to create a pair of equations of parallel lines so that all three pointsare hit by one of the lines. Is this possible (yes), and if so, find all possible solutions (infinite number of possible solutions - since one line hits all three, there are infinite possibilitiesfor the second line).M8.How Far From Home? Students will consider the difference between location relative to a certain point and distance from that point, motivating absolute value equations. Draw a lineon the board, representing a road that stretches from East to West. Draw a house at 0 and a person 10 miles to the left. Justify labeling this position as -10 based on past experiencewith the number line. Tell students that the person is going to travel East at 2 miles per hour. How long until they will be home? If they keep walking, where will they be after 8 hours?M9.Have students make a chart relating time to location (at time 0, location is -10; at time 1 location is -8, etc.). Ask them to write an equation and draw a graph that represents the relationship between time and distance from home. Which variable is dependent? Independent? Which should go on the horizontal axis? Some students may need some help with the factthat the variable of location is oriented horizontally in the diagram, but ends up being on the y-axis of our graph. Now add a third column to your chart labeled distance from home- ask students to fill in this column. With a different color, or a dashed line, have them graph the relationship of distance to time and compare it to location. How could we write analgebraic representation of distance versus time? 2009 Grant Wiggins & Jay McTighe10
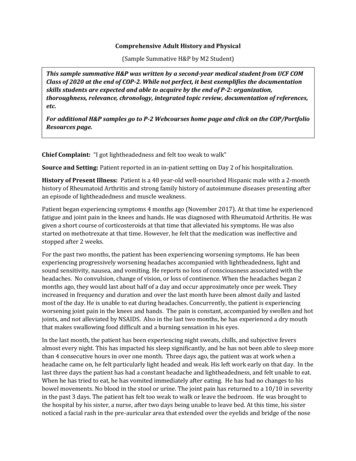
UbD Template 2Figure 4a (Earth Science: Climate)Stage 1 – Desired ResultsTransferEstablished GoalsStudents will be able to independently use their learning to.Gaccurately predict and compare the climates of varied locationsin terms of key climate-determining factors.MA Strand 2.8 Earth andSpace Science Strand 2,standard 8: Examine modelsand illustrate that globalwind patterns within theatmosphere are determinedby the unequal heatingbetween the equator andpoles, Earth’s rotation, andthe distribution of land andocean.TMeaningUNDERSTANDINGSStudents will understand that.U The unequal heating between the equator andpoles, earth’s rotation and the distribution ofland and ocean generate the global wind patterns that determine climate. Most of what goes on in the universe involvessome form of energy being transformed intoanother. Transformations of energy usuallyproduce some energy in the form of heat, whichspreads around by radiation and conduction intocooler places. (AAAS)ESSENTIAL QUESTIONSStudents will keep considering.Q What causes weather and wind patterns? What factors affect climate? How do events in one geographical area affectanother? How does climate affect agriculture? How can I apply these factors to locations onearth to determine the climate?Acquisition of Knowledge & SkillStudents will know. 2009 Grant Wiggins & Jay McTigheKcauses of wind and weather patternsfactors affecting climatecauses of the Coriolis effecthow events in one geographical area affectanotherhow climate affects agricultureStudents will be skilled at. Sinterpret data illustrating the relationshipbetween air pressure and temperatureinterpret isobar maps of gradient pressureapply the concepts of Newton’s First Law,the spherical geometry of the earth, andcentripetal acceleration to the Coriolis effect11
UbD Template 2Figure 4bStage 2 – EvidenceEvaluativeCriteriaChecks forAlignmentAssessment EvidenceStudents will need to show their learning by –TRANSFER TASK(S): accuracy ofpredictionsthoroughnessof explanationquality ofpresentationComparing ClimatesStudents will be asked to research the climate in our area and two other areas. One willbe at our latitude but in the interior of the continent. The other will be at our longitudebut at a tropical location. The students will compare the climates of these locations interms of climate determining factors. They will do this in teams representing a climatological consulting firm seeking an account with a large agricultural business that has farmsin each area.OTHER EVIDENCE: “open book” exam quizzes on readingsStage 3 – Learning PlanSummary of Key Learning Events and InstructionChecks:The teaching and learning needed to achieve the unit goals.Students will1. evaluate circulation cell diagram by identifying directions of air movement under specific conditions and explain these movements in termsof differential heating.2. perform the “Let’s Go Fly a Kite” activity. This is the hook! This will be the introductory activity for the unit. After completing the firstactivity, in which students will learn about the relationship between air pressure and wind, they will make predictions about which campuslocation will have the best kite flying. Then the class will, kites in hand, travel around the campus looking for the best place to fly a kite.We will then use our results to ask questions about what causes wind patterns, why wind patterns differ and what causes these differences.3. read articles and perform a series of labs that illustrate Newton’s First Law, and centripetal acceleration and then relate these to theCoriolis effect.4. analyze maps showing isobars and label the wind directions (and expl
10. Each student designs an illustrated nutrition brochure to teach younger children about the importance of good nutrition for healthy living and the problems associated with poor eating. This activity is completed outside of class. M T 11. Show and discuss the video, Nutrition and You.