Transcription
SAMPLE REPORT
Thank you for exploring Smart Reporting, powered by Fathom.As a QBO Advanced subscriber, you’ll receive 1 free license ( 468 annual value!*) to access thisplatform which will allow you to transform Quickbooks data into dynamic reports, advancedanalytics, and deeper insights to help you continue making better business decisions.Here’s a sample of a management report you can create with Smart Reporting access. This is onlya preview of what Smart Reporting can offer you. Other key features include: Design customized management reports Track KPIs and business metrics Create dashboards for your business Prepare and customize financial statements Gain insights into profit and growth Monitor alerts for key metrics Track and project trends in performance Better manage Cash Flow Track the performance of divisions, departments, or business units Automate the creation and distribution of reports Consolidate financials (to track the performance of a group of companies)For more information, you can view this short Smart Reporting Overview video or head on overto the QuickBooks Online Advanced page to learn more!*Fathom's retail cost for a single company in the United States is 39 per month, as of 1/23/2019.
Executive SummaryOverviewActionsWell done team. Revenue results for this month are better than planned.Revenues of 551,165 exceeded target of 520,000. However, labour costs of 95,511, material costs of 128,258 and equipment costs of 35,476 also werehigher than planned. It is important to compare our field labour ratio to ourbudget (to ensure we are as productive as planned) and to last year (to ensurewe are on a path of continuous improvement). Review sales forecast for next12 months Review pipelines ofestimates/quotes Implement measures todecrease the risk of staff injury Plan offsite staff retreatAdditionally, it is important to improve the current close rate of quotes providedto customers. We had a 70 per cent close rate (by number of estimates) but a50 per cent close rate (by dollar of estimates), which may indicate that we arenot spending enough time and effort on the big opportunities. Crew safe everyday is even more important than productivity or quality. During the past monththere have been no reported accidents or injuries.It is important to get a good handle on our numbers, and what actions deliversuccessful outcomes. This report include a range of KPIs and metrics, selectedto tell us whether we are achieving our goals – or not.ObservationsACTIVITYActivity Ratio 2.77 times (This month target 2.00 times)Positive trend upwards. Strategies to improve the activity ratio include seeking ways to optimise the balance sheet, ie. byreducing the investment in working capital, selling-off any unused assets or by increasing sales using the same asset base.PROFITABILITYProfitability Ratio 17.52% (Last month 26.04%)Negative trend downwards. Strategies to improve profitability include: increasing price, increasing sales volume, reducingcost of sales and reducing operating expensesEFFICIENCYReturn on Capital Employed 48.6% (This month target 12.5%)Positive trend upwards. A higher ROCE% is favourable, indicating that the business generates more earnings per 1 ofcapital employed.CASH FLOWFree Cash Flow 485,816Free Cash Flow is positive. After paying its operating expenses and investing for future growth (capital expenditures) thebusiness has generated cash. This cash is available to be paid back to the suppliers of capital.Prepared by Advisor CoPage 2
KPI ResultsRESULTAPROFITABILITYTotal RevenueTARGETJAN 2019TRENDIMPORTANCEvs DEC 2018 551,165 520,000-4.6%CriticalGross Profit Margin49.69%45%-0.37%MediumProfitability Ratio17.52%16.76%-8.51%CriticalNet Profit After Tax Margin10.53%15.38%-4.93%MediumRevenue per man hour 45.60 38.50-6.7%CriticalField labour expense % *17.3%17.2%0%HighEquipment expense % *6.4%6.4%0%High23.3%23.1%0%HighWin rate %65.2%77.5%-15.9%LowCustomer Satisfaction81.8%80%-4%Low2.77 times2.00 times-0.29 timesCriticalCurrent Ratio2.63:12.00:1-0.80:1MediumQuick Ratio2.00:11.00:1-0.39:1Medium 1,907,964 10,00040.2%Medium70.95%0%2.14%MediumRevenue Growth-4.59%0.41%-6%CriticalGross Profit ghBPRODUCTIVITYMaterials expense % *CDCUSTOMERACTIVITYActivity RatioEFLIQUIDITYCASH FLOWCash on HandNet Variable Cash FlowGGROWTHEBIT Growth* For this metric, a result below target is favourablePrepared by Advisor CoPage 3
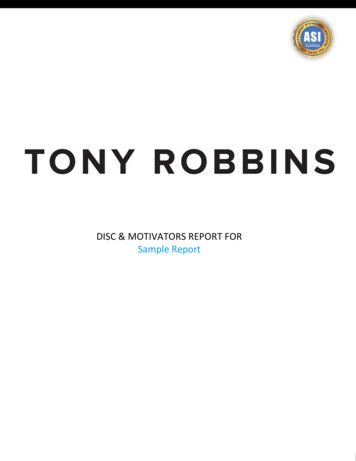
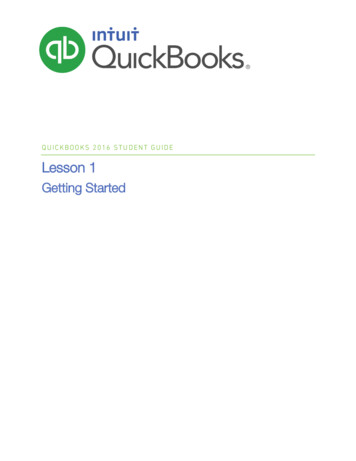
KPI resultsThis chart shows KPIs grouped into performance perspectives. Highlighting on-track KPIs and off-track KPIs.nratentexpeRevenueper mensense%%GrRatsPosioit %rofenuveeRPrepared by Advisor Co56%urre1018 KPIsandon Hble CashNet VariaFlowWProtybilifitaTYILIABFITPRON%r TaxCashH F LO8AfteCJan 2019Sort: By PerspectiveCASan houruiQLIQUID%OFF TRACKofitet PrSTtioRackON GRialseITFielderPRODUCTIVITYatEqRa%ti oWitionsfacSatiActivity RatioertomCusMGrosEBITGsPrownueGrowthrofit GrowththPage 4
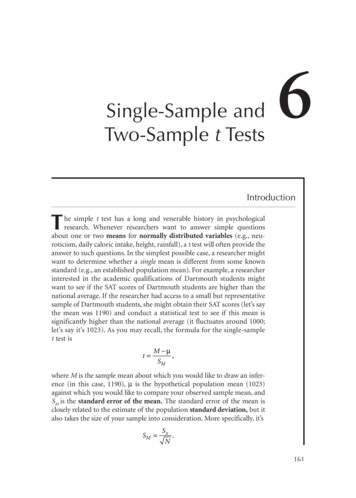
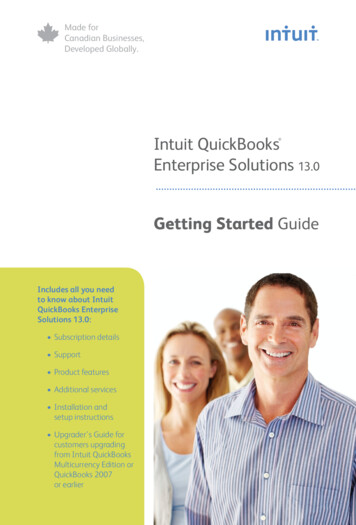
Revenue AnalysisTOTAL REVENUELAST MONTH (Jan 18)TARGET 551,165 369,832 520,000This year vs last yearLast 6 months vs BudgetRevenueLast YearRevenue 600K 800K 500K 600K 400K 400K 300K 200K 200KMar 18May 18Jul 18Sep 18Nov 18Jan 19 0Aug 18YTD REVENUE (2018/2019 YTD)YTD TARGET (2018/2019) 3,819,895 6,240,000Sep 18Oct 18Nov 18Dec 18BudgetJan 19LAST YEAR (2017/2018)Target 4,869,881Cumulative RevenueRevenue Rolling averageTarget ProjectionLast Year 10.0M 5.0M 0Feb 18 Mar 18 Apr 18 May 18 Jun 18Prepared by Advisor CoJul 18 Aug 18 Sep 18 Oct 18 Nov 18 Dec 18 Jan 19 Feb 19 Mar 19 Apr 19 May 19 Jun 19Jul 19Page 5
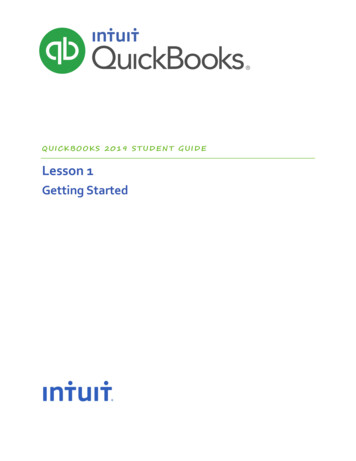
Revenue & ExpensesRevenue & Expenses for all timeExpense-to-Revenue Ratio 600K95%90% 400K85% 200K80% 0Jul 15Oct 15Jan 16Apr 16Jul 16Oct 16Jan 17Cost of ServicesApr 17Jul 17Field LabourApr 18Jul 18Oct 18Jan 19Materials 200K 100KSep 18Prepared by Advisor CoOct 18Nov 18 Dec 18May 18 Jun 18 Jul 18 Aug 18 Sep 18 Oct 18 Nov 18 Dec 18 Jan 19Top 10 Expenses 128,258Salaries & Wages 92,054Field Labour 95,511Entertainment 20,636Equipment 35,476Loan Interest 16,146Commissions 13,644Advertising & Promotions 11,357FreightAug 1875%Equipment 300KJul 18Jan 18Cost of Services breakdownMaterials 0Oct 17 4,411Contractors 9,324Repairs & Maintenance 8,927Travel & Accommodation 8,745Consulting Fees 8,743Marketing 7,681Training & Education 7,196Jan 19Page 6
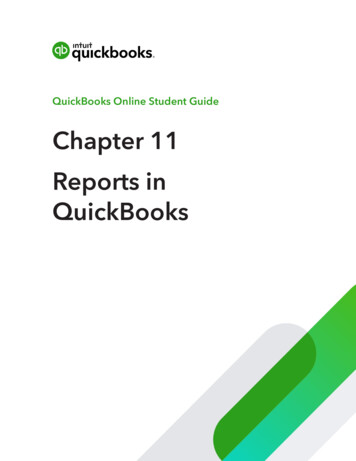
Profitability MarginsPositive trend upwards for the past 4 months. Much of this improvement in profit is a result of top line growth. Revenuesfor this period increased by 1.41% and Operating Profit decreased by -5.29%. This is a positive recovery a December andJanuary period, where sales dropped due to seasonality. Positive trend upwards for the past 4 months. Much of thisimprovement in profit is a result of top line growth.Jan 2019% of RevenueOct 2018Nov 2018Dec 2018 273,86549.7% 255,068 284,350 289,171Operating Profit 58,44810.6% 75,938 87,931 122,824Earnings Before Interest & Tax 96,57917.5% 106,376 121,948 150,406Earnings After Tax 58,05310.5% 70,480 80,154 89,348Gross Profit% MarginsGross Profit %Operating Profit %Net Profit After Tax %60%40%20%0%Feb 18Mar 18Apr 18May 18Jun 18Jul 18EBIT vs BudgetAug 18Sep 18Oct 18Nov 18Dec 18Jan 19Expenditure MixEBITBudget 200K 150KFixed EXP26.6%42.1% 100KFixed COSVariable EXP (1.6%)29.7% 50K 0Variable COSJul 18Sep 18Nov 18Prepared by Advisor CoJan 19Mar 19May 19Page 7
ProfitabilityREVENUEEXPENSES TO REVENUE RATIOMARGIN OF SAFETY 551,16589.4% 81,109-4.6% from last monthA measure of the total amount ofmoney received by the company forgoods sold or services provided.10.66% from last monthA measure of how efficiently thebusiness is conducting its operations.-52.1% from last monthThe breakeven safety marginrepresents the gap between the actualrevenue level and the breakevenpoint.Profitability can be further improved by improving price, volume, cost of sales and operating expense management.REVENUE 800KREVENUE 551,165TOTAL COSTS 492,718 600KBREAKEVEN POINT 400KVARIABLE COSTS 470,056MARGIN OF SAFETY 81,109 200KFIXED COSTSVARIABLE COSTS 0.28 PER 1 OF REVENUEFIXED COSTS 0Prepared by Advisor Co 338,723Page 8
Cash FlowOPERATING CASH FLOWFREE CASH FLOWNET CASH FLOW 470,059 485,816 516,630Operating cash flow is simply the cashgenerated by the operating activitiesof the business. Operating activitiesinclude the production, sales anddelivery of the company's productand/or services as well as collectingpayment from its customers andmaking payments to suppliers.Free cash flow is the cash generatedby the business, after paying itsexpenses and investing for futuregrowth. It is the cash left aftersubtracting capital expenditure fromoperating cash flow. The term "freecash flow" is used because this cash isfree to be paid back to the suppliers ofcapital.Net cash flow is the cash left aftersubtracting expenditures fromfinancing activities from the free cashflow. This includes the cash impactfrom financing activities. Financingactivities include the inflow of cashfrom investors such as banks orshareholders, as well as the outflow ofcash to shareholders as dividends.Cash ReceivedCash Spent 0 200Kadd: Revenueless:Cost of Salesless:Expenses 400K 600K 551,165- 277,301- 214,983add: Other Income 38,131less:- 40,496Cash Tax Paidadd: Change in Accounts Payableadd: Change in Other Current Liabilities 159,698 220,681less:Change in Accounts Receivable 12,371less:Change in Inventory 10,608less:Change in Work In Progress 0less:Change in Other Current Assets 10,183 470,059OPERATING CASH FLOWless:Change in Fixed Assets (ex. Depn and Amort) 20,316less:Change in Intangible Assets 0less:Change in Investment or Other Non-Current Assets- 4,558 485,816FREE CASH FLOWless:Net Interest (after tax) 863add: Change in Other Non-Current Liabilitiesless:Dividends- 35,117 0add: Change in Retained Earnings and Other Equity 65,068less: 0Adjustments 516,630NET CASH FLOWNet Cash Flow can also be calculated as:Change in Cash on Hand 546,840(Open: 1,361,124, Close: 1,907,964)Prepared by Advisor Co— Change in Debt 97,399(Open: 614,969, Close: 712,368)Page 9
Actual vs BudgetPROFIT & LOSSJan 2019BudgetBudget Variance ( )Budget Variance (%) 551,165 605,095- 53,930-8.91%RevenueIncomeCost of SalesEquipment 35,476 38,674- 3,198-8.27% 128,258 139,821- 11,563-8.27%Field Labour 95,511 104,122- 8,611-8.27%Commissions 13,644 14,875- 1,230-8.27% 4,411 4,220 1914.54%Total Cost of Sales 277,301 301,711- 24,410-8.09%Gross Profit 273,865 303,385- 29,520-9.73%MaterialsFreightExpensesMarketing 14,069 18,146- 4,077-22.47%General & Admin 99,517 101,296- 1,778-1.76%Staff CostsTotal ExpensesOperating Profit 101,831 109,399- 7,569-6.92% 215,417 228,841- 13,424-5.87% 58,448 74,543- 16,096-21.59%Other IncomeOther RevenueEarnings Before Interest & Tax 38,131 26,843 11,28942.06% 96,579 101,386- 4,807-4.74% 1,233 1,283- 50-3.89% 97,812 102,669- 4,857-4.73% 3,557 3,328 2296.88%Interest IncomeInterest IncomeEarnings Before TaxTax ExpensesPayroll TaxTax Expense 5,888 667 5,221783.20% 30,313 5,603 24,710441.03%Earnings After Tax 58,053 93,071- 35,018-37.62%Net Income 58,053 93,071- 35,018-37.62%Retained Income 58,053 93,071- 35,018-37.62%Income Tax ExpensePrepared by Advisor CoPage 10
Balance SheetBALANCE SHEETJan 2019Dec 2018Variance Variance %ASSETSCash & Equivalents 1,907,964 1,361,124 546,84040.18%Accounts Receivable 136,928 149,300- 12,371-8.29%Inventory 325,340 335,948- 10,608-3.16% 0 0 0–Work in ProgressOther Current Assets 312,327 322,510- 10,183-3.16%Total Current Assets 2,682,559 2,168,881 513,67823.68% 565,778 586,529- 20,751-3.54%Fixed AssetsIntangible AssetsInvestment or Other Non-Current .Total Non-Current AssetsTotal Assets 3,867 3,867 00.00% 17,529 12,970 4,55835.14% 587,174 603,366- 16,192-2.68% 3,269,733 2,772,248 497,48517.95%LIABILITIESShort Term DebtAccounts PayableTax Liability 91,129 82,619 8,51110.30% 390,276 230,578 159,69869.26% 0 0 0–Other Current Liabilities 539,661 318,980 220,68169.18%Total Current Liabilities 1,021,066 632,177 388,89061.52% 621,238 532,350 88,88916.70% 51,187 52,295- 1,108-2.12%- 184,454- 149,336- 35,117-23.52%Long Term DebtDeferred TaxesOther Non-Current LiabilitiesTotal Non-Current LiabilitiesTotal Liabilities 487,972 435,308 52,66412.10% 1,509,038 1,067,484 441,55341.36% 1,007,769 1,007,769 00.00% 502,420 444,367 58,05313.06%35.09%EQUITYRetained EarningsCurrent EarningsOther Equity 250,506 185,438 65,068Total Equity 1,760,695 1,637,574 123,1217.52%Total Liabilities & Equity 3,269,733 2,705,058 564,67520.87%Prepared by Advisor CoPage 11
KPIs ExplainedActivity Ratio 2.77 timesA measure of the efficiency or effectiveness with which the business manages its resources or assets. This measureindicates the speed with which Net Operating Assets (Equity Debt) are converted or turned into sales. This can beimproved by optimising balance sheet efficiency, ie. by reducing the investment in working capital, selling-off any unusedassets or by seeking ways to maximise the use of assets. For this period, the activity ratio has exceeded the target of 2.00times.Activity Ratio Annualised Revenue / Total Invested CapitalCash on Hand 1,907,964A measure of the cash and cash equivalents in actual possession by the company at a particular time. At the end of thisperiod the company held 1,907,964 of cash and cash equivalents. Cash on Hand is above the required target of 10,000.Cash on Hand Cash & EquivalentsCurrent Ratio 2.63:1A measure of liquidity. This measure compares the totals of the current assets and current liabilities. The higher the currentratio, the greater the 'cushion' between current obligations and the business's ability to pay them. Generally a current ratioof 2 or more is an indicator of good short-term financial strength. In other words, the current assets of the business shouldbe at least double the current liabilities. For this period, the current ratio was 2.63:1, down from 3.43:1 last period andabove the minimum target of 2.00
analytics, and deeper insights to help you continue making better business decisions. Here’s a sample of a management report you can create with Smart Reporting access. This is only a preview of what Smart Reporting can offer you. Other key features include: Design customized management reports Track KPIs and business metrics