Transcription
IASSC SIX SIGMA CERTIFICATION EXAMSAMPLE PAPER – BLACK BELTSample Test Questions(Select all applicable answers)Phase 1 ‐ Define Phase1.A Belt is attempting to improve the soldering on a micro‐processor used for a newhand‐held device. As a result he should build a list of Critical to Quality Characteristicsbased on .a. Service benefitsb. Product featuresc. Priced. Size of unit2.A dairy learned through a Lean Six Sigma project their ice cream products could bestored at a temperature 2 degrees higher than they had historically used. Since theirenergy costs for ice cream storage cost 6,000 per month per degree of temperature,what was reported as the savings from this LSS project?a. 72,000b. 144,000c. 432,000d. 720,0003.Producing more than is needed by the next step in the process or more than thecustomer needs is an example of which of the Seven Elements of Waste?a. Overproductionb. Correction (defects)c. Inventoryd. MotionIASSC Six Sigma Black Belt Certification Sample Paper
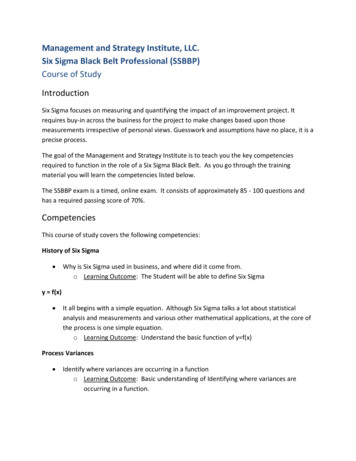
Phase 2 ‐ Measure Phase1.An FMEA is an important tool for a Black Belt. From the list below select the itemsthat best describe the benefits obtained from constructing a FMEA.a. Predict where/when/how failures may occurb. Estimate the severity, occurrence and detection of defectsc. Helps display the procedural order of a processd. Identify ways in which a process can fail to meet customer requirements2.The shape of a Normal Distribution is impacted primarily by two factors which are:a. Sample Errorb. Meanc. Type of Datad. Standard Deviation3.The graphic below depicts a situation where the measurements are:a. Accurateb. Precisec. Accurate and Precised. Neither Accurate or PreciseIASSC Six Sigma Black Belt Certification Sample Paper
Phase 3 ‐ Analyze Phase1.Since 95% of Normally Distributed data is within /‐ 2 Standard Deviations of theMean, then the probability is % that a sample Mean is within /‐ 2 StandardDeviations of the population Mean.a. 30b. 47.5c. 75d. 952.After running some statistical tests, a Belt found that the P‐value was greater then0.05 which indicated:a. There is a difference or relationship with at least 95% confidenceb. There is no difference or relationship with at least 95% confidencec. To reject the Null Hypothesis with a least 95% confidenced. To run five more tests to get 95% confidencee. To change the Null Hypothesis3.A wine distributor hypothesizes that sales average 12,000 per month. A samplereport of 10 months with a Mean of 11,277 was selected. The Standard Deviation is 3,772. Using an alpha of 5 percent, is the distributor statistically confident? Whatare the correct Degrees of Freedom if doing the t‐test?a. 1b. 9c. 10d. 11IASSC Six Sigma Black Belt Certification Sample Paper
Phase 4 ‐ Improve Phase1.Regression Analysis: Tons mined versus Personnel hoursThe Regression Equation is Tons mined 4.359 0.000310 Personnel hoursS 0.0559431R-Sq 39.2%R-Sq(adj) 33.1%Analysis of nWhich statements are correct for the above Regression Analysis?a. This Regression is an example of Simple Linear Regression.b. This Regression is statistically significant because the P‐value is less than 0.05 andthe Residuals are appropriate.c. This Regression is statistically insignificant because R‐squared is much less than 80%.d. The independent variable is “tons mined”.e. If each month was one observation value and 11 months of data was used toanalyze for this Regression.IASSC Six Sigma Black Belt Certification Sample Paper
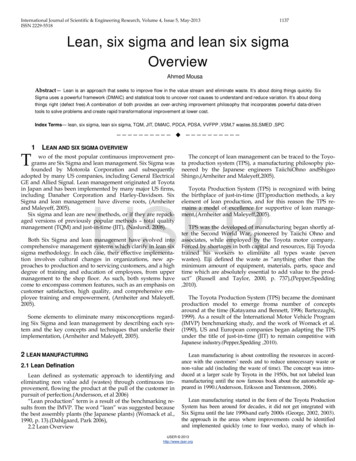
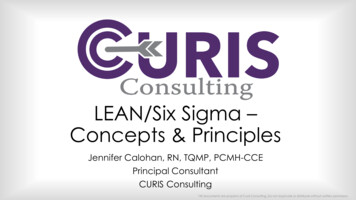
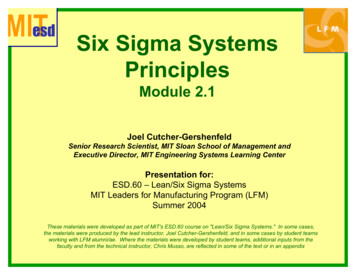
Fitted Line PlotNo. of customers per hour - 0.416 0.1526 Outside temperature 0.04166 Outside Temperature**2Regression95% CI95% PINo. of customers per 00-1002.102030Outside temperature (deg C)40Which statement is incorrect about the above Regression?a. The dependent variable is the outside temperature.b. The Regression is an example of a quadratic equation.c. With at least 95% confidence, we can expect less than 30 customers per hour whenthe outside temperature is 21 deg C.d. If the outside temperature was to increase from 20 to 30 deg C, the number ofcustomers per hour should increase by nearly 20.e. With at least 95% confidence, the retailer would expect less than 10 customers perhour if the temperature outside is less than 5 deg C.f. If the outside temperature was 30 deg C, with at least 95% confidence we wouldexpect less than 50 customers per hour.IASSC Six Sigma Black Belt Certification Sample Paper
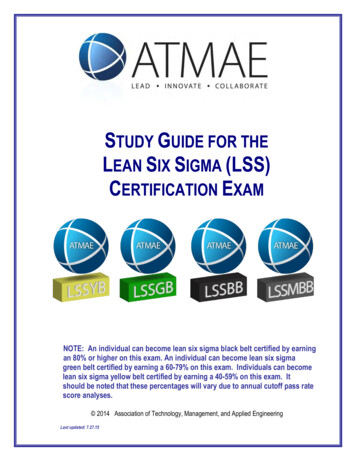
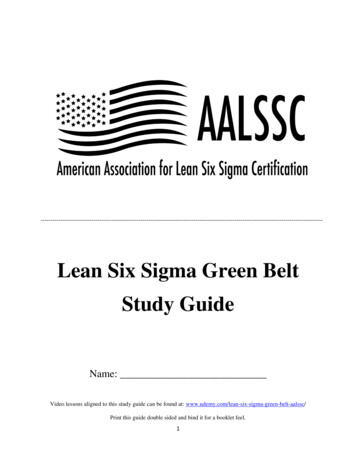
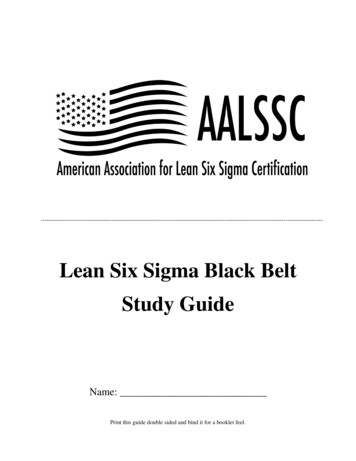
Pareto Chart of the Effects(response is % react, Alpha .10)3.78F actorABCDEBDBDDEEN s PSE 1.8753.Which statements are correct about the Pareto Chart of effects from MINITABTM’sanalysis of an Experimental Design.a. The number of experimental runs is 15 in this experiment.b. Factor B has the largest effect on the output measured in the experiment.c. Factor C has the smallest effect on the output measured in the experiment’s results.d. Main Effects B, D and E and 2‐way interactions BD and DE should be retained in themathematical model if the alpha is set to 10%e. Main Effects B, D, and E and 2‐way interactions BD and DE should be retained in themathematical model if the alpha is set to 90%f. Main Effects C and A and the 2‐way interactions AB, BC, BE, AE, AD, AC and CD, andCD should be retained in the mathematical model if the alpha is set to 10%.IASSC Six Sigma Black Belt Certification Sample Paper
Phase 5 ‐ Control Phase1.Which item is the least descriptive of a properly designed control system using theLean toolbox?a. Balanced and consistent work flow across a processb. Zero inventory of Work In Process (WIP)c. Tidy, organized and maintained office equipment or machineryd. Labeled inventory areas which control the production of material or services2.A characteristic of properly executed SPC includes which of the following:a. Immediate response to an out of control indicationb. After a action to an out of control indication of violating the 3 sigma limits, the nextdata point is just within the 3 sigma limits so another action was taken to furtherreduce the responsec. Plotting the response from the process at the end of the day and then analyzing forout of control conditions and taking actions if still out of controld. Creation of Out of Control Action Plans before using an SPC Chart in the process3.If unsustained results are the case after project closure, what actions should be takento recapture the benefits of the Six Sigma project?a. Contact the Belt no matter where he/she isb. Contact the Belt if still in the same process areac. Reference the Control Plans and key finding in the final reportd. Check to see if the SPC Charts are up to dateIASSC Six Sigma Black Belt Certification Sample Paper
SAMPLE TEST QUESTIONS ANSWER KEYPhase 1 ‐ Define Phase1.BProduct features2.B 144,0003.AOverproductionPhase 2 ‐ Measure Phase1.2.3.APredict where/when/how failures may occurBEstimate the severity, occurrence and detection of defectsDIdentify ways in which a process can fail to meet customer requirementsBMeanDStandard DeviationBPrecisePhase 3 ‐ Analyze Phase1.D952.BThere is no difference or relationship with at least 95% confidence3.B9Phase 4 ‐ Improve Phase1.AThis Regression is an example of Simple Linear Regression.BThis Regression is statistically significant because the P‐value is less than0.05 and the Residuals are appropriate.2.AThe dependent variable is the outside temperature.3.BFactor B has the largest effect on the output measured in the experiment.CFactor C has the smallest effect on the output measured in the experiment’sresults.DMain Effects B, D and E and 2‐way interactions BD and DE should beretained in the mathematical model if the alpha is set to 10%IASSC Six Sigma Black Belt Certification Sample Paper
Phase 5 ‐ Control Phase1.BZero inventory of Work In Process (WIP)2.AImmediate response to an out of control indicationDCreation of Out of Control Action Plans before using an SPC Chart in theprocessCReference the Control Plans and key finding in the final report3.IASSC Six Sigma Black Belt Certification Sample Paper
to recapture the benefits of the Six Sigma project? a. Contact the Belt no matter where he/she is b. Contact the Belt if still in the same process area c. Reference the Control Plans and key finding in the final report d. Check to see if the SPC Charts are up to date