Transcription
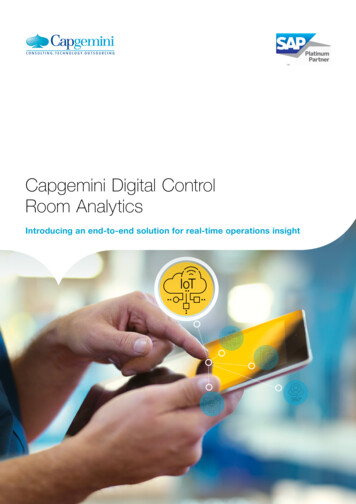
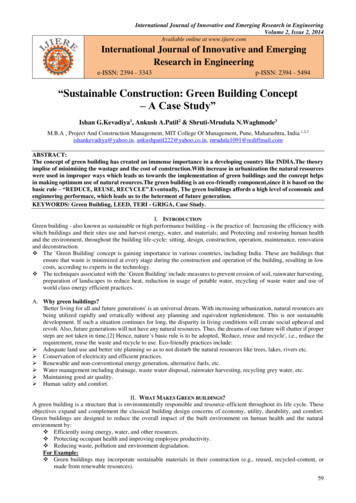
Capgemini case study: building from expertise - using inhouse talent to create a new approach to managing and usingdata.Capgemini employs over 180,000 people across 40 countries and is a globalprovider of consulting, technology and outsourcing services. Built around highlyexperienced and skilled technical experts, the organisation relies fully on theexpertise of its workforce to drive performance and continue its trend of strongfinancial performance.The challenges that Capgemini face aresimilar to those of many operating inthe fluid and uncertain economic andsocial environment in which globalorganisations must now function. For abusiness with such reliance on human,knowledge and intellectual capital, thereis a firm desire from the leadershipteams to understand more about theworkforce, and how they can bemobilised through HR activity, toincrease the productivity andperformance of the business.The business does, however, have totackle some of the common challengesother businesses will recognise, notleast the issue of siloed working, whichcan prevent teams from collaboratingand working more productivelytogether. Nowhere is this truer than inthe HR function, where the differentactivities which the HR teams managesit separately to one another withvarying degrees of overlap andcohesion. This structural and functionalseparation of activity meant that theway teams connect and use data wasalso very different. Reporting was ad‐hoc and piecemeal, and the languagethat the business used to speak aboutwww.valuingyourtalent.compeople concepts was equally disjointed(Figure 1).Keen to draw value from theorganisation’s extensive HR data estate,which was of good quality but siloed, HRBusiness Partner Maja Luckos saw thepotential for an alternative approach atthe CIPD HR Analytics Conference in2014:‘We have always done the same thing, ashave most organisations, which is toreport on the past by producing staticreports, using multiple data systems whichare not integrated. As the systems areseparate, we naturally report in silos; soL&D is reported separately, as isrecruitment etc. Everything is collatedmonthly to review progress against ourKPIs.Everyone produces their own slide whichtells a different story on headcount etc. SoI saw the need to change this because atthe end of the day we’re working as oneorganisation with one set of KPIs and oneHR agenda. I really started thinking, “Howcan we pull it all together into one versionof the truth?”.’Maja Luckos, HR Business Partner1
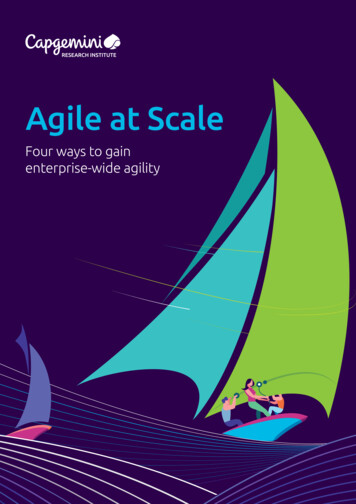
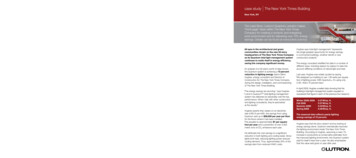
Figure 1: Management of data before the changeMaja’s vision was to enable betterinformed decisions by the business atthe point of action, through acompletely new approach to HRanalytics; to find an alternative tospreadsheets that would use engagingand meaningful visualisations,facilitating dynamic and real‐time datadiscovery driven by the user (Figure 2).Getting started: findingexpertise and experience andbuilding buy-inThe first step on the journey was togenerate an appetite for this newapproach from the HR Directors andconvince them of its achievability.‘I started by approaching the Insights andData team who work with our clients tobuild analytics products and solutions.They were very supportive of thewww.valuingyourtalent.comidea and instantly connected me with Qlik,one of our partners. After discussing ourrequirements, Qlik saw the potential andgave me access to a consultant for acouple of days, free of charge, to build aproof of concept.’ Maja Luckos, HRBusiness PartnerBuilding a proof of concept for the toolwas the first major step in moving fromideas to implementation. Three simpleapplications were built over the courseof the two days with the Qlik consultant,focusing on Attrition, Talent and L&D. Allwere underpinned by the same datafeed from Oracle HR, providing aconsistent picture throughout. It wasimportant to prepare thoroughly beforemeeting with the consultant, organisingthe data and making decisions on thekey areas that would instantly grabattention, in addition to the most criticalKPIs.2
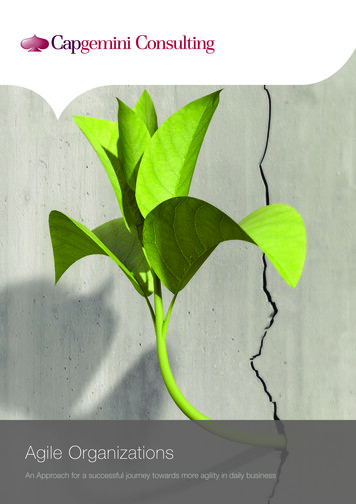
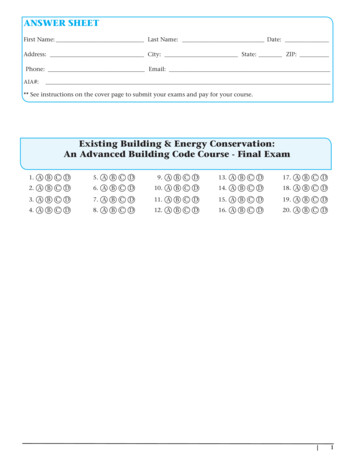
‘Talent was definitely key. We’re quite goodat identifying our talent, using a nine boxgrid that is well established. We designedone example for talent that was dynamicso you could pick and choose differentdimensions, e.g. grade, and theapplication would tell you how many ofthe population were in each position onthe grid (Figure 3). This immediatelyhighlighted some inconsistencies in thedata, which helped to show how useful thetool could be. You could also understandthe succession pipeline; which issomething that the HR Leadership teamliked.’Maja Luckos, HR Business PartnerThe applications were presented to theHR Leadership team and they wereinstantly sold on the approach. Seeingtheir own data presented in this newway really captured their imaginationand they agreed to invest in furtherdevelopment of the tool. The aim wasdefined; to build one applicationcovering all key HR areas; Headcount,Talent Management, Attrition, Career &Employability, Recruitment, Sickness &Absence and L&D.Defining the audience and the users forthe tool was also critical during thisscoping phase. Whilst the HR team knewthat they needed to gain better insightsfrom their people data, there was littleunderstanding of how the tool could beused by other functions. A process ofconsultation was undertaken toascertain exactly how the business mayuse the data, and what format the finaltool should take to deliver the bestinsights.‘There were two intended types of primaryuser for the tool so we initially rolled it outto the HR teams that would benefit mostas they work closely with decision makersin the business, but also eventually wantedto share it with the line managers, teamwww.valuingyourtalent.comleaders and capability leads, who managelarge teams of 50 plus people, so they coulduse the insights to better inform decisions.’Maja Luckos, HR Business PartnerSetting up definitionsThe model had to be able to computedata from various established systemsand data sets which were already wellused across HR and other businessfunctions. Integrating these establishedsystems was a significant undertakingwhich took considerable time:‘We had to include a few different datasets ‐ the biggest one came from ourOracle HR system, which is verycomprehensive and holds good qualitydata. This accounts for around 70% of thedata requirement in the application. Therest came from different data ownersacross other functions – which took a littlelonger as we needed to get their buy‐in tofeed into the process. For example, youhave to get your respective Heads ofTalent, Recruitment, L&D etc. involved andexcited about this as well.’Maja Luckos, HR Business PartnerThen the process of setting updefinitions began. Maja and hercolleagues had to define the measuresthat were to be computed in the system,according to those who were runningthe analytics, and those who would beusing the outputs. Deciding whichelements needed to be measured wasalso an important consideration, asthere are various measures that can beapplied, often for the same concept.Maja recommends focusing on thepriority measures, which can beunderstood more by considering:3
Figure 2: Management of data through QlikView‘Once we had requirements we had to gothrough the process of defining what eachmeasure was, so what recruitment costequals, and the formula you would use tocalculate it. You end up with a long listwhich must be prioritised. I think you haveto constantly challenge yourself; what isthe value in looking at those KPIs? Whyshould we be measuring this process?’Maja Luckos, HR Business PartnerThrough exploring how the businessunderstands specific HR terms, theteam soon realised that there were fewset definitions that ran across allfunctions and HR teams. This meantthere was no common language whentalking about people measures, eitherwithin HR or with colleagues from otherfunctions including finance:‘We found that in some parts of thebusiness the definition for ‘Top Talent’differed to ours. So although we have asimilar 9 box grid, we define two of ourboxes as ‘Top Talent’ while they justwww.valuingyourtalent.cominclude the top right‐hand one. So we hadto factor these differences in so thatanybody could use the tool.’Michelle Steele, HR Business PartnerBuilding the toolOnce the scope, definitions and datafeeds were agreed, the structure of thetool could be put in place. The design ofthe tool was incredibly important as ithad to be easy to use and understand,whilst illustrating data in a clear andcoherent way. The application was builtsection by section by a QlikViewDeveloper, keeping in touch with themain stakeholders throughout. Themain focus was on the data model as itwas the quality of this that would giveusers the freedom to draw real insightsfrom the data. Maja and other teammembers also attended the QlikViewDesigner training course so they couldadapt the tool themselves.4
Figure 3: HR dashboard: Talent 9 box gridFigures provided for illustrative purposes onlyFigure 4: HR dashboard: Top measuresFigures provided for illustrative purposes onlywww.valuingyourtalent.com5
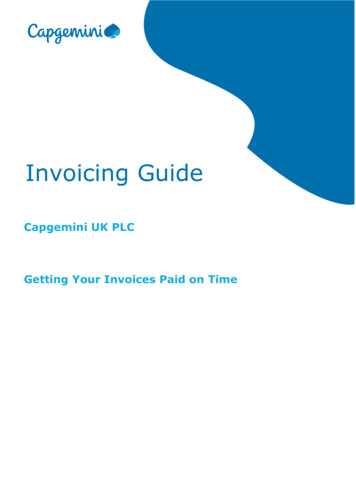
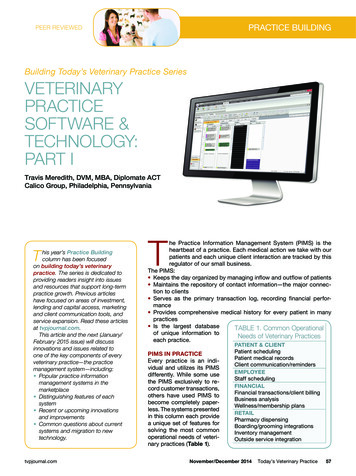
The application consists of onedashboard which illustrates keyperformance indicators, and sevenareas of interest which Maja definedthrough a consultation exercise acrossthe business (Figure 4). She looked tothe different functions that were alreadyusing the data in spreadsheet format toappreciate which particular areasshould be considered as key themes inthe data model.‘The main area of the tool holds the keyperformance indicators, and then linked tothis are seven analysis areas; Headcount,Talent Management, Leavers, Joiners,Recruitment, Sickness & Absence, andLearning & Development.’ Maja Luckos,HR Business PartnerTable 1: Seven analysis areas in the analytics tool:Analysis AreaHeadcountExamples of Indicative Metrics TalentLeaversRecruitmentSickness & absenceLearning &Developmentwww.valuingyourtalent.com Number of FTEs, flexible and part time labourCost of employment: Average Remuneration Cost bygradeGender split (M/F) Population by talent grades (performance andpotential)% talent against total headcount Regretted and non‐regretted leaversManaged leavers – cost and savingTop Talent leaversReasons for leaving – using survey dataLeavers by length of serviceCost of recruitmentAverage cost of hireSource of hire Quality – performance and potential of hires afterone and two years% days lost to sicknessCost of short to medium‐term and long‐termsickness Average days’ sickness per employeeCompletion ratesGlobal hours of training / month & YTDClassroom and virtual hoursCompliance on mandatory training6
The tool was given to users to test assoon as it provided enough informationfor them to draw insights from. Thedecision to go live partway throughdevelopment was taken to explore realfeedback from users and potential userswhilst changes could still beimplemented. This allowed the tool tobecome fit for purpose through realtesting, and to highlight any conflicts fordifferent user groups:‘We spent a long time considering how weshould build different requirements intothe tool, for example, whether we shouldhave different apps for the various usergroups or personalise the talent matrix touser needs. In the end we felt that becausewe could pull all the UK data from most ofthe feeds, it made sense to have one singleapplication so everyone is looking at thesame thing. But it can get complicatedwhen parts of the business have differentdefinitions. In the case of talentmanagement, the long term goal would bethat everybody is using the same matrix ‐ Ithink the application itself might help usget there at some point by encouragingeverybody to work in the same way.’Michelle Steele, HR Business PartnerIntroducing the HR business todata: using the tool to buildcapabilityThe tool was initially launched in onepart of the business (covering the dataof approximately 4,500 employees). Itwas then rolled out country‐wide and istoday active across HR teamsresponsible for around 8,000 employeesin the UK. There are over eighty users inthe HR Community, including HRDs, HRBusiness Partners, operational HRManagers, recruitment partners, andspecific L&D functions. To embed thetool and ensure that it is usedwww.valuingyourtalent.comappropriately across the business, aprogramme of training anddevelopment was rolled out to users asthey explored and used the new system:‘We created some material to help usersunderstand how to use the tool and whatthe outputs show. It is quite intuitive butyou have to understand the data inputsand definitions in detail before discussingit with the business leads. They know theirareas best and will therefore always havequestions about the data. The futureaspiration is to give direct access to themanagers themselves. ’Maja Luckos, HR Business PartnerDriving value: connecting peopleanalytics to real business issuesThrough using the tool, the team hasstarted to explore specific aspects oftheir workforce which they believe willhelp the business to perform. Oneparticular aspect is how attrition differsacross business functions. Theapplication enables teams to cutattrition data according to function androle, and compare across the business.An objective for the year is to ensurethat non‐regretted attrition is managedand regretted attrition remains low.The impact on the business? The HRteam is noticeably more curious aboutthe data that they collect and theperformance of some of the coreprocesses of HR. There is now a muchgreater appetite for the organisation toquestion the efficacy and impact ofcertain HR projects and to share theinsights with the business, to inform anddrive people performance:‘It’s revolutionary for us as anorganisation users kept telling me thatwhat they now get in terms of dataanalysis is amazing. We had a meeting7
with someone who’s worked with ourorganisation in HR for a long time, anddifferent regions across the globe, and shewas stunned by the amount of detail
HR Business Partner Table 1: Seven analysis areas in the analytics tool: Analysis Area Examples of Indicative Metrics Headcount Number of FTEs, flexible and part time labour Cost of employment: Average Remuneration Cost by grade Gender split (M/F)File Size: 677KBPage Count: 10