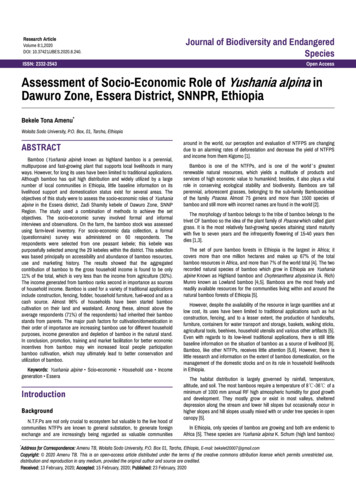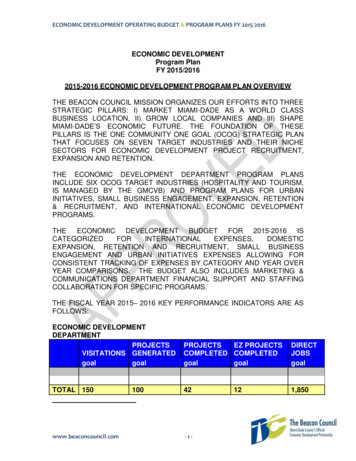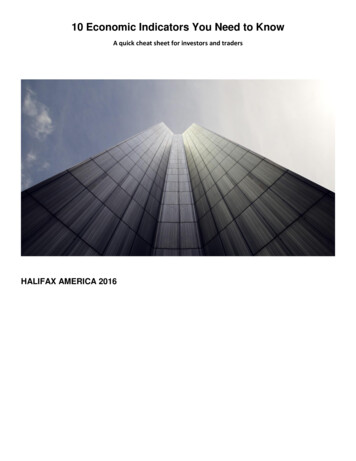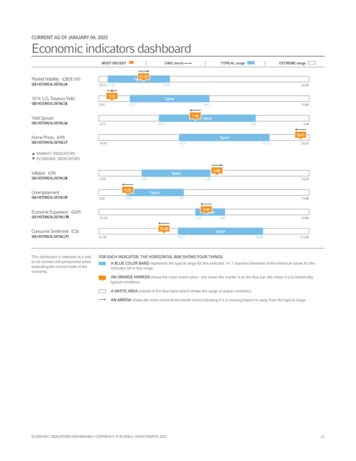
Transcription
Socio - Economic Indicators 2011-2015
Socio - Economic Indicators 2011-2015
Socio - Economic Indicators 2011-2015Table of ContentsPHYSICAL AND DEMOGRAPHIC CHARACTERISTICSLocationExisting Land and Water UsesClimateAdministrative District MapPopulationPopulation PyramidHousehold Population by Religious AffiliationHousehold Population by EthnicityHousehold Population by Age Group and SexHousehold Population 10 years old and Over by Marital Status and SexLabor ForceFamily Income and ExpendituresConsumer Price Index and Inflation RateAnnual/Monthly Capita Poverty ThresholdAnnual/Monthly Per Family Poverty ThresholdPoverty IncidenceECONOMIC ACTIVITIESAgricultural ProductionLivestock and Poultry ProductionFisheryInvestmentsForeign TradeConstructionFinancial InstitutionsBusiness Establishments, Capitalization and EmploymentNumber of Business LinesTourism IndustryTourist Spots and AttractionsAccommodation FacilitiesDistribution of Tourism – Oriented EstablishmentsSOCIAL SERVICESHealthEarly Childhood Care and DevelopmentPrevalence Rate of Malnourished ChildrenEducationNumber of SchoolsEnvironmental ServicesHousing Structures and Lot OwnershipOccupied Housing Units by Construction Materials of the Roof and Outer WallsHousing ServicesPeace and Public SafetyINFRASTRUCTURE AND UTILITIESRoad NetworkWater SupplyPower SupplyCommunication NetworkTelecommunicationsTransportationPUBLIC ADMINISTRATIONTerritorial JurisdictionSeat of GovernmentPUBLIC FINANCESource of FundsStatement of 21212223232425252526262728282930303132333434
Socio - Economic Indicators 2011-2015LOCATIONDavao CityBy AIRBy SEA588 statue miles southeast of Manilaand 241 statue miles to Cebu City971 nautical miles away from Manilaand 593 nautical miles away fromCebu CityBeing the Capital of Davao Region, Davao City is the biggest urban market among thePhilippines’ focus areas in the growth polygon called BIMP-EAGA (Brunei-IndonesiaMalaysia-Philippines East ASEAN Growth Area).1
Socio - Economic Indicators 2011-2015EXISTING LAND AND WATER USESLAND USE, IN HECTARESUrban Use13,054Agriculture73,086Water UseForest24339,917Grassland/Pasture 116,832OthersTotalSource: Comprehensive Land Use Plan, Davao City, 2013 - 2022CLIMATE, 2015Temperature CHighest, May35.4Lowest, March22.0Rainfall (mm)Highest, October275.2Lowest, March19.02868244,000
Socio - Economic Indicators 2011-2015Population, by Geographical LocationDistrict NameAreas (Has.)Poblacion1,138Talomo8,916AgdaoProjected Total d Household 0111,489,1451,483,5903No. of HHs9,508201620152014Projection based on 2.36 annual growth rate of 2.36% (2000-2010)Popn (2015)BuhanginTotalYear# Brgys
Socio - Economic Indicators 2011-2015POPULATIONIndicatorNumber/Percentage2016 Projected Total Population, PSA% Female50.11% Male49.892015, Total Population, Actual Survey, PSA1,632,9912010, Total Population, Actual Survey, PSA1,449,2962010, Household Population, Actual Survey, PSA1,443,890% Female50.04% Male49.96% Children (0-17 y.o.)37.60% Working Age Population (18-64 y.o.)58.73% Old Population (65 y.o.-over)2010, Children, Household Population (0-17 y.o.)3.67542,834% Under 12.24% 1–24.49% 3–56.59% 6 – 1214.14% 13 – 1710.132010, Working Age, Household Population (18-64 y.o.)848,064% Female50.32% Male49.68% 18-3532.70% 36-5923.70% 60-642.342010, Old, Household Population (65 y.o & over)52,992% Female55.64% Male44.362010, Overall Dependency RatioYoung (0 – 17 y.o.)7064Old ( 65 – over)62010, Women of Reproductive Age (15 – 49 y.o.)% to Total Female PopulationSource: Philippine Statistics Authority, Region XIDavao CityOffice of the City Planning andDevelopment Coordinator1,673,832400,21655.392007, Total Population, PSA1,363,3372000, Total Population, PSA1,147,116Average Annual Growth Rate, 2000-201042.36
Socio - Economic Indicators 2011-2015Household Population Pyramid, by AgeGroup, Davao City2016 Projected Total Population 1,673,832Female50.11%838,75865 yrs. and above30,783Male49.89%835,074Old Population(65 and above years old)3.67%61,430Working age492,60165 yrs. and above30,647Working age490,440Working Age(18-64 years 35 years old)34.72%581,155Children315,373Children(0-17 years old)37.60%629,361Note: Projection is based on 2010 actual household population using the averageannual growth rate of 2.36 (2000-2010).Sources: Philippine Statistics Authority, Region XI, Davao CityOffice of the City Planning and DevelopmentCoordinator5Children313,988
Socio - Economic Indicators 2011-2015Household Population, by Religious Affiliation, Davao City, 2010HouseholdPopulationReligious AffiliationTotal1,443,890Roman Catholic including Catholic CharismaticEvangelicals (Philippine Council of Evangelical Churches)IslamIglesia ni CristoOther Religious AffiliationsSeventh Day AdventistJehovah’s WitnessBible Baptist ChurchOther ProtestantsChurch of ChristUnited Church of Christ in the PhilippinesUnited Pentecostal Church(Philippines) IncorporatedTribal ReligiousOther BaptistsChurch of Jesus Christ of the Latter Day SaintsAglipayInternational One Way OutreachJesus is Lord ChurchEvangelical Christian Outreach FoundationNon-Roman Catholic and Protestant ( National Council of Churches in the Philipppines)Missionary Baptist Churches of the PhilippinesBuddhistPhilippine Independent Catholic ChurchFaith Tabernacle Church ( Living Rock Ministries)NoneVictory Chapel Christian FellowshipIglesia sa Dios Espiritu Santo IncorporatedConvention of the Philippine Baptist ChurchLutheran Church of the PhilippinesAssociation of Fundamental Baptist Churches in the PhilippinesUnion Espiritista Cristiana de Filipinas IncorporatedSalvation Army PhilippinesPhilippine Grace GospelAssociation of Baptist Churches in Luzon Visayas and MindanaoPhilippine Benevolent Missionaries AssociationInternational Baptist Missionary FellowshipBread of Life MinistriesCathedral of Praise IncorporatedDoor of FaithIglesia Evangelica Unida de CristoThings to ComeGood News Christian ChurchesPhilippine Ecumenical Christian ChurchPotter’s House Christian 9373321320302157145132119817768686762616
Socio - Economic Indicators 2011-2015HouseholdPopulationReligious AffiliationTotalWay of Salvacion Church Incorporated1,443,89061Jesus is Alive Community Incorporated57Love of Christ International Ministries54UNIDA Evangelical Church50Higher Ground Baptist Mission33Crusaders of the Divine Church of Christ Incorporated32Miracle Revival Church of the Philippines28Philippine Good News Ministries17Not reported2Source: Philippine Statistics Authority, Region XI, Davao CityHousehold Population, by Ethnicity, Davao City, 2010EthnicityHousehold n, Bagobo18,987Mandaya18,163Foreign Ethnicity2,205Others179,091Not Reported4Source: Philippine Statistics Authority, Region XI, Davao CityHousehold Population by Age Group and Sex, Davao City, 2010Age GroupBoth Sexes% to 48,06458.73421,304426,76052,9923.6723,50729,48565 and overSource: Philippine Statistics Authority, Region XI, Davao City7MaleFemale
Socio - Economic Indicators 2011-2015Household Population 10 Years Old and Over by Marital Status and Sex: Davao City, 2010Marital StatusBoth SexesTotalSingle% to Widowed44,9503.969,97234,978Divorced/ Separated15,4541.365,5279,927Common Law/ Live - : Philippine Statistics Authority, Region XI, Davao CityLABOR FORCE, Davao Region, 2011-2015Indicator20112012201320142015Number, 15 years old & overIn the Labor ForceParticipation Rate (%)Employment Rate 394.53,192,0002,058,84064.5Underemployment Rate (%)16.416.117.316.74.64.86.95.514.85.5Unemployment Rate (%)Note: Numbers are based on figures drawn every October of the year. There are no available figures for Labor Force indicators for Davao CitySource: Philippine Statistics Authority, Region XI, Davao CityAnnual Average Family Income and Expenditures, Davao Region, 2012Indicator2012Annual Average Family Income (Php)194,000Annual Average Family Expenditure (Php)156,000Note: Figures are based on a family of five (5).Source: Philippine Statistics Authority, Region XI, Davao City894.5
Socio - Economic Indicators 2011-2015Consumer Price Index and Inflation Rate, Davao City and Davao Region, 2011-2015Davao CityIndicator2011Consumer Price Index, (2000 100)Inflation Rate, (2000 100)Davao 9.7 149.03.62.2Consumer Price Index – an inflationary indicator that measures the change in the cost of a fixed basket of products and services, includinghousing, electricity, food and transportation.Inflation Rate - The percentage increase in the price of goods and services annually.Source: Philippine Statistics Authority, Region XI, Davao CityAnnual and Monthly Per Capita Poverty Threshold, Davao Region, 2009, 2012 and 2015All AreasYearAnnualMonthly 17,040 19,967200920122015 1,426.00 1,664.00 1,886.50 11,319Note: Poverty Threshold is the minimum income / expenditure required for an individual to meet the basic food and non-food requirements.No data available for 2013-2014Source: Philippine Statistics Authority, Region XI, Davao CityAnnual and Monthly per Family Poverty Threshold, Davao Region, 2009 and 2012All AreasYearAnnual 85,197.08 99,837.0020092012Monthly 7,099.76 8,320.00Note: A family is estimated to have 5 members.Source: Philippine Statistics Authority, Region XI, Davao CityPoverty Incidence, 2009, 2012 and 2015Davao CityDavao Region200913.2025.52012nda25Note: Poverty Incidence – the proportion of families with per capita incomes below the poverty threshold.No data available for 2013-2014Source: Small Areas Poverty Estimate (SAE), Philippine Statistics Authority, Region XI, Davao City92015nda20.5
Socio - Economic Indicators 2011-2015ECONOMIC ACTIVITIESAgricultural Production, 2011-2015Commodity20112012201320142015% 520.60(31.06)CEREALSPALAYProduction (m.t.)Area Harvested (ha.)Yield per Hectare(m.t.)RainfedProduction (m.t.)Area Harvested (ha.)Yield per Hectare(m.t.)IrrigatedProduction (m.t.)Area Harvested (ha.)Yield per Hectare(m.t.)CORNProduction (m.t.)Area Harvested (ha.)Yield per Hectare(m.t.)WhiteProduction (m.t.)Area Harvested (ha.)Yield per Hectare(m.t.)YellowProduction (m.t.)Area Harvested (ha.)Yield per Hectare(m.t.)TOP FIVE FRUITCROPS1. BANANAProduction (m.t.)Area Harvested (ha.)Yield per Hectare(m.t.)Banana CavendishProduction (m.t.)Area Harvested (ha.)Yield per Hectare(m.t.)Banana LacatanProduction (m.t.)Area Harvested (ha.)Yield per Hectare(m.t.)10
Socio - Economic Indicators 2011-2015CommodityBanana SabaProduction (m.t.)Area Harvested (ha.)Yield per Hectare(m.t.)2. DURIANProduction (m.t.)Area Harvested (ha.)Yield per Hectare(m.t.)3. PINEAPPLEProduction (m.t.)Area Harvested (ha.)Yield per Hectare(m.t.)4. POMELOProduction (m.t.)Area Harvested (ha.)Yield per Hectare(m.t.)5. MANGOProduction (m.t.)Area Harvested (ha.)Yield per Hectare(m.t.)TOP FIVEVEGETABLES1. EGGPLANTProduction (m.t.)Area Harvested (ha.)Yield per Hectare(m.t.)2. SQUASHProduction (m.t.)Area Harvested (ha.)Yield per Hectare(m.t.)3. AMPALAYAProduction (m.t.)Area Harvested (ha.)Yield per Hectare(m.t.)4. TOMATOESProduction (m.t.)Area Harvested (ha.)Yield per Hectare(m.t.)5. GOURDProduction (m.t.)Area Harvested (ha.)Yield per Hectare(m.t.)TOP FIVE LEAFYVEGETABLES1. CABBAGEProduction 411
Socio - Economic Indicators 2011-2015Area Harvested (ha.)Yield per Hectare(m.t.)2. 4-2015)0.003.66(39.50)Production (m.t.)Area Harvested (ha.)Yield per Hectare(m.t.)3. CAULIFLOWERProduction (m.t.)Area Harvested .17(27.85)CommodityYield per Hectare(m.t.)4. PETCHAY NATIVEProduction (m.t.)Area Harvested (ha.)Yield per Hectare(m.t.)5. PETCHAY CHINESEProduction (m.t.)Area Harvested (ha.)Yield per Hectare(m.t.)20112012201320142015LEGUMES1. STRING BEANSProduction (m.t.)Area Harvested (ha.)Yield per Hectare(m.t.)2. PEANUTProduction (m.t.)Area Harvested (ha.)Yield per Hectare(m.t.)3. HABITCHUELASProduction (m.t.)Area Harvested (ha.)Yield per Hectare(m.t.)ROOT CROPS1. CAMOTEProduction (m.t.)Area Harvested (ha.)Yield per Hectare(m.t.)2. CASSAVAProduction (m.t.)Area Harvested (ha.)Yield per Hectare(m.t.)3. GABIProduction (m.t.)Area Harvested (ha.)Yield per Hectare(m.t.)122,843.453198.91361.80963.77
Socio - Economic Indicators 2011-2015Commodity4. UBEProduction (m.t.)Area Harvested (ha.)Yield per Hectare(m.t.)INDUSTRIAL ANDCOMMERCIAL CROPS1.COCONUTProduction (m.t.)Area Harvested (ha.)Yield per Hectare(m.t.)2. COFFEEProduction (m.t.)Area Harvested (ha.)Yield per Hectare(m.t.)3. RUBBERProduction (m.t.)Area Harvested (ha.)Yield per Hectare(m.t.)4. CACAOProduction (m.t.)Area Harvested (ha.)Yield per ,4397.953,128.406,6230.47Source: Philippine Statistics Authority, Region XI, Davao City132014
Socio - Economic Indicators 2011-2015Livestock and Poultry ProductionInventory of Livestock and Poultry Production, in heads, 20011-2015Type(in heads)20112012201320142015% e / HogsCattleGoatCarabaoDucksPoultrySource: Philippine Statistics Authority, Region XI, Davao City,FisheryFish Production, in metric tons, 2011-2015ProductionMunicipal – Inland 31,155.33Commercial – Deep ture – : Philippine Statistics Authority, Region XI, Davao City14% Change(2014-2015)104.62(30.41)(19.76)(15.02)
Socio - Economic Indicators 2011-2015Investments, in Million Pesos, 2011-2015ProductionDTI-BOIBusiness Bureau – Mayor’sPermitDavao City InvestmentPromotion .692.5213.563.821.38Value of SEC InvestmentCorporationsPartnershipCDA - Authorized CapitalSubscribed CapitalPaid-up CapitalNote: In 2012, there was a moratorium on the giving of incentives to applicants due to the reduction of the City’s IRA.Sources: DT-BOIBusiness Bureau – City Mayor’s OfficeDavao City Investment Promotion CenterCDAForeign Trade, in US Million Dollars, 4.96296.81Balance of TradeSource: Bureau of Customs, Region XI, Davao City15
Socio - Economic Indicators 2011-2015Construction, 2011-201520112012201320142015% Change(2014-2015)Number of Building sment Cost (in million te: The issued building permits include ancillary works such as demolition, fence, sidewalk, excavation and the like. Residential and ancillary work have lower assessment costcompared to that of other uses.Source: City Engineer’s Office, Davao CityFinancial Institutions, 2011-2015Financial Institution2011201220132014% Change(2014-2015)2015Commercial Banks, Industrial Banks,Development Banks1331361501581654.43Financial/Lending Investor5304655625505591.64110108113109109-Money Changers/Dealer of ForeignCurrencies/Forex/Money ,3141,3231,338Insurance, pre-need companies, adjustersSavings & Loans AssociationsSaving Banks, Rural Banks, Thrift BanksOther Financial InstitutionsTotalSource: Business Bureau – City Mayor’s Office, Davao City164.54
Socio - Economic Indicators 2011-2015Business Establishments, Capitalization and Employment, anCalinanMarilogPaquibatoTalomoTorilTugbokNo Brgy. ClassificationDavao City2013Issued PermitsCapitalizationNo. of 1,098,856,197.80146,331Source: Business Bureau – City Mayor’s Office, Davao inanMarilogPaquibatoTalomoTorilTugbokNo Brgy. ClassificationDavao CityIssued Permits2014CapitalizationNo. of 6.70161,571Source: Business Bureau – City Mayor’s Office, Davao City17
Socio - Economic Indicators anCalinanMarilogPaquibatoTalomoTorilTugbokNo Brgy. ClassificationDavao City2015CapitalizationIssued PermitsNo. of 06234,192213,890,415,091.56179,903Source: Business Bureau – City Mayor’s Office, Davao CityBusiness Establishments, Capitalization and Employment, by Type of Business, 2015Type of BusinessMicroSmallIssued Permits31,126Capitalization14,117,541,772.46No. of 346,70334,192213,890,415,091.56179,903Davao CitySource: Business Bureau – City Mayor’s Office, Davao City18
Socio - Economic Indicators 2011-2015Number of Business Lines, 2011-2015Business CategoryAnnual Fixed Fee (AFF)-trucks for hauling, tourist buses, golf carts,motorized banca, car for hire and other transportationsAmusement Places (AMS)-bowling estab., bar, club, videoke,theater, resort and other amusement placesBrewers, Distillers, Rectifiers, Compounders (BDC)Business Fixed Tax (BFT)-delivery services such as trucks, vans jeepneysand other delivery vehiclesConcessionaire (CON)Dwelling Places, Commercial (DWL)* Boarding houses, lodging houses and dormitories* Hotels (5 to 3 star)* Hotels below 3-star, apartelles, pension inn* Motels, Drive-inn* Other Commercial Dwelling PlacesFinancial Institutions (FIN) – Banks, pawnshops, lendinginstitutions, money shops, insuranceFlammable, combustible, explosive (FCE)-storage of gasoline, LPG,diesel oil 6Food Handlers (FH)-carenderia, restaurant, refreshment parloretc.Franchise Holder (FCH)Lessors, Dealers, Brokers of Real State (LDB)Medical Establishments (MDE)-Medical Clinics, Hospitals,LaboratoriesMemorial Parks and Private Cemeteries (MEP)Manufacturers (MFG)Mining Products (MIN)Peddler of General merchandise (PED)Private/public owned market (POM)Printing and Publication (PP)Producers/Processor (PRO)Retailers (RET)Services (SRV)Subdivision Owner (SUB)Transloading (TRN)-Trucking ServicesWholesalers, Distributor, Dealer (WDD)Grand 15862425,13210,922371945,57859,5525663,898Note: The number of business lines shall not be understood as also the number of business establishments. A business establishment may have one or more business lines.Source: Business Bureau, City Mayor’s Office, Davao City19
Socio - Economic Indicators 2011-2015Tourism Industry, 2011-2015Tourist ArrivalsForeignBalikbayan/Overseas FilipinosLocal/DomesticTotalAverage Length of Stay (no. of days)Average Daily Expenditures (Php/day)Estimated Tourist Receipts (Php Estimated Economic Benefits .2333.1150.3137.7057.7222.92Source: City Tourism Operations Office, Davao CityTourist Spots and Attractions, ial 013109291159261810131093Source: City Tourism Office, Davao .10
Socio - Economic Indicators 2011-2015Accommodation Facilities, 2011-2015IndicatorHotelsNo. of RoomsInns / PensionNo. of RoomsResortsNo. of RoomsOther Dwellings / Accommodations/ Boarding housesNo. of RoomsTotal No. of Accommodation FacilitiesTotal No. of rce: City Tourism Office, Davao CityDistribution of Tourism-Oriented Establishments, tion/Tourist FacilitiesRestaurant/Dining and nt vention FacilitiesShopping Centers, Handicrafts and Delicacy StoresTour Operators and Travel AgenciesMoney 424113265681,6426664140591,643TotalSource: City Tourism Office, Davao City212015
Socio - Economic Indicators 2011-2015SOCIAL SERVICESVital Health Statistics, 2011-2015Indicator201120122013% Change/Change in %Points 27.910.63**25264.00*Vital StatisticsTotal Livebirths31,71433,40544,150Birth Deliveries, average per day8891120Crude Birth Rate per 1,000 population21.0021.6227.97Deaths, average per day21.432225Crude Death Rate per 1,000 population5.105.355.715.905.81(0.09)**Infant Mortality Rate per 1,000 Livebirths11.9211.949.068.899.510.62**Under Five Mortality Rate per 1,000 Livebirths30.66.2813.6812.7112.45(0.26)**Maternal Mortality Rate per 1,000 Livebirths0.440.380.810.850.55(0.30)**Infants (per 1,000 Livebirths)12.95.047.118.296.54(1.75)**All Ages (per 1,000 Population)27.4653.7069.2574.8754.23(20.64)**% Births Delivered in Health facilities81.483.1086.7084.8088.94.10**% Deliveries by Skilled Births ion, FIC, 0-11 mos.91.575.5074.1080.2684.003.74**% Fully Immunized Mothers (FIM)49.977.9067.5062.0061.00(1.00)**% Contraceptive Prevalence Rate57.860.4062.0061.0043.0(18.00)**Prevalence Rate of Malnourished Children(0-5years old)5.265.774.804.453.68(17.30)**% Households with access to potable water96.9498.2498.6598.7698.800.04**% Households with sanitary toilets84.7487.8088.6089.8990.00.11**Number of Health Centers / Stations1871901901901910.53*Morbidity Rate***% ChangeChange in % PointsSource: City Health Office, Davao City22
Socio - Economic Indicators 2011-2015Prevalence Rate of Malnourished Children, Weight forper age, 0-71 Months, by District, 2010-2014Prevalence Rate (weight per vao CityTotalMalnourishedChildren9,2898,109Source: City Health Office, Davao CityEarly Childhood Care and Development, Davao City, 2011-2015Early Childhood CareDay Care CentersHome-basedMobile ECCD20112012201320142015% 24256011121646680682673668Day Care 3526,373(0.74)14.1014.7013.51Day Care Workers646660660657654(0.46)11111-8115.712-47Total Number of Day Care CentersDCW per CenterAverage Enrollees per Class/Shift per DCC424859Number of Classes/Shift per DCC222702Number of Child Focused Centers39384247Source: City Social Services Development Office, Davao City23551109
Socio - Economic Indicators 2011-2015Education 97276,01577,32083,69982,455% 8.99% r – Pupil / 28Classroom – Pupil /Student ture – Pupil 41:1.30Textbook – Pupil / Student Ratio--1:11:1.5--1:1Performance Indic
Socio -Economic Indicators 2011-2015 Year Projected Total Population Projected Household Population 2016 1,673,832 1,667,588 2015 1 ,635 147 629 048 2014 1,597,356 1 ,591 398 2013 1,560,439 1 ,554 618 2012 1,524,375 1 ,518 689 2011 1,489,145 1 ,483 590 3 Project
