Transcription
Technical Indicators Tutorial - Forex Trading, Currency Forecast, FX Trading Signal, Forex Training Cour. Page 1Technical Indicators TutorialTechnical Analysis Articles Written by TradingEducation.com Technical Indicators TutorialPrice is the primary tool of technical analysis because it reflects every factor affecting the value of a market. However, pricedoesn't produce just trend lines and basic chart patterns. Analysts have expanded their research far beyond those basicelements to develop a number of technical indicators that provide more insight into price action than what you see on thesurface. You may be able to see that a market is “extended” (overbought or oversold) just by looking at a bar chart, but anindicator can put a number to it and confirm your thinking.First, a warning about indicators in general. Most analysts do not rely on only one indicator but often use several indicatorstogether to help make a trading decision because of the misleading information one indicator might provide. An oscillatorindicator is not a trading system but only provides helpful insights in certain market conditions.Oscillators tend not to work well in markets that are in a strong trend. They can show a market at either an overbought oroversold reading for an extended period while the market continues to trend strongly. Another example of oscillators notworking well is when a market trades into the upper boundary of a congestion area on the chart and then breaks out on theupside of the congestion area. At that point, it's likely that an oscillator would show the market as being overbought andpossibly generate a sell signal when, in fact, the market is just beginning to show its real upside power.From a list of literally hundreds of technical indicators, we have selected the more popular ones to illustrate what is available.These technical indicators can be put into several categories:Strength and Sentiment IndicatorsAlthough most technical indicators are based on price data and various manipulations of that data, a few are based on othermarket activity. For example, when prices make a move, how many traders are participating and who are they? Volume andopen interest are indicators that reflect some basic numbers about how traders are driving the market, and Commitments ofTraders reports reveal the caliber of participants involved.Volume and open interest - In and of themselves, volume and open interest data may not be that valuable other than toindicate the liquidity of a market. But used in conjunction with price action, these numbers serve as a strength indicator thatcan provide some meaningful verification about the significance of a price move.Volume is the number of transactions in a futures or options on futures contract made during a specified period of time,usually one trading session. One buy and one sell equals a volume of one.Open interest is the total number of futures or options on futures contracts that have not yet been offset or fulfilled bydelivery. It is an indicator of the depth or liquidity of a futures market, which influences the ability to buy or sell at or near agiven price.Open interest can be a little confusing. If a new buyer (a long) and new seller (a short) enter a trade, their orders arematched and open interest increases by one. However, if a trader who has a long position sells to a new trader who wants toinitiate a long position, open interest does not change as the number of open contracts remains the same. If a trader holdinga long position sells to a trader wanting to get rid of his existing short position, open interest decreases by one as there is oneless open contract.Volume and open interest are "secondary" technical indicators that help confirm other technical signals on the charts. If anupside price breakout is accompanied by heavy volume, that is a strong signal that the market may want to continue to movehigher because it indicates more traders jumped on the rising prices. On the other hand, a big upside move or a move to anew high that is accompanied by light volume makes the move suspect and indicates a top or bottom may be near or in place.Also, if volume increases on price moves against the existing trend, then that trend may be nearing an end.To validate an uptrend, volume should be heavier on up days and lighter on down days within the trend. In a downtrend,volume should be heavier on down days and lighter on up days. A general trading rule is that if both volume and open interestare increasing, then the trend will probably continue in its present direction. If volume and open interest are declining, this canbe interpreted as a signal that the current trend may be about to end.Changes in open interest can help a trader gauge how much new money is flowing into a market or if money is flowing out ofa market, a valuable insight in evaluating a trending market. Open interest does have seasonal tendencies – that is, it ishigher at some times of the year and lower at others in many markets. Look at the seasonal average (five-year average) ofopen interest in your analysis.If prices are rising in an uptrend and total open interest is increasing more than its seasonal average, it suggests new moneyis flowing into the market, indicating aggressive new buying, and that is bullish. However, if prices are rising and open interestis falling by more than its seasonal average, the rally is the result of holders of losing short positions liquidating their contracts(short covering) and money is leaving the market. This is usually bearish, as the rally will likely fizzle.Here are two more rules for open interest:Very high open interest at market tops can cause a steep and quick price downturn.Open interest that is building up during a consolidation, or "basing" period, can strengthen the price breakout when ithappens.Commitments of Traders Reports - Open interest can be taken one step further by examining the Commitments of Traders(COT) report issued every Friday afternoon by the Commodity Futures Trading Commission n com content&task view&id 6996&I.05/07/2006 05:58:37 PM
Technical Indicators Tutorial - Forex Trading, Currency Forecast, FX Trading Signal, Forex Training Cour. Page 2COT reports provide a breakdown of the preceding Tuesday's open interest for markets in which 20 or more traders or hedgershold positions equal to, or above, reporting levels established by the CFTC.The report breaks down open interest for large trader positions into "commercial" and "non-commercial" categories.Commercial traders are required to register with the CFTC by showing a related cash business for which futures are used as ahedge. The non-commercial category is comprised of large speculators, mainly commodity funds. The balance of open interestis qualified under the "non-reportable" classification that includes both small commercial hedgers and small speculators.To derive the net trader position for each category, subtract the short contracts from the long contracts. A positive resultindicates a net long position (more longs than shorts). A negative result indicates a net short position (more shorts thanlongs). The results may mean different things in different markets, so it usually takes some experience with COT numbersbefore you can see their value in trading.The most important aspect of the COT report for most traders is the change in net positions of the commercial hedgers. Thepremise of COT analysis is that commercials are the “smart money” because they have a strong record in forecastingsignificant market moves, have the best fundamental supply and demand information and have the ability to move marketsbecause of the large size they trade. That's the side of the market where you want to be.Some traders like to take positions opposite of what the COT report suggests that small traders (non-reportable positions) aredoing, assuming most small speculative traders are usually under-capitalized and/or wrong about the market.Trend IndicatorsTrend lines are the basic indicator of trend, but they are quite subjective, depending on the eye of the beholder. So analystshave refined technical indicators such as moving averages or the directional movement index to quantify the data and smoothout day-to-day fluctuations to present an overall view of price direction and the trendiness of the market.Moving Averages - Perhaps the simplest to understand and most widely used technical indicator is a moving average, whichsmoothes past data to illustrate existing trends or situations where a trend may be ready to begin or is about to reverse. Amoving average helps you spot market direction over time rather than being caught up in short-term erratic marketfluctuations. There are three main types of moving averages:Simple. Each price point over the specified period of the moving average is given an equal weight. You just add the pricesand divide by the number of prices to get an average. As each new price becomes available, the oldest price is droppedfrom the calculation.Weighted. More weight is given to the latest price, which is regarded as more important than older prices. If you used athree-day weighted moving average, for example, the latest price might be multiplied by 3, yesterday's price by 2 and theoldest price three days ago by 1. The sum of these figures is divided by the sum of the weighting factors – 6 in thisexample. This makes the moving average more responsive to current price changes.Exponential. An exponential moving average (EMA) is another form of a weighted moving average that gives moreimportance to the most recent prices. Instead of dropping off the oldest prices in the calculation, however, all past pricesare factored into the current average. The current EMA is calculated by subtracting yesterday's EMA from today's price andthen adding this result to yesterday's EMA to get today's EMA. An EMA generally produces a smoother line than other formsof moving averages, which can be an important factor in choppy market conditions.Closing prices for a period are usually used to calculate a moving average, but you can also use the open, high or low or somecombination of all of them. Moving averages are often used in crossover trading systems. A buy signal occurs when the shortor intermediate-term averages cross from below to above the longer-term average. Conversely, a sell signal is issued when theshort- and intermediate-term averages cross from above to below the longer-term average.Another trading approach is to use the "current price" method. If the current price is above the moving average, you buy.Liquidate that position when the current price crosses below your selected moving average. For a short position, sell when thecurrent price falls below the moving average. Liquidate that position when the current price rises above the average.Because the moving average changes constantly as the latest market data arrive, many traders test different "specified" timeframes before they come up with a series of moving averages that are optimal for a particular market.Some use combinations such as 5-day, 10-day and 20-day moving averages, taking crossovers of the shorter moving averageover the longer moving average as a trading signal. Still others use longer-term moving average lines as another point ofsupport or resistance.In short, moving averages have a number of applications and are easy to understand, making them a clear indicator choicefor many on com content&task view&id 6996&I.05/07/2006 05:58:37 PM
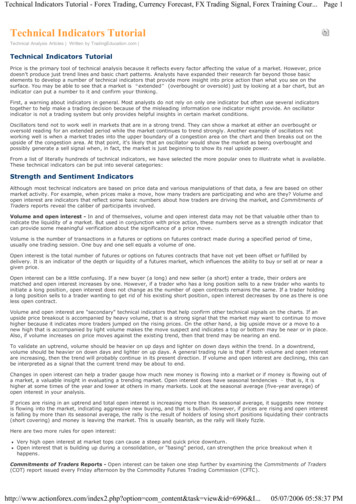
Technical Indicators Tutorial - Forex Trading, Currency Forecast, FX Trading Signal, Forex Training Cour. Page 3Moving Average Convergence Divergence (MACD) - MACD is a more detailed method of using moving averages to findtrading signals from price charts. MACD plots the difference between a longer-term exponential moving average and a shorterexponential moving average (the chart below uses 21 days and 9 days). Then a 9-day moving average of this difference isgenerally used as a trigger line.The MACD indicator is used in three ways:Crossover signals. When the MACD line crosses below the trigger line, it is a bearish signal; when it crosses above it, it'sa bullish signal. Another crossover signal occurs when MACD crosses above or below the zero line.Overbought-oversold. If the shorter moving average pulls away from the longer moving average dramatically, it indicatesthe market may be coming over-extended and is due for a correction to bring the averages back together.Divergence. As with other studies, traders look at MACD to provide early signals or divergences between market prices anda technical indicator. If the MACD turns positive and makes higher lows while prices are still tanking, this could be a strongbuy signal. Conversely, if the MACD makes lower highs while prices are making new highs, this could be a strong bearishdivergence and a sell signal.With its moving average base, MACD is a lagging indicator and requires rather strong price movement to generate a signal.Therefore, it works best in markets that make broad moves but does perform well in choppy, congested trading ption com content&task view&id 6996&I.05/07/2006 05:58:37 PM
Technical Indicators Tutorial - Forex Trading, Currency Forecast, FX Trading Signal, Forex Training Cour. Page 4Directional Movement Index - The Directional Movement Indicator (DMI), also called the Directional Movement System, isused to determine the strength of a market trend. The Average Directional Movement index, or ADX, is part of the DMI andgauges the trendiness of the market. When used with the up and down Directional Indicator (DI) values – Plus DI and MinusDI – you could have a trading system.The basic rules for a DMI system include establishing a long position whenever the Plus DI crosses above the Minu
Volume andopen interest are "secondary" technical indicators thathelp confirm other technical signals on the charts. Ifan upside price breakout is accompanied byheavy volume, that is a strong signal thatthe marketmay want to continue to move higher because itindicates more tradersjumped on the risingprices. On the other hand, a big upside move .
