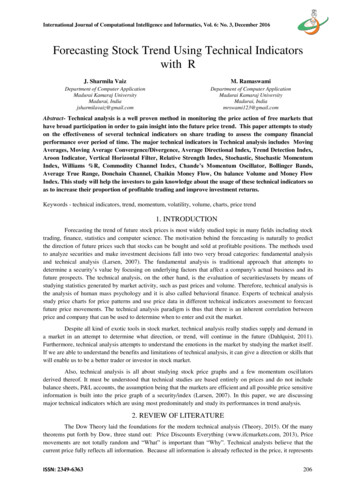
Transcription
Multicollinearity of Technical IndicatorsDr. Rajeev Shuklawww.lifefunetc.comdr rajeevshukla@rediffmail.comInvestrade group, Indore
All my best thoughts were stolen by theancients.― Ralph Waldo E erso Originality is nothing but judicious imitation.The most original writers borrowed one fromanother.― Voltaire
Pure price systems are close enough to theNorth Pole that any departure tends to bringyou farther south.- William Eckhardt
mul·ti·col·lin·ear·i·tynoun \" kəˌlinēˈarə̇tē, -kä-\?The existence of such a high degree ofcorrelationbetweensupposedlyindependent variables being used toestimate a dependent variable that thecontribution of each independent variableto variation in the dependent variablecannot be determined.
John Bollinger"A cardinal rule for the successful use tyamidindicators.Multicollinearity is simply the multiplecounting of the same information. The use offour different indicators all derived from thesame series of closing prices to confirm eachother is a perfect example."
Problems with multicollinearity In some sense, the collinear variables containthe same information about the dependentvariable. If nominally "different" measuresactually quantify the same phenomenon thenthey are redundant. A principal danger of such data redundancy isthat of over-fitting in regression analysismodels.
What indicators to choose?1000 collection of Technical indicators fortrading needs to be simplified and made clear.
Types of indicators (Source: Metastock) Trend indicatorsVolatility indicatorsMomentum indicatorsCycle indicatorsMarket strength indicatorsSupport and resistance indicators(Few indicators may fall in more than one category.)
Trend Indicators (Source: Metastock)IndicatorCreatorIndicatorAroonCommodity Selection IndexDEMADirectional MovementForecast OscillatorLinear Regression IndicatorLinear Regression SlopeLinear Regression TrendlineMACDMoving Averages (allcalculation methods)Parabolic SARPerformancePolarized Fractal EfficiencyChandeWilderMulloyWilderChandePrice OscillatorQstick Indicatorr-squaredRaff Regression ChannelStandard Deviation ChannelStandard ErrorStandard Error BandsAppelWilderHannulaStandard Error ChannelTEMATime Series ForecastTrendlinesVertical Horizontal FilterZig yWhiteMerril
Volatility Indicators (Source: Metastock)IndicatorCreatorReferenceAverage True RangeWilderAverage True RangeBollinger BandsBollingerBollinger BandsCommodity Selection IndexWilderCommodity Selection IndexMoving Average (variable)ChandeVariableODDS Probability ConesFishbackODDS Probability ConesRelative Volatility IndexDorseyRelative Volatility IndexStandard DeviationStandard DeviationStandard Error BandsEquis (Andersen)Standard Error BandsVolatility, Chaikin'sChaikinVolatility, Chaikin'sVolatility, OptionBookstaberOption Volatility
Momentum Indicators (Source: Metastock)IndicatorAccumulation SwingIndexChande MomentumOscillatorCommodity ChannelIndexDynamic MomentumIndexIntraday MomentumIndexLinear Regression ceAccumulation SwingIndexChande MomentumOscillatorCommodity ChannelIndexDynamic MomentumIndexIntraday MomentumIndexLinear RegressionSlopeIndicatorRandom Walk IndexRange IndicatorRelative MomentumIndexRelative Strength IndexStochastic MomentumIndexStochastic OscillatorSwing IndexCreatorPoulusReferenceRandom Walk IndexWeinberg Range IndicatorRelative MomentumIndexRelative StrengthWilderIndexStochasticBlauMomentum IndexAltmanLaneWilderStochastic OscillatorSwing IndexMACDAppel MACDTRIXunknown TRIXMass IndexDorsey Mass IndexUltimate OscillatorWilliams Ultimate OscillatorWilliams' %RWilliams Williams' %RWilliams' Accumulation/DistributionWilliams'Williams Accumulation/DistributionMomentum IndicatorMomentumPrice OscillatorPrice OscillatorPrice Rate-Of-ChangeAppel Price Rate-Of-Change
Cycle Indicators (Source: Metastock)IndicatorCycle LinesReferenceCycle LinesDetrended Price OscillatorDetrended Price OscillatorFibonacci Time ZonesTime ZonesFourier TransformFourier TransformMESA Sine Wave IndicatorCreatorEhlersMESA Sine Wave
Market Strength Indicators (Source: tributionNegative VolumeIndexFosbackDemand IndexSibbetDemand IndexOn Balance VolumeGranvilleChaikin Money FlowChaikinChaikin OscillatorChaikinEase of MovementArmsEase of MovementPrice Volume TrendHerrick Payoff IndexHerrickHerrick PayoffIndexTrade Volume IndexKlinger OscillatorKlingerKlinger OscillatorMoney Flow IndexMoving Average(volume adjusted)Chaikin MoneyFlowChaikin A/DOscillatorQuong/SoudMoney Flow IndexackMoving AverageArmsCalculationMethodsOpen InterestPositive VolumeIndexVolumeReferenceNegative VolumeIndexOn BalanceVolumeOpen InterestFosbackEquis(Slauson)Positive VolumeIndexPrice VolumeTrendTrade VolumeIndexVolumeVolume OscillatorVolume OscillatorVolume Rate-OfChangeVolume Rate-OfChange
Support & Resistance Indicators (Source: Metastock)IndicatorCreatorReferenceAndrews' PitchforkAndrewsAndrews' PitchforkEnvelopeFibonacci Arcs, Fans,RetracementsGann Lines, Fans, GridsEnvelopeFibonacci StudiesGannGann StudiesProjection BandsWidnerProjection BandsProjection OscillatorWidnerProjection OscillatorQuadrant LinesQuadrant LinesSpeed Resistance LinesSpeed Resistance LinesTirone LevelsTrendlinesTironeTirone LevelsTrendlines
Advantages of unrelatedindicators The best regression models are those in which thepredictor variables each correlate highly with thedependent (outcome) variable but correlate at mostonly minimally with each other. Such a model is often called "low noise" and will bestatistically robust (that is, it will predict reliablyacross numerous samples of variable sets drawnfrom the same statistical population).
Use complimentary indicators To avoid the problems associated withmulticollinearity, traders should selectindicators that work well with, orcomplement, each other without providingredundant results.
Few combinations suggested Standard deviation MACD OBV
Few combinations suggested MA crossover MFI
Few combinations suggested Bollinger bands RSI Volume Oscillator
Few combinations suggested PSAR ROC Trendlines
Few combinations suggested PSAR MFI Trendlines
A word about Market BreadthIndicators Arms Index (TRIN)Advance-Decline LineAdvance-Decline Volume LineBullish Percent IndexHigh-Low IndexMcClellan OscillatorMcClellan Summation IndexNet New HighsPercent Above Moving AverageRecord High PercentVolatility Index (VIX)
Eccentric indicators (Bizarre!)Just for fun!!! (Source:CNBC) Hemline/Skirt Length IndicatorSuper Bowl IndicatorBillboard Top 100 IndicatorSports Illustrated Swimsuit CoverThe Big Mac IndexLipstick Indicator/Lipstick Effect
Take home message Use optimization and backtesting but avoidoveroptimization as past never equals future. Technical analysis deals in probabilities rather thancertainties. There is no combination of indicatorsthat will accurately predict the markets' moves 100%of the time. While too many indicators, or the incorrect use ofindicators, can blur a trader's view of the markets,traders who use technical indicators carefully andeffectively can more accurately pinpoint highprobability trading set-ups, increasing their odds ofsuccess in the markets.
Suggested Reading Technical Analysis of the Financial Markets: AComprehensive Guide to Trading Methods andApplications (New York Institute of Finance) John J. Murphy Technical Analysis of Stock Trends - JohnMagee Technical Analysis: The Complete Resource forFinancial Market Technicians -Charles D.Kirkpatrick II, Julie Dahlquist
A special thanks Investrade group, Indore and my dear friendsNareshji, Deveshji and Himanshuji for theirhelp and cooperation. ATMA for allowing me to speak on thisplatform.
Every battle is wonbefore it is ever fought.—Sun Tzu
THANK YOU
indicators The best regression models are those in which the predictor variables each correlate highly with the dependent (outcome) variable but correlate at most only minimally with each other. Such a model is often called "low noise" and will be statistically robust (that is, it will predict reliably across numerous samples of variable sets drawn from the same statistical population). Use .