Transcription
Software Metrics1.Lord Kelvin, a physicist2.George Miller, a psychologist
Software MetricsProduct vs. processMost metrics are indirect:No way to measure property directly orFinal product does not yet existFor predicting, need a model of relationship of predicted variablewith other measurable variables.Three assumptions (Kitchenham)1. We can accurately measure some property of software or process.2. A relationship exists between what we can measure andwhat we want to know.3. This relationship is understood, has been validated, and can beexpressed in terms of a formula or model.Few metrics have been demonstrated to be predictable or relatedto product or process attributes.
Software Metrics (2).CodeStaticDynamicProgrammer CostDuration, timeStaffing
Code MetricsEstimate number of bugs left in code.From static analysis of codeFrom dynamic executionEstimate future failure times: operational reliability
Static Analysis of CodeHalstead’s Software Physics or Software Sciencen1 no. of distinct operators in programn2 no. of distinct operands in programN1 total number of operator occurrencesN2 total number of operand occurrencesProgram Length: N N1 N2Program volume: V N log 2 (n1 n2)(represents the volume of information (in bits) necessaryto specify a program.)Specification abstraction level: L (2 * n2) / (n1 * N2)Program Effort: E (n1 N2 * (N1 N2) * log2 (n1 n2)) / (2 * n2)(interpreted as number of mental discrimination requiredto implement the program.)
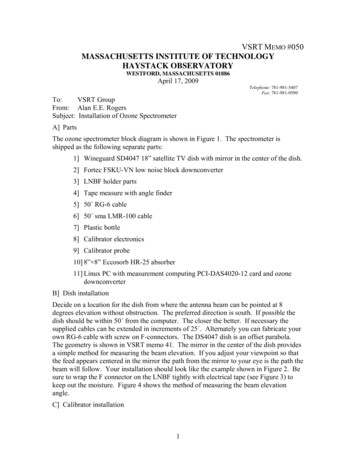
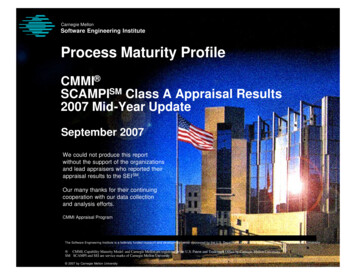
McCabe’s Cyclomatic ComplexityHypothesis: Difficulty of understanding a program islargely determined by complexity of control flow graph.Cyclomatic number V of a connected graph G is thenumber of linearly independent paths in the graph ornumber of regions in a planar graph.R1R2R3R5R4Claimed to be a measure of testing diffiiculty andreliability of modules.McCabe recommends maximum V(G) of 10.
Static Analysis of Code (Problems)Doesn’t change as program changes.High correlation with program size.No real intuitive reason for many of metrics.Ignores many factors: e.g., computing environment,application area, particular algorithms implemented,characteristics of users, ability of programmers,.Very easy to get around. Programmers may introducemore obscure complexity in order to minimizeproperties measured by particular complexity metric.
Static Analysis of Code (Problems con’t)Size is best predictor of inherent faults remainingat start of program test.One study has shown that besides size, 3 significantadditional factors:1. Specification change activity, measured in pages ofspecification changes per k lines of code.2. Average programmer skill, measured in years.3. Thoroughness of design documentation, measuredin pages of developed (new plus modified) designdocuments per k lines of code.
Bug Counting using Dynamic MeasurementEstimate number remaining from number found.Failure count modelsError seeding modelsAssumptions:Seeded faults equivalent to inherent faults indifficulty of detection.A direct relationship between characteristics andnumber of exposed and undiscovered faults.Unreliability of system will be directly proportionalto number of faults that remain.A constant rate of fault detection.
Bug Counting using Dynamic Measurement (2)What does an estimate of remaining errors mean?Interested in performance of program, not in howmany bugs it contains.Most requirements written in terms of operationalreliability, not number of bugs.Alternative is to estimate failure rates or futureinterfailure times.
Estimating Failure RatesInput-Domain Models: Estimate program reliabilityusing test cases sampled from input domain.Partition input domain into equivalence classes,each of which usually associated with a program path.Estimate conditional probability that program correctfor all possible inputs given it is correct for a specifiedset of inputs.Assumes outcome of test case given information aboutbehavior for other points close to test point.Reliability Growth Models: Try to determine futuretime between failures.
Reliability Growth ModelsSoftware Reliability: The probability that a programwill perform its specified function for a stated timeunder specified conditions.Execute program until "failure" occurs, the underlyingerror found and removed (in zero time), and resumeexecution.Use a probability distribution function for the interfailuretime (assumed to be a random variable) to predict futuretimes to failure.Examining the nature of the sequence of elapsed timesfrom one failure to the next.Assumes occurrence of software failures is a stochasticprocess.
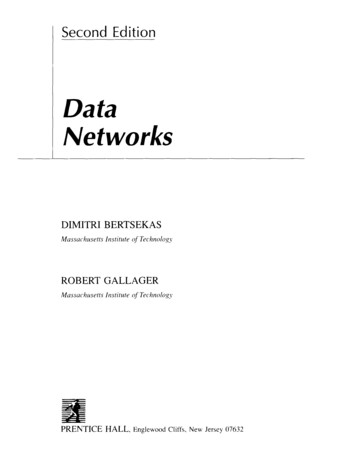
Software UncertaintyAssumption: The mechanism that selects successiveinputs during execution is unpredictable (random).Input space IIFProgram pOFOutput space OO F is the image set of I F under the mapping p
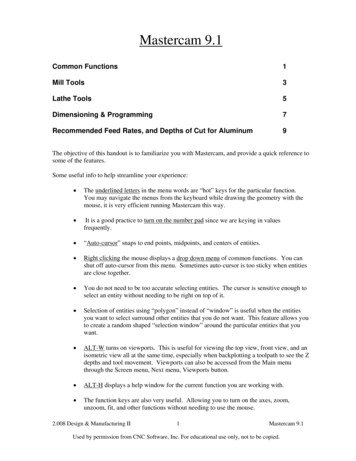
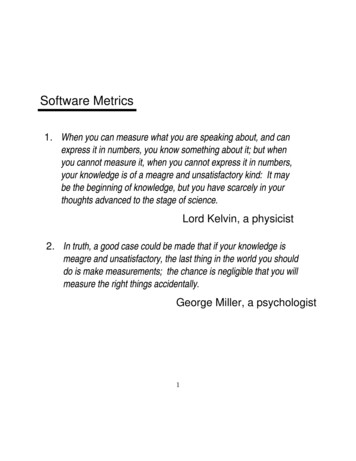
Sample Interfailure Times Execution time in seconds between successive failures.(Read left to right in rows). 1511415300135174837910118681435245223321
Using the 0200405060708090 100 110 120 130Different models can give varying results for the samedata; there is no way to know a priori which modelwill provide the best results in a given situation.‘‘The nature of the software engineering process is toopoorly understood to provide a basis for selecting aparticular model."
Problems with Software Reliability ModelingThere is no physical reality on which to base our assumptions.Assumptions are not always valid for all, or any, programs:Software fault (and failures they cause) are independent.Inputs for software selected randonly from an input space.Test space is representative of the operational input space.Each software failure is observed.Faults are corrected without introducing new ones.Each fault contributes equally to the failure rate.Data collection requirements may be impractical.
Software Requirements MetricsFairly primitive and predictive power limited.Function PointsCount number of inputs and output, user interactions, externalinterfaces, files used.Assess each for complexity and multiply by a weighting factor.Used to predict size or cost and to assess project productivity.Number of requirements errors found (to assess quality)Change request frequencyTo assess stability of requirements.Frequency should decrease over time. If not, requirementsanalysis may not have been done properly.
Programmer Productivity MetricsBecause software intangible, not possible to measure directly.If poor quality software produced quickly, may appear to be moreproductive than if produce reliable and easy to maintain software(measure only over software development phase).More does not always mean better.May ultimately involve increased system maintenance costs.Common measures:Lines of source code written per programmer month.Object instructions produced per programmer month.Pages of documentation written per programmer month.Test cases written and executed per programmer month.
Programmer Productivity Metrics (2)Take total number of source code lines delivered and divide bytotal time required to complete project.What is a source line of code? (declarations? comments? macros?)How treat source lines containing more than a single statement?More productive when use assembly language? (the more expressivethe language, the lower the apparent productivity)All tasks subsumed under coding task although coding time representssmall part of time needed to complete a project.Use number of object instructions generated.More objective.Difficult to estimate until code actually produced.Amount of object code generated dependent on high-levellanguage programming style.
Programmer Productivity Metrics (3)Using pages of documentation penalizes writers who take time toexpress themselves clearly and concisely.So difficult to give average figure.For large, embedded system may be as low as 30 lines/programmer-month.Simple business systems may be 600 lines.Studies show great variability in individual productivity. Best aretwenty times more productive than worst.
Software Design MetricsNumber of parametersTries to capture coupling between modules.Understanding modules with large number of parameters willrequire more time and effort (assumption).Modifying modules with large number of parameters likely to haveside effects on other modules.Number of modules.Number of modules called (estimating complexity of maintenance).Fan-in: number of modules that call a particular module.Fan-out: how many other modules it calls.High fan-in means many modules depend on this module.High fan-out means module depends on many other modules.Makes understanding harder and maintenance more time-consuming.
Software Design Metrics (2)Data BindingsTriplet (p,x,q) where p and q are modules and X is variablewithin scope of both p and qPotential data binding:- X declared in both, but does not check to see if accessed.- Reflects possibility that p and q might communicate through theshared variable.Used data binding:- A potential data binding where p and q use X.- Harder to compute than potential data binding and requires moreinformation about internal logic of module.Actual data binding:- Used data binding where p assigns value to x and q references it.- Hardest to compute but indicates information flow from p to q.
Software Design Metrics (3)Cohesion metricConstruct flow graph for module.- Each vertex is an executable statement.- For each node, record variables referenced in statement.Determine how many independent paths of the module go throughthe different statements.- If a module has high cohesion, most of variables will be used bystatements in most paths.- Highest cohesion is when all the independent paths use all thevariables in the module.
Management MetricsTechniques for software cost estimation1. Algorithmic cost modeling:Model developed using historical cost information thatrelates some software metric (usually lines of code) toproject cost.Estimate made of metric and then model predicts effort required.The most scientific approach but not necessarily the mostaccurate.2. Expert judgement3. Estimation by analogy: useful when other projects in samedomain have been completed.
Management Metrics (2)4.Parkinson’s Law: Work expands to fill the time available.Cost is determined by available resourcesIf software has to be developed in 12 months and you have5 people available, then effort required is estimated to be 60person months.5.Pricing to win: estimated effort based on customer’s budget.6.Top-down estimation: cost estimate made by considering overallfunction and how functionality provided by interacting sub-functions.Made on basis of logical function rather than the componentsimplementing that function.7.Bottom-up function: cost of each component estimated and thenadded to produce final cost estimate.
Algorithmic Cost ModelingBuild model by analyzing the costs and attributes of completed projects.Dozens of these around -- most well-known is COCOMO.Assumes software requirements relatively stable and project will bewell managed.Basic COCOMO uses estimated size of project (primarily in termsof estimated lines of code) and type of project (organic, semi-detached,or embedded).Effort A * KDSI bwhere A and b are constants that vary with type of project.More advanced versions add a series of multipliers for other factors:product attributes (reliability, database size, complexity)computer attributes (timing and storage constraints, volatility)personnel attributes (experience, capability)project attributes (use of tools, development schedule)and allow considering system as made up of non-homogeneoussubsystems.
Evaluation of Management MetricsParameters associated with algorithmic cost models are highlyorganization-dependent.Mohanty: took same data and tried on several models. Estimatesranged from 362,000 to 2,766,667.Another person found estimates from 230 person-months to3857 person-months.Relies on the quantification of some attribute of the finishedsoftware product but cost estimation most critical early inproject when do not know this number.Lines of code: very difficult to predict or even define.Function points:- Heavily biased toward a data processing environment- Assessment of complexity factors leads to wide variationsin estimates.
Evaluation of Management Metrics (2)Value of parameters must be determined by analysis of historicalproject data for organization. May not have that data or may nolonger be applicable (technology changes quickly).Need to be skeptical of reports of successful usage of these models.Project cost estimates are self-fulfilling: estimated often used todefine project budget and product adjusted so that budget figureis realized.No controlled experiments.Some interesting hypotheses (that seem to be well accepted):Time required to complete a project is a function of total effortrequired and not a function of number of software engineers involved.- A rapid buildup of staff correlates with project schedule slippages- Throwing people at a late project will only make it later.
Evaluation of Management Metrics (3)Programmer ability swamps all other factors in factor analyses.Accurate schedule and cost estimates are primarily influenced bythe experience level of those making them.Warning about using any software metrics:Be careful not to ignore the most important factors simplybecause they are not easily quantified.
Software Metrics Product vs. process Most metrics are indirect: No way to measure property directly or Final product does not yet exist For predicting, need a model of relationship of predicted variable with other measurable variables. Three assumptions (Kitchenham) 1. We can accurately measure some property of software or process. 2.File Size: 224KB