Transcription
Paper SAS3337-2019SCORE! Techniques for Scoring Predictive Regression ModelsUsing SAS/STAT SoftwarePhil Gibbs and Randy Tobias, SAS Institute Inc.ABSTRACTScoring new data to compute predictions for an existing model is a fundamental stage in theanalytics life cycle. This task has never been easier, given recent additions to SAS/STAT syntax. This paper shows how to use these new features in SAS/STAT software to make itsimple to predict the response for new data. The paper discusses practical applications forscoring with the SCORE statement within a modeling procedure, with the PLM procedureusing a stored model fit, and with the CODE statement in the DATA step. The paper alsodiscusses tried-and-true methods of scoring using the SCORE procedure and using themissing-value-for-the-response trick.INTRODUCTIONOne of the most sought-after skills for a statistician is knowing how to create predictiveregression models. This skill is also the core piece of the analytics life cycle. The key reasonfor developing a predictive regression model is to predict the response for data that is notobserved in the model’s training data set. Also known as model scoring, this prediction forunobserved data is a necessary element of evaluating the model.This prediction also could be done for evaluating the model fit or for validating the modelwith a new set of data for which the response is known. You can score a simple in-sampleprediction of combinations of the independent variables that are not observed. Finally,scoring can be used for simple out-of-sample forecasting to predict the future.This paper covers the most common ways to score with a predictive regression model inSAS/STAT software. You will learn how to use methods, such as the SCORE and CODEstatements, that are part of individual SAS procedures. Although the SCORE statementscores observations when the model is fit, the CODE statement works with a subsequentSAS DATA step to perform the scoring. The new STORE statement and the PLM procedurecan score observations after a procedure creates a model without going through theexpense of refitting. You will learn about older techniques, such as using macro variables toscore a regression model yourself, as well as the tried-and-true technique of computingpredictions by inserting data with missing values for the response. Finally, this paper brieflydescribes scoring models in SAS Viya software.WHAT IS SCORING?What exactly is scoring? Scoring is the task of producing predictions from a predictivemodel. Scoring requires three things:1. a predictive model, that is, a mathematical method f(x,θ) for combining values ofpredictor variables x with values of certain quantities θ (also called the parameters ofthe model) in order to produce a predicted value for a target or response variable2. specific values of the predictor variables x3. specific values of the parameters θ1
Predictive models can range from the simple to the complex. A model can be as simple as alinear regression or can become quite complex with the involvement of multivariateadaptive regression splines.A simple linear model is just a linear combination of model variable and parameter values:f(x,θ) θ0 x1*θ1 . xp*θpTo score this model, all you need to know are the predictors and the parameters. PROCSCORE is a nice tool for working with this type of model.With a more complicated model, more work needs to be done. A general linear model canbe viewed as a linear combination of functions f i(x) of the predictors:f(x,θ) f 1(x)*θ1 . f p(x)*θpSAS provides several methods for packaging up these functions into a form that allows forthe creation of predicted values.Something that you need to consider in deciding how to score is when the data will bescored. Some SAS/STAT techniques for scoring data work at the time the model is fit. Othertechniques can be used to score new data after the model is fit, even when the original datais no longer available.Table 1 shows the methods for scoring that are discussed in this paper (the methods arelisted from the most general to the most specific).MethodMissingresponse trickPROC SCORESCOREstatementPROC PLMCODEstatementWhatAll model typesWhenFit timeLinearregressionMany modeltypesMany modeltypesMany modeltypesAny timeHowRequires preprocessing of modelfit dataPROC codeFit timePROC codeAny timePROC codeAny timeDATA step codeTable 1. Available Scoring Techniques in SAS/STAT SoftwareIf you are ready to score new data at the point when you are fitting the model, then theSCORE statement or the missing-response trick should work just fine. If you need to scorenew data sometime after the model fit, possibly when the fitting data is no longer available,then you should use one of the techniques that packages up the model fit. If you want to dothe scoring with a procedure call, then PROC PLM fills that need. If you want to do thescoring in a DATA step and possibly include calculations that could modify the predictedvalues, then the CODE statement is more appropriate.2
SCORING DATA WITH THE PLM PROCEDUREOne of the most valuable scoring methods in SAS is to use the PLM procedure. PROC PLMwas released with SAS 9.2 in 2008, so it has been around for a while. This method can beused with most SAS modeling procedures, including the following: GEEGENMODGLIMMIXGLMGLMSELECTLIFEREGLOGISTIC OGISTIC SURVEYPHREGSURVEYREGTo score data with PROC PLM, use the STORE statement in one of the above procedures tostore the model results. Then run PROC PLM to score a new set of data using that model.There are two noticeable advantages to working with PROC PLM. First, if you get into thehabit of including a STORE statement in your modeling work, then you will never have torefit a model just to produce predictions for a new set of data. PROC PLM can do thatwithout the expense of refitting the model. Second, you no longer need access to theoriginal data that was used to create the model to create predictions for new data. All youneed is the results of the model.You should be aware of two concerns when you work with PROC PLM and the STOREstatement:1. The STORE statement stores the model results in an internal SAS file that cannot bemodified in any way. Those model results are useful only with PROC PLM because theywere created when the model was built.2. The model results can be used only with PROC PLM on the same operating system onwhich the model results were created. If the model was built in a 64-bit MicrosoftWindows environment, then those results can be used only with PROC PLM in a 64-bitMicrosoft Windows environment. Cross-environment use is not allowed.Here is a closer look at how PROC PLM works scoring a model created with PROCGLMSELECT. The following DATA step generates data for a model with a CLASS effect TRT(with three levels) and three covariates (X1, X2, and X3):data YourModelData;call streaminit(614325);do trt 1 to 3;do rep 1 to ceil(rand('uniform')*35);x1 rand('uniform')*10;x2 rand('normal')*2;x3 rand('normal')*3;e rand('normal');y 2 trt x1 0*x2 1.4*x3 e;output;end;end;run;If you are not familiar with simulating data in SAS, the RAND function simulates data from awide range of distributions. In the code above, data is simulated for the covariate X1 from auniform distribution on the interval (0,10). Data is simulated for the covariates X2 and X33
from a standard normal distribution. The CALL STREAMINIT routine provides a seed valuefor the simulation so that the results shown here can be duplicated.Here is the algebraic representation of the model that is used in the simulation:Y ij β0 TRT i β1*X1ij β2*X2ij β3*X3ij εijThe simulated values that are used are as follows: β0 2, β1 1, β2 0, and β3 1.4. The TRTeffect takes on the levels 1, 2, and 3. ε represents the residual that is added to eachobservation.The DATA step above creates the data used to build the regression model. A second DATAstep, creating the data set YourScoreData, is needed to create data that you want to scorewith this model:data YourScoreData;call streaminit(6142352);do rep 1 to 20;trt ceil(rand('uniform')*3);x1 rand('uniform')*10;x2 rand('normal')*2;x3 rand('normal')*3;y .;output;end;run;Notice that the response, Y, for each observation in this data is set to missing. The responsevariable is not needed in this second data set. Adding the response variable, though, doesno harm.The syntax for scoring new data with PROC PLM is straightforward. You fit the model usingPROC GLMSELECT and save the fitted model with a STORE statement to compute the scoreslater:proc glmselect data YourModelData;class trt;model y trt x1 x2 x3 / selection stepwise;store out YourModel;run;PROC GLMSELECT creates a SAS item store that is called YourModel. (Although, in thisexample, the item store is saved to your Work library, you can use a LIBNAME statement tosave these item stores to permanent locations.)You use this SAS item store to score new data with PROC PLM. You can perform this scoringtoday, tomorrow, or even next year without having to refit the model and without needingaccess to the original data. The following PLM procedure creates the predicted values andshows additional flexibility in the PLM syntax:proc plm restore YourModel;score data YourScoreData out YourDataScoredpred Predicted lcl Lower ucl Upper;run;PROC PLM not only produces predicted values, but also provides upper and lower confidencebounds on that prediction. The SCORE statement in PROC PLM can even produce predictionsfrom the output of a Bayesian analysis.4
PROC PLM does not stop at producing just predictions and associated statistics. Theprocedure has options for producing graphs and performing post hoc tests on your modelresults. For more information, see the SAS/STAT documentation and Tobias and Cai (2010).SCORING DATA WITH THE CODE STATEMENTWant to create predictions with the DATA step? The CODE statement can help. The CODEstatement creates DATA step code that contains the calculations necessary for creatingpredicted values from the observations in a SAS data set. This code is exportable. You cancreate the model on one operating system and score new data on another operatingsystem.The CODE statement is available in the following SAS/STAT procedures: GENMODGLIMMIXGLM GLMSELECTLOGISTICMIXED PLMREGThe syntax for the CODE statement has a single option, specifying the file in which you wantto store the necessary code to create predictions in a DATA step:code file 'MyCode.sas';Then you can include that code file in your SAS program today, tomorrow, or next year forwhen you want to score a new set of observations:data ScoreObs;set DataToScore;%include 'MyCode.sas';run;This DATA step runs the code from that external SAS file and then scores the observationsin the data set DataToScore. The data set must contain the same variables, using the samevariable names, as the data set on which the model was developed.The CODE statement creates a file that contains SAS programming statements withcomments. Unlike the STORE statement, the results of the CODE statement are somethingthat you can open and view and understand (and perhaps even modify).A linear regression model shows the basic structure of the code that the CODE statementcreates. The following DATA step produces observations with which you can fit a linearregression model. The PROC REG step fits the model and writes the code for creatingpredictions to the MyRegModel.sas file:data RegData;call streaminit(8741235);do i 1 to 24;x1 rand('uniform')*10;x2 rand('uniform')*5;e rand('normal');y 3 2*x1 1.5*x2 e;output;end;run;(code continued)5
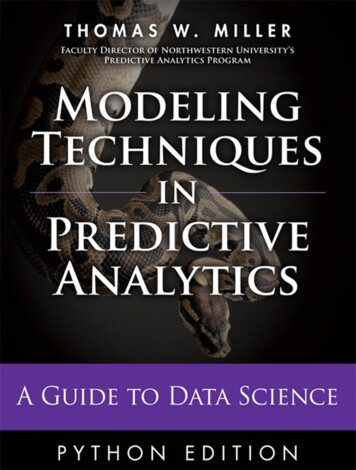
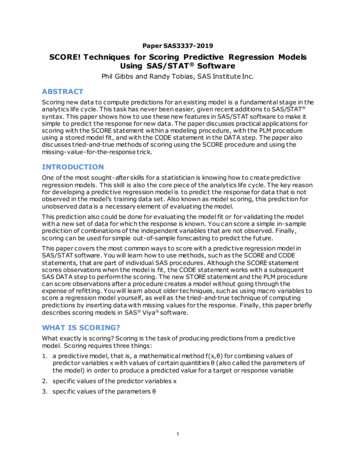
proc reg data RegData;model y x1 x2;code file 'MyRegModel.sas';run;quit;The parameter estimates for this model are shown in Output 1.Output 1. Parameter Estimates for Regression ModelThese parameter estimates are used in the code that PROC REG produces. The followingcode, which scores new observations for this model, is exactly what PROC REG generates.The code is written to the FILE ;** SAS Scoring Code for PROC l P y 'Predicted: y' ;drop LMR BAD;LMR BAD 0;*** Check interval variables for missing values;if nmiss(x1,x2) then do;LMR BAD 1;goto SKIP 000;end;*** Compute Linear Predictors;drop LP0;LP0 0;*** Effect:LP0 LP0*** Effect:LP0 LP0x1; (1.87750737751729) * x1;x2; (1.33104533272017) * x2;*** Predicted values;LP0 LP0 3.90121078413585;SKIP 000:if LMR BAD 1 then do;P y .;end;else do;P y LP0;end;6
The code checks to see whether any of the variables that are needed for the regression aremissing. If variables are missing, no prediction is calculated. The predicted value is built,one regressor at a time, starting with the model effects X1 and X2. The intercept value isadded in last. Notice that the code uses the full precision that is available for the parameterestimates. The code does not restrict the precision to that shown in the printed output fromPROC REG (see Output 2).The code for this model is available below for you to modify. You can remove effects if youneed to create partial predictions. If you need a prediction just for the intercept and X1effects, then you can remove the line of code that adjusts the prediction for X2.A “linear predictor” is used in the code (abbreviated as LP) to store the calculation of thepredicted value. In a linear regression, the LP is the predicted value itself. In generalizedlinear models, a link function is necessary to produce the predicted value. The followingexample demonstrates this.The DATA step code below produces observations for a logistic regression model. There is atreatment effect, TRT, that has three levels and a covariate effect, X1. The LOGISTICprocedure step fits the model and provides the code that is necessary to producepredictions:data LogisticData;call streaminit(25345278);do trt 1 to 3;do rep 1 to 20;x1 -rand('uniform')*2;logit -1 trt 1.4*x1;p exp(-logit)/(1 exp(-logit));if rand('uniform') p then y 0; else y 1;output;end;end;run;proc logistic data LogisticData;class trt / param glm;model y trt x1;code file 'MyLogisticModel.sas';run;The code that is produced to score new observations is much more complicated than what isneeded to score a linear regression model. The reason that it is more complicated is notonly the logistic model but also the classification variable TRT. A full discussion of theconcepts in this code is beyond the scope of this paper, but these two features are worthsome special attention.1. This logistic model involves a CLASS effect, TRT. The code must construct designvariables for the levels of the TRT effect. Those design variables are used to determinewhich parameter estimate for the TRT effect applies to the predicted value.2. A logistic regression model includes a logit link function. This link function is applied tothe linear predictor to produce a predicted probability for each level of the response. Theresponse level with the highest predicted probability is made the predicted response foreach observation.7
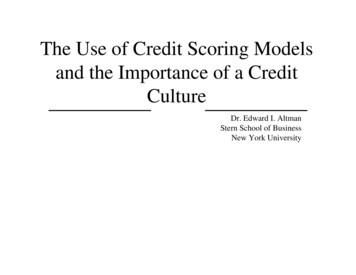
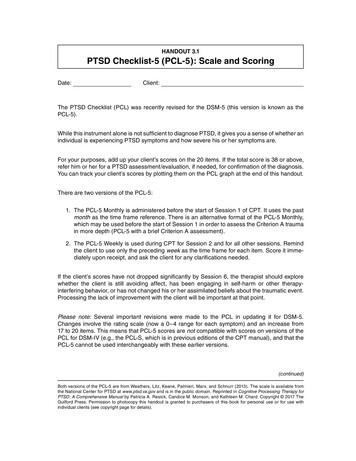
Output 2 contains the last 10 observations of the LogisticData data set, after the scoringcode is applied to that data. The variables P y0 and P y1 contain the predicted probabilitiesfor the two levels of the response. If P y0 .5, then the predicted response, I y, is set to 0.If P y1 .5, then the predicted response is set to 1. For these 10 observations, the modeldoes a nice job of predicting the response. Only observation 51 has an inaccurateprediction.Output 2. LogisticData Data Set with the Scoring Code AppliedModifications to prediction code like the code used here are difficult because of the codecomplexity. The code can be modified to create partial predictions, but make sure that youfully understand what the prediction code is doing before you attempt any modifications.The full scoring code is in Appendix 1.SCORING DATA USING MACRO VARIABLES FOR MODEL PARAMETERSThe CODE statement provides a convenient method for scoring new observations with astatistical model. What if the procedure you need to use lacks this statement, or you justwant to develop the scoring model yourself?All SAS modeling procedures write the parameter estimates for the model to an output dataset. These parameter estimates can be stored in SAS macro variables, and those macrovariables can be used in SAS DATA step code to create predictions.Recall the DATA step that created data for the section on scoring models with PROC PLM.The MIXED procedure can also be used to fit a model against this data:proc mixed data YourModelData;class trt;model y trt x1 x2 x3 / solution;ods output solutionf ParmEsts;run;proc print data ParmEsts;run;8
The parameter estimates table, as stored in the data set ParmEsts, is shown as Output 3.Output 3. Parameter Estimates from PROC MIXEDThe power of the SQL procedure can extract these parameter estimates from this data setand store them in SAS macro variables. Here is the SQL code:proc sql noprint;select count(*)into :nobs from ParmEsts;select Estimate into :Beta 1 - :Beta %sysfunc(strip(&nobs)) fromParmEsts;quit;The code counts the number of parameter estimates in the data set ParmEsts and thenstores that value in the SAS macro variable &NOBS. The second SELECT statement readseach of the observation values for the ESTIMATE variable. Those values are then stored inthe SAS macro variables &Beta 1, &Beta 2, and so on.To check that you have stored the parameter estimates correctly, the macro %PrintBetaswrites out the values of the parameter estimate macro variables:%macro PrintBetas;%do i 1 %to &nobs;%put &&Beta &i;%end;%mend;%PrintBetas;The final action is to build the prediction model in a SAS DATA step. If the model is a linearregression, then the SAS code that is needed to calculate the predicted value is easy towrite. This model, however, involves a CLASS variable.The following code determines the appropriate parameter estimate to use for the TRT effectand assigns that value to the prediction:data YourDataScored;set YourModelData;if trt 1 then TrtEffect &Beta 2;else if trt 2 then TrtEffect &Beta 3;else TrtEffect &Beta 4;PredY &Beta 1 TrtEffect x1*&Beta 5 x2*&Beta 6 x3*&Beta 7;run;9
The PredY variable stores the predicted value, adding in the intercept (&Beta 1) and thecovariate components for the prediction.One advantage to this technique is that you can easily construct partial predictions whenyou want to look only at the TRT effect or at the prediction accounting for a set ofcovariates. A disadvantage is that you cannot easily construct standard errors for thesepredictions.SCORING DATA WITH THE SCORE STATEMENTThe SCORE statement discussed in the section on scoring with PROC PLM is also available insome SAS/STAT procedures that do direct modeling. Here are some of the procedures thatcan use the SCORE statement: ADAPTIVEREGCOUNTREG(SAS/ETS)GAM GLMSELECTKDELOESSLOGISTIC PLMTPSPLINEThe syntax for the SCORE statement is simple and easy to use. Use the DATA option tospecify the data set that you want to score. Use the OUT option to specify the data set tocontain the predictions, along with all the variables from the DATA data set. This methodis convenient when you need to generate predictions quickly, in-line with estimating themodel. Multiple SCORE statements can score different data sets, and predictions are createdfor observations that have missing responses.The following model was developed in the previous section on PROC PLM. You can build themodel and score a new data set in one step with code like the following:proc glmselect data YourModelData;class trt;model resp trt x1 x2 x3;score data YourScoreData out YourDataScored;run;This code builds a model using the data in YourModelData. It then scores the data inYourScoreData and stores the new scored responses in YourDataScored. This techniquecomes in very handy
SAS provides several methods for packaging up these functions into a form that allows for the creatoi n of predci ted vaul es. Something that you need to consider in deciding how to score is when the data will be scored. Some SAS/STAT techniques f