Transcription
Modeling Techniquesin Predictive Analyticswith Python and RA Guide to Data ScienceT HOMAS W. M ILLER
Associate Publisher: Amy NeidlingerExecutive Editor: Jeanne GlasserOperations Specialist: Jodi KemperCover Designer: Alan ClementsManaging Editor: Kristy HartProject Editor: Andy BeasterSenior Compositor: Gloria SchurickManufacturing Buyer: Dan Uhrigc 2015 by Thomas W. MillerPublished by Pearson Education, Inc.Upper Saddle River, New Jersey 07458Pearson offers excellent discounts on this book when ordered in quantity for bulkpurchases or special sales. For more information, please contact U.S. Corporate andGovernment Sales, 1-800-382-3419, corpsales@pearsontechgroup.com. For salesoutside the U.S., please contact International Sales at international@pearsoned.com.Company and product names mentioned herein are the trademarks or registeredtrademarks of their respective owners.All rights reserved. No part of this book may be reproduced, in any form or by anymeans, without permission in writing from the publisher.Printed in the United States of AmericaFirst Printing October 2014ISBN-10: 0-13-3892069ISBN-13: 978-0-13-389206-2Pearson Education LTD.Pearson Education Australia PTY, Limited.Pearson Education Singapore, Pte. Ltd.Pearson Education Asia, Ltd.Pearson Education Canada, Ltd.Pearson Educacin de Mexico, S.A. de C.V.Pearson Education—JapanPearson Education Malaysia, Pte. Ltd.Library of Congress Control Number: 2014948913
ytics and Data Science12Advertising and Promotion163Preference and Choice334Market Basket Analysis435Economic Data Analysis616Operations Management817Text Analytics1038Sentiment Analysis1359Sports Analytics187iii
ivModeling Techniques in Predictive Analytics with Python and R10 Spatial Data Analysis21111 Brand and Price23912 The Big Little Data Game273A Data Science Methods277A.1 Databases and Data Preparation279A.2 Classical and Bayesian Statistics281A.3 Regression and Classification284A.4 Machine Learning289A.5 Web and Social Network Analysis291A.6 Recommender Systems293A.7 Product Positioning295A.8 Market Segmentation297A.9 Site Selection299A.10 Financial Data Science300B Measurement301C Case Studies315C.1 Return of the Bobbleheads315C.2 DriveTime Sedans316C.3 Two Month’s Salary321C.4 Wisconsin Dells325C.5 Computer Choice Study330D Code and Utilities335Bibliography379Index413
Preface“All right . . . all right . . . but apart from better sanitation, the medicine,education, wine, public order, irrigation, roads, a fresh water system,and public health . . . what have the Romans ever done for us?”—J OHN C LEESE AS R EG IN Life of Brian (1979)I was in a doctoral-level statistics course at the University of Minnesota inthe late 1970s when I learned a lesson about the programming habits ofacademics. At the start of the course, the instructor said, “I don’t care whatlanguage you use for assignments, as long as you do your own work.”I had facility with Fortran but was teaching myself Pascal at the time. I wasdeveloping a structured programming style—no more GO TO statements.So, taking the instructor at his word, I programmed the first assignmentin Pascal. The other fourteen students in the class were programming inFortran, the lingua franca of statistics at the time.When I handed in the assignment, the instructor looked at it and asked,“What’s this?”“Pascal,” I said. “You told us we could program in any language we like aslong as we do our own work.”He responded, “Pascal. I don’t read Pascal. I only read Fortran.”v
viModeling Techniques in Predictive Analytics with Python and RToday’s world of data science brings together information technology professionals fluent in Python with statisticians fluent in R. These communitieshave much to learn from each other. For the practicing data scientist, thereare considerable advantages to being multilingual.Sometimes referred to as a “glue language,” Python provides a rich opensource environment for scientific programming and research. For computerintensive applications, it gives us the ability to call on compiled routinesfrom C, C , and Fortran. Or we can use Cython to convert Python codeinto optimized C. For modeling techniques or graphics not currently implemented in Python, we can execute R programs from Python. We candraw on R packages for nonlinear estimation, Bayesian hierarchical modeling, time series analysis, multivariate methods, statistical graphics, and thehandling of missing data, just as R users can benefit from Python’s capabilities as a general-purpose programming language.Data and algorithms rule the day. Welcome to the new world of business, a fast-paced, data-intensive world, an open-source environment inwhich competitive advantage, however fleeting, is obtained through analytic prowess and the sharing of ideas.Many books about predictive analytics or data science talk about strategyand management. Some focus on methods and models. Others look at information technology and code. This is a rare book does all three, appealingto business managers, modelers, and programmers alike.We recognize the importance of analytics in gaining competitive advantage.We help researchers and analysts by providing a ready resource and reference guide for modeling techniques. We show programmers how to buildupon a foundation of code that works to solve real business problems. Wetranslate the results of models into words and pictures that managementcan understand. We explain the meaning of data and models.Growth in the volume of data collected and stored, in the variety of dataavailable for analysis, and in the rate at which data arrive and require analysis, makes analytics more important with each passing day. Achievingcompetitive advantage means implementing new systems for informationmanagement and analytics. It means changing the way business is done.
PrefaceLiterature in the field of data science is massive, drawing from many academic disciplines and application areas. The relevant open-source code isgrowing quickly. Indeed, it would be a challenge to provide a comprehensive guide to predictive analytics or data science.We look at real problems and real data. We offer a collection of vignetteswith each chapter focused on a particular application area and businessproblem. We provide solutions that make sense. By showing modelingtechniques and programming tools in action, we convert abstract conceptsinto concrete examples. Fully worked examples facilitate understanding.Our objective is to provide an overview of predictive analytics and datascience that is accessible to many readers. There is scant mathematics in thebook. Statisticians and modelers may look to the references for details andderivations of methods. We describe methods in plain English and use datavisualization to show solutions to business problems.Given the subject of the book, some might wonder if I belong to either theclassical or Bayesian camp. At the School of Statistics at the University ofMinnesota, I developed a respect for both sides of the classical/Bayesiandivide. I have high regard for the perspective of empirical Bayesians andthose working in statistical learning, which combines machine learning andtraditional statistics. I am a pragmatist when it comes to modeling andinference. I do what works and express my uncertainty in statements thatothers can understand.This book is possible because of the thousands of experts across the world,people who contribute time and ideas to open source. The growth of opensource and the ease of growing it further ensures that developed solutionswill be around for many years to come. Genie out of the lamp, wizard frombehind the curtain—rocket science is not what it used to be. Secrets arebeing revealed. This book is part of the process.Most of the data in the book were obtained from public domain data sources.Major League Baseball data for promotions and attendance were contributedby Erica Costello. Computer choice study data were made possible throughwork supported by Sharon Chamberlain. The call center data of “Anonymous Bank” were provided by Avi Mandelbaum and Ilan Guedj. Movieinformation was obtained courtesy of The Internet Movie Database, usedwith permission. IMDb movie reviews data were organized by Andrew L.vii
viiiModeling Techniques in Predictive Analytics with Python and RMass and his colleagues at Stanford University. Some examples were inspired by working with clients at ToutBay of Tampa, Florida, NCR Comten,Hewlett-Packard Company, Site Analytics Co. of New York, Sunseed Research of Madison, Wisconsin, and Union Cab Cooperative of Madison.We work within open-source communities, sharing code with one another.The truth about what we do is in the programs we write. It is there foreveryone to see and for some to debug. To promote student learning, eachprogram includes step-by-step comments and suggestions for taking theanalysis further. All data sets and computer programs are downloadablefrom the book’s website at http://www.ftpress.com/miller/.The initial plan for this book was to translate the R version of the bookinto Python. While working on what was going to be a Python-only edition, however, I gained a more profound respect for both languages. I sawhow some problems are more easily solved with Python and others with R.Furthermore, being able to access the wealth of R packages for modelingtechniques and graphics while working in Python has distinct advantagesfor the practicing data scientist. Accordingly, this edition of the book includes Python and R code examples. It represents a unique dual-languageguide to data science.Many have influenced my intellectual development over the years. Therewere those good thinkers and good people, teachers and mentors for whomI will be forever grateful. Sadly, no longer with us are Gerald Hahn Hinklein philosophy and Allan Lake Rice in languages at Ursinus College, andHerbert Feigl in philosophy at the University of Minnesota. I am also mostthankful to David J. Weiss in psychometrics at the University of Minnesotaand Kelly Eakin in economics, formerly at the University of Oregon. Goodteachers—yes, great teachers—are valued for a lifetime.Thanks to Michael L. Rothschild, Neal M. Ford, Peter R. Dickson, and JanetChristopher who provided invaluable support during our years togetherat the University of Wisconsin–Madison and the A. C. Nielsen Center forMarketing Research.I live in California, four miles north of Dodger Stadium, teach for Northwestern University in Evanston, Illinois, and direct product developmentat ToutBay, a data science firm in Tampa, Florida. Such are the benefits of agood Internet connection.
PrefaceI am fortunate to be involved with graduate distance education at Northwestern University’s School of Professional Studies. Thanks to Glen Fogerty,who offered me the opportunity to teach and take a leadership role in thepredictive analytics program at Northwestern University. Thanks to colleagues and staff who administer this exceptional graduate program. Andthanks to the many students and fellow faculty from whom I have learned.ToutBay is an emerging firm in the data science space. With co-founderGreg Blence, I have great hopes for growth in the coming years. Thanksto Greg for joining me in this effort and for keeping me grounded in thepractical needs of business. Academics and data science models can takeus only so far. Eventually, to make a difference, we must implement ourideas and models, sharing them with one another.Amy Hendrickson of TEXnology Inc. applied her craft, making words, tables, and figures look beautiful in print—another victory for open source.Thanks to Donald Knuth and the TEX/LATEX community for their contributions to this wonderful system for typesetting and publication.Thanks to readers and reviewers of the initial R edition of the book, including Suzanne Callender, Philip M. Goldfeder, Melvin Ott, and ThomasP. Ryan. For the revised R edition, Lorena Martin provided much neededfeedback and suggestions for improving the book. Candice Bradley serveddual roles as a reviewer and copyeditor, and Roy L. Sanford provided technical advice about statistical models and programs. Thanks also to my editor, Jeanne Glasser Levine, and publisher, Pearson/FT Press, for makingthis book possible. Any writing issues, errors, or items of unfinished business, of course, are my responsibility alone.My good friend Brittney and her daughter Janiya keep me company whentime permits. And my son Daniel is there for me in good times and bad, afriend for life. My greatest debt is to them because they believe in me.Thomas W. MillerGlendale, CaliforniaAugust 2014ix
This page intentionally left blank
.44.55.15.25.35.45.55.66.16.26.36.4Data and models for researchTraining-and-Test Regimen for Model EvaluationTraining-and-Test Using Multi-fold Cross-validationTraining-and-Test with Bootstrap ResamplingImportance of Data Visualization: The Anscombe QuartetDodgers Attendance by Day of WeekDodgers Attendance by MonthDodgers Weather, Fireworks, and AttendanceDodgers Attendance by Visiting TeamRegression Model Performance: Bobbleheads and AttendanceSpine Chart of Preferences for Mobile Communication ServicesMarket Basket Prevalence of Initial Grocery ItemsMarket Basket Prevalence of Grocery Items by CategoryMarket Basket Association Rules: Scatter PlotMarket Basket Association Rules: Matrix Bubble ChartAssociation Rules for a Local Farmer: A Network DiagramMultiple Time Series of Economic DataHorizon Plot of Indexed Economic Time SeriesForecast of National Civilian Employment Rate (percentage)Forecast of Manufacturers’ New Orders: Durable Goods (billionsof dollars)Forecast of University of Michigan Index of Consumer Sentiment(1Q 1966 100)Forecast of New Homes Sold (millions)Call Center Operations for MondayCall Center Operations for TuesdayCall Center Operations for WednesdayCall Center Operations for 83838484
xiiModeling Techniques in Predictive Analytics with Python and 411.111.2Call Center Operations for FridayCall Center Operations for SundayCall Center Arrival and Service Rates on WednesdaysCall Center Needs and Optimal Workforce ScheduleMovie Taglines from The Internet Movie Database (IMDb)Movies by Year of ReleaseA Bag of 200 Words from Forty Years of Movie TaglinesPicture of Text in Time: Forty Years of Movie TaglinesText Measures and Documents on a Single GraphHorizon Plot of Text Measures across Forty Years of MovieTaglinesFrom Text Processing to Text AnalyticsLinguistic Foundations of Text AnalyticsCreating a Terms-by-Documents MatrixA Few Movie Reviews According to TomA Few More Movie Reviews According to TomFifty Words of SentimentList-Based Text Measures for Four Movie ReviewsScatter Plot of Text Measures of Positive and Negative SentimentWord Importance in Classifying Movie Reviews as Thumbs-Up orThumbs-DownA Simple Tree Classifier for Thumbs-Up or Thumbs-DownPredictive Modeling Framework for Picking a Winning TeamGame-day Simulation (offense only)Mets’ Away and Yankees’ Home Data (offense and defense)Balanced Game-day Simulation (offense and defense)Actual and Theoretical Runs-scored DistributionsPoisson Model for Mets vs. Yankees at Yankee StadiumNegative Binomial Model for Mets vs. Yankees at Yankee StadiumProbability of Home Team Winning (Negative Binomial Model)California Housing Data: Correlation Heat Map for the TrainingDataCalifornia Housing Data: Scatter Plot Matrix of Selected VariablesTree-Structured Regression for Predicting California HousingValuesRandom Forests Regression for Predicting California HousingValuesComputer Choice Study: A Mosaic of Top Brands and Most ValuedAttributesFramework for Describing Consumer Preference and 2244
B.5B.6B.7B.8B.9B.10C.1D.1D.2Ternary Plot of Consumer Preference and ChoiceComparing Consumers with Differing Brand PreferencesPotential for Brand Switching: Parallel Coordinates for IndividualConsumersPotential for Brand Switching: Parallel Coordinates for ConsumerGroupsMarket Simulation: A Mosaic of Preference SharesWork of Data ScienceEvaluating Predictive Accuracy of a Binary ClassifierHypothetical Multitrait-Multimethod MatrixConjoint Degree-of-Interest RatingConjoint Sliding Scale for Profile PairsPaired ComparisonsMultiple-Rank-OrdersBest-worst Item Provides Partial Paired ComparisonsPaired Comparison Choice TaskChoice Set with Three Product ProfilesMenu-based Choice TaskElimination Pick ListComputer Choice Study: One Choice SetA Python Programmer’s Word CloudAn R Programmer’s Word 312313332338338
This page intentionally left blank
0.210.311.111.211.3C.1C.2C.3C.4Data for the Anscombe QuartetBobbleheads and Dodger DogsRegression of Attendance on Month, Day of Week, and BobbleheadPromotionPreference Data for Mobile Communication ServicesMarket Basket for One Shopping TripAssociation Rules for a Local FarmerCall Center Shifts and Needs for WednesdaysCall Center Problem and SolutionList-Based Sentiment Measures from Tom’s ReviewsAccuracy of Text Classification for Movie Reviews (Thumbs-Up orThumbs-Down)Random Forest Text Measurement Model Applied to Tom’s MovieReviewsNew York Mets’ Early Season Games in 2007New York Yankees’ Early Season Games in 2007California Housing Data: Original and Computed VariablesLinear Regression Fit to Selected California Block GroupsComparison of Regressions on Spatially Referenced DataContingency Table of Top-ranked Brands and Most ValuedAttributesMarket Simulation: Choice Set InputMarket Simulation: Preference Shares in a Hypothetical Four-brandMarketHypothetical profitsfrom model-guided vehicle selectionDriveTime Data for SedansDriveTime Sedan Color Map with Frequency CountsDiamonds Data: Variable Names and Coding 50252318319320324
xviModeling Techniques in Predictive Analytics with Python and RC.5C.6C.7C.8Dells Survey Data: Visitor CharacteristicsDells Survey Data: Visitor ActivitiesComputer Choice Study: Product AttributesComputer Choice Study: Data for One Individual328329331333
ramming the Anscombe Quartet (Python)Programming the Anscombe Quartet (R)Shaking Our Bobbleheads Yes and No (Python)Shaking Our Bobbleheads Yes and No (R)Measuring and Modeling Individual Preferences (Python)Measuring and Modeling Individual Preferences (R)Market Basket Analysis of Grocery Store Data (Python)Market Basket Analysis of Grocery Store Data (R)Working with Economic Data (Python)Working with Economic Data (R)Call Center Scheduling (Python)Call Center Scheduling (R)Text Analysis of Movie Taglines (Python)Text Analysis of Movie Taglines (R)Sentiment Analysis and Classification of Movie Ratings (Python)Sentiment Analysis and Classification of Movie Ratings (R)Team Winning Probabilities by Simulation (Python)Team Winning Probabilities by Simulation (R)Regression Models for Spatial Data (Python)Regression Models for Spatial Data (R)Training and Testing a Hierarchical Bayes Model (R)Preference, Choice, and Market Simulation (R)Evaluating Predictive Accuracy of a Binary Classifier (Python)Text Measures for Sentiment Analysis (Python)Summative Scoring of Sentiment (Python)Conjoint Analysis Spine Chart (R)Market Simulation Utilities (R)Split-plotting Utilities 22229255260339340342343351352
xviiiModeling Techniques in Predictive Analytics with Python and RD.7D.8D.9D.10D.11Wait-time Ribbon Plot (R)Movie Tagline Data Preparation Script for Text Analysis (R)Word Scoring Code for Sentiment Analysis (R)Utilities for Spatial Data Analysis (R)Making Word Clouds (R)355367372376377
1Analytics and Data ScienceMr. Maguire: “I just want to say one word to you, just one word.”Ben: ”Yes, sir.”Mr. Maguire: “Are you listening?”Ben: ”Yes, I am.”Mr. Maguire: “Plastics.”—WALTER B ROOKE AS M R . M AGUIRE AND D USTIN H OFFMANAS B EN (B ENJAMIN B RADDOCK ) IN The Graduate (1967)While earning a degree in philosophy may not be the best career move(unless a student plans to teach philosophy, and few of these positions areavailable), I greatly value my years as a student of philosophy and the liberal arts. For my bachelor’s degree, I wrote an honors paper on BertrandRussell. In graduate school at the University of Minnesota, I took coursesfrom one of the truly great philosophers, Herbert Feigl. I read about scienceand the search for truth, otherwise known as epistemology. My favoritephilosophy was logical empiricism.Although my days of “thinking about thinking” (which is how Feigl defined philosophy) are far behind me, in those early years of academic training I was able to develop a keen sense for what is real and what is just talk.1
2Modeling Techniques in Predictive Analytics with Python and RA model is a representation of things, a rendering or description of reality.A typical model in data science is an attempt to relate one set of variablesto another. Limited, imprecise, but useful, a model helps us to make senseof the world. A model is more than just talk because it is based on data.Predictive analytics brings together management, information technology,and modeling. It is designed for today’s data-intensive world. Predictiveanalytics is data science, a multidisciplinary skill set essential for success inbusiness, nonprofit organizations, and government. Whether forecastingsales or market share, finding a good retail site or investment opportunity,identifying consumer segments and target markets, or assessing the potential of new products or risks associated with existing products, modelingmethods in predictive analytics provide the key.Data scientists, those working in the field of predictive analytics, speak thelanguage of business—accounting, finance, marketing, and management.They know about information technology, including data structures, algorithms, and object-oriented programming. They understand statisticalmodeling, machine learning, and mathematical programming. Data scientists are methodological eclectics, drawing from many scientific disciplinesand translating the results of empirical research into words and picturesthat management can understand.Predictive analytics, as with much of statistics, involves searching for meaningful relationships among variables and representing those relationshipsin models. There are response variables—things we are trying to predict.There are explanatory variables or predictors—things that we observe, manipulate, or control and might relate to the response.Regression methods help us to predict a response with meaningful magnitude, such as quantity sold, stock price, or return on investment. Classification methods help us to predict a categorical response. Which brandwill be purchased? Will the consumer buy the product or not? Will the account holder pay off or default on the loan? Is this bank transaction true orfraudulent?Prediction problems are defined by their width or number of potential predictors and by their depth or number of observations in the data set. It isthe number of potential predictors in business, marketing, and investmentanalysis that causes the most difficulty. There can be thousands of potential
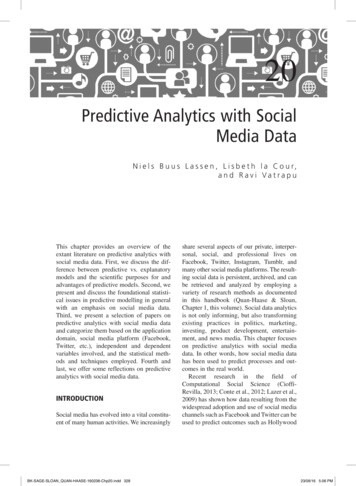
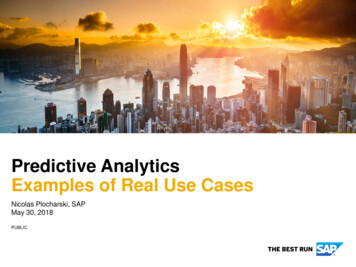
Chapter 1. Analytics and Data ScienceFigure 1.1.Traditional ResearchModelData and models for researchData-Adaptive ResearchReal DataReal DataModel-DependentResearchModelGenerated DataModelReal Datapredictors with weak relationships to the response. With the aid of computers, hundreds or thousands of models can be fit to subsets of the dataand tested on other subsets of the data, providing an evaluation of eachpredictor. Predictive modeling involves finding good subsets of predictors.Models that fit the data well are better than models that fit the data poorly.Simple models are better than complex models.Consider three general approaches to research and modeling as employedin predictive analytics: traditional, data-adaptive, and model-dependent.See figure 1.1. The traditional approach to research, statistical inference,and modeling begins with the specification of a theory or model. Classical or Bayesian methods of statistical inference are employed. Traditionalmethods, such as linear regression and logistic regression, estimate parameters for linear predictors. Model building involves fitting models to dataand checking them with diagnostics. We validate traditional models beforeusing them to make predictions.When we employ a data-adaptive approach, we begin with data and searchthrough those data to find useful predictors. We give little thought to theories or hypotheses prior to running the analysis. This is the world of machine learning, sometimes called statistical learning or data mining. Dataadaptive methods adapt to the available data, representing nonlinear relationships and interactions among variables. The data determine the model.3
4Modeling Techniques in Predictive Analytics with Python and RData-adaptive methods are data-driven. As with traditional models, wevalidate data-adaptive models before using them to make predictions.Model-dependent research is the third approach. It begins with the specification of a model and uses that model to generate data, predictions, orrecommendations. Simulations and mathematical programming methods,primary tools of operations research, are examples of model-dependentresearch. When employing a model-dependent or simulation approach,models are improved by comparing generated data with real data. Weask whether simulated consumers, firms, and markets behave like real consumers, firms, and markets. The comparison with real data serves as a formof validation.It is often a combination of models and methods that works best. Consideran application from the field of financial research. The manager of a mutualfund is looking for additional stocks for a fund’s portfolio. A financial engineer employs a data-adaptive model (perhaps a neural network) to searchacross thousands of performance indicators and stocks, identifying a subset of stocks for further analysis. Then, working with that subset of stocks,the financial engineer employs a theory-based approach (CAPM, the capital asset pricing model) to identify a smaller set of stocks to recommend tothe fund manager. As a final step, using model-dependent research (mathematical programming), the engineer identifies the minimum-risk capitalinvestment for each of the stocks in the portfolio.Data may be organized by observational unit, time, and space. The observational or cross-sectional unit could be an individual consumer or businessor any other basis for collecting and grouping data. Data are organized intime by seconds, minutes, hours, days, and so on. Space or location is oftendefined by longitude and latitude.Consider numbers of customers entering grocery stores (units of analysis)in Glendale, California on Monday (one point in time), ignoring the spatial location of the stores—these are cross-sectional data. Suppose we workwith one of those stores, looking at numbers of customers entering the storeeach day of the week for six months—these are time series data. Thenwe look at numbers of customers at all of the grocery stores in Glendaleacross six months—these are longitudinal or panel data. To complete ourstudy, we locate these stores by longitude and latitude, so we have spatial
Chapter 1. Analytics and Data Scienceor spatio-temporal data. For any of these data structures we could considermeasures in addition to the number of customers entering stores. We lookat store sales, consumer or nearby resident demographics, traffic on Glendale streets, and so doing move to multiple time series and multivariatemethods. The organization of the data we collect affects the structure of themodels we employ.As we consider business problems in this book, we touch on many typesof models, including cross-sectional, time series, and spatial data models.Whatever the structure of the data and associated models, prediction is theunifying theme. We use the data we have to predict data we do not yethave, recognizing that prediction is a precarious enterprise. It is the processof extrapolating and forecasting. And model validation is essential to theprocess.To make predictions, we may employ classical or Bayesian methods. Orwe may dispense with traditional statistics entirely and rely upon machinelearning algorithms. We do what works.1 Our approach to predictive analytics is based upon a simple premise:The value of a model lies in the quality of its predictions.We learn from statistics that we should quantify our uncertainty. On the onehand, we have confidence intervals, point estimates with associated standard errors, significance tests, and p-values—that is the classical way. Onthe other hand, we have posterior probability distributions, probability intervals, prediction intervals, Bayes factors, and subjective (perhaps diffuse)priors—the path of Bayesian statistics. Indices such as the Akaike information criterion (AIC) or the Bayes information criterion (BIC) help us to tojudge one model against another, providing a balance between goodnessof-fit and parsimony.Central to our approach is a training-and-test regimen. We partition sampledata into training and test sets. We build our model on the training set and1 Within the statistical literature, Seymour Geisser (1929–2004) introduced an approach best describedas Bayesian predictive inference (G
iv Modeling Techniques in Predictive Analytics with Python and R 10 Spatial Data Analysis 211 11 Brand and Price 239 12 The Big Little Data Game 273 A Data Science Methods 277 A.1 Databases and Data Preparation 279 A.2 Classical and Bayesian Statistics 281 A.3 Regression and Classification 284 A.4 Machine Learning 289 A