Transcription
Kaizen Events:Achieving Rapid Improvement inHealthcare SettingsSociety for Health SystemsOrlando, FLFebruary 21, 2008CompanyLOGO
Building a Lean Enterprise
KAIZENKaiZenBreak apartStudyTo changeMake betterEVENTRapid Improvement 2008 Karen Martin & Associates3
StrategicImprovement RolesWho?AccountabilityToolLeadership“What has to happen”Value StreamMapping / A3“How it will happen”Kaizen EventsTacticalMiddleManagementWorkforce 2008 Karen Martin & Associates4
Value Stream DefinedValue Stream: All of the activities, required tosatisfy a customer need from request to receipt.Value StreamProcessProcessProcessCustom very” 2008 Karen Martin & Associates5
Typical Healthcare Value Stream“Pre-Production”PatientArrival ttedStart“Production”End“Post-Production” 2008 Karen Martin & Associates6
Individual vs. System PerformanceSystems focus 0ptimal value streamperformanceIsolated pockets of excellence sub-optimization risk 2008 Karen Martin & Associates7
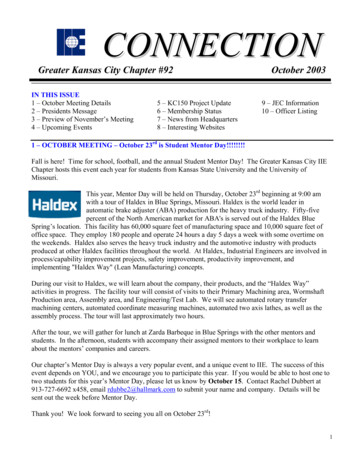
Customer Demand:15 patients per Day(Takt Time 32 minutes)8 hours per dayCurrent State Value Stream MapOutpatient Imaging ServicesPre-registerPatient5CT Cycle TimeLT Lead Time%C&A % Complete & AccurateScheduleAppointment436Lead T ime 990 mins.Cycle T ime 30 mins.Lead Time 990 mins.% C&A 100 %Refer Patient(Physician) 2Lead Time 12 mins.Cycle T ime 11 mins.Lead Time 12 mins.% C&A 98 %Patient21% C&A 65 %Auto Fax 50%Us Mail 25%MD Mailbox 25%SymposiumE PayExcelADSInternetMeditechWaiting RoomManagementSystemFax OrderSolutionsRework Loopvia Fax 25% ofthe timePACSLead Time 10 ing)5 mins.555 mins.Cycle Time 2 mins.% C&A 90 %0.0833 hrs.380 mins.6Cycle T ime 1 mins.% C&A 98 %0.0833 hrs.2 mins.72248 mins.24.13 hrs.28 mins.89365 mins.6.08 hrs.15 mins.960 mins.2Lead Time 5 mins.% C&A 75 %Cycle Time 15 mins.% C&A 95 %10110 mins.Cycle Time 1 mins.% C&A 95 %16 hrs.5 mins.PrintReports(Imaging)Review / SignReport(Radiologist)T ranscribe Report(MDI)Cycle T ime 28 mins.% C&A 90 %1.33 hrs.1 mins.Read/DictateExam(Radiologist)Prep Patient, ConductExam, TransmitImages (T ech)211120 mins.Cycle Time 1 mins.% C&A 99 %1.83 hrs.1 mins.SendReports(Imaging)612Cycle T ime 3 mins.% C&A 90 %2 hrs.1 mins.LT 32.5 hrs.3 mins.CT 56 mins.CT/LT Ratio 2.87%Value Stream Champion: Paul ScannerCreated July 19, 2005Rolled First Passyield 30%
Key Metrics: Time Process time (PT) The time it takes to actually perform the work, if one isable to work on it uninterruptedIncludes “think” time if process is analytical in natureaka “touch time,” work time, cycle time Lead time (LT) The elapsed time from the time work is made availableuntil it’s completed and passed on to the next person ordepartment in the chainaka throughput time, turnaround time, elapsed time 2008 Karen Martin & Associates9
Value Stream Lead Time vs.Process TimeLead TimeOrder(Request)Process TimeDelivery(Receipt)LT PT Delays 2008 Karen Martin & Associates10
Process Block Lead Time vs.Process TimeLead TimeProcess TimeWorkReceivedThe time it takesto do the workLT PT Delays 2008 Karen Martin & AssociatesWorkpassedto nextstep11
Key Metrics: Quality %Complete and Accurate (%C&A) % time downstream customer canperform task without having to “CAC”: Correct information or material that wassupplied Add information that should have beensupplied Clarify information that should have beenclear 2008 Karen Martin & Associates12
Summary Metrics (continued) Activity Ratio (AR) The percentage of time work is being done tothe product passing through the processAR PT/LT 100100 – AR Idle time Rolled First Pass Yield (RFPY) %C&A %C&A %C&A Out of 100 occurrences, what percentage ofthe time does the product pass through theentire process error-free? 2008 Karen Martin & Associates13
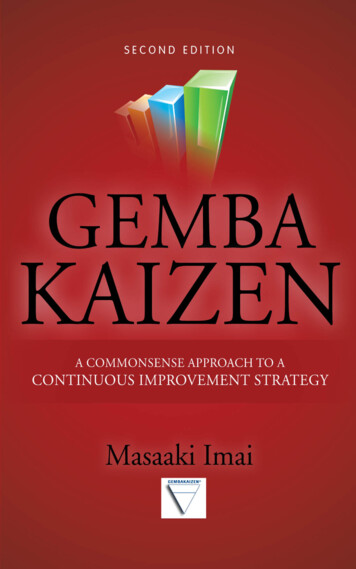
Future State Value Stream MapOutpatient Imaging ServicesCustomer Demand:15 patients per Day(Takt Time 32 minutes)8 hours per dayCT Cycle TimeLT Lead Time%C&A % Complete & ateSchedule apptPre-registerPatientRefer Patient(Physician)36Cycle T ime 11 mins.Lead T ime 45 mins.% C&A 98 %% C&A 85 %StandardWorkLead Time 5 daysRiskReduction(Joint Commision)SymposiumE tionStandardWorkPrep Patient,Conduct Exam,T ransmit Images(Tech)Check-inPatient(Imaging)5 mins.3460 mins.0.0833 hrs.52Cycle Time 1 mins.% C&A 98 %120 mins.PACSContinuousFlow6420 mins.5S27StandardWorkPrintReports(Imaging)2 mins.Cycle T ime 1 mins.% C&A 95 %7 hrs.15 mins.Rework Loopvia Fax 10% ofthe timeBatchReductionsReview/Sign(Radiologist)Cycle Time 15 mins.% C&A 95 %2 hrs.28 mins.Fax OrderSolutionsWaiting RoomManagementSystemVisualWorkplace2Us Mail cle Time 28 mins.% C&A 90 %1 hrs.1 mins.InternetAuto Fax 80%MD Mailbox 5%Value StreamAlignmentPull System(SuppliesKanban)Reduce DataEntryRequirements12Lead Time 45 mins.2SendReports(Imaging)830 mins.Cycle T ime 1 mins.% C&A 99 %0.0333 hrs.1 mins.60.5 hrs.1 mins.9Cycle T ime 3 mins.% C&A 90 %LT 11.4 hrs.3 mins.CT 49 mins.CT/LT Ratio 7.14%Value Stream Champion: Paul ScannerCreated July 20, 2005Rolled First Passyield 59%
Outpatient ImagingImprovement ResultsMetricProjectedCurrent State Future StateLead Time32.5 hrs11.4 hrs65%Process Time56 Mins49 Mins13%Activity Ratio2.9%7.1%145%RFPY30%59%97%# steps11827%Report rework25%10%60%Tech MoralePoorGood 2008 Karen Martin & Associates% ImprovementSignificant15
Future State Implementation PlanValue Stream Outpatient ImagingImplementation Plan Review DatesExecutive Sponsor Allen Ward11/1/2007Value Stream Champion Sally McKinsey11/21/2007Value Stream Mapping Facilitator Dave Parks12/13/2007Date Created 10/18/2007Block#2Goal / ObjectiveImprove quality of referralImprovement ActivityImplement standard work for referralprocessTypeOwnerKESean O'RyanPROJDiannePrichard3, 4Reduce lead time beween schedulingandCross-train and colocate work teamspreregistration steps5, 6Eliminate the need for two patient checkinsCollect copays in ImagingKEMichaelO'Shea6Eliminate bottleneck in waiting areaBalance work / level demandKEDiannePrichard9Eliminate lead time associated withtranscription stepImplement voice recognition technologyPROJSam Parks10Eliminate batched readingReduce setup requiredKESam Parks7Reduce inventory costs, regulatory riskand storage needs5S CT supplies area; implement kanbanKEMichaelO'Shea12Reduce delay in report deliveryImplement additional fax portsPROJMartha Allen12Reduce delay in report deliveryIncrease percentage of physiciansreceiving electronic delivery (rather thanhard copy)KEMartha Allen11/10/2008Implementation Schedule (weeks)2 3 4 5 6 7 8 9 10 11 12ApprovalsExecutive SponsorValue Stream ChampionValue Stream Mapping :Date:DateComplete
Kaizen Event – DefinitionA two- to five-day focused improvementactivity during which a sequestered, crossfunctional team designs and fullyimplements improvements to a definedprocess or work area, generating rapidresults and learned behavior.Karen Martin & Mike OsterlingThe Kaizen Event Planner, 2007 2008 Karen Martin & Associates17
Kaizen Events: DefiningCharacteristics Typically linked to a value stream map Aggressive, measurable objectives Sequestered cross-functional team (100% focus) Short duration: 2-5 consecutive days Professionally facilitated Emphasis on the elimination of unnecessary nonvalue-adding activities Low cost Define and exploit the “technical boundaries” of existingresources“Creativity before capital” thinking Rapid Implementation (during the event) Not simply planning for change 2008 Karen Martin & Associates18
ACTION!
Examples of HealthcareKaizen Events Patient flow ImagingEmergency DepartmentSurgeryOB/GYNCardiac Ancillary services Lab / pathologyturnaround Administrative Space 2008 Karen Martin & ical RecordsPhysicianCredentialing5S Nursing areas5S Laboratory20
5-Day Kaizen: Sample StructureDay 1 & 2PlanAnalyze current state andperform root cause analysis;design future stateDay 3 & 4Do, CheckDesign & test improvementsusing Lean tools; obtainbuy-inFinalize improvements; trainprocess workers andaffected stakeholders;provide closeout briefing;CELEBRATE!Day 5Check, Act 2008 Karen Martin & Associates21
Interim Briefings to Leadership Every day or two Team presents their ideas; leadership assures teamhas considered all options and thought through allimplications Leadership’s role – not to say “no” To say “Have you considered this?” “How would wehandle ?” “What if ?” Workforce grows stronger as they learn how toidentify and eliminate waste Leadership grows stronger as they’re able to shifttheir focus to strategic planning, performancemonitoring, and coaching staff. 2008 Karen Martin & Associates22
Kaizen Event PhasesPlanningExecution4-6 Weeks Prior2-5 DaysFollowUp4-8 Weeks Post 2008 Karen Martin & Associates23
Kaizen Event CharterEvent ScopeValue Stream ImagingEvent Name Outpatient ImagingLeadershipExecutive Sponsor Allen WardProcess Trigger Referral from physicianName154351 Improve quality of referral from 65% to 90% (38% improvement)2 Eliminate patient check-in at Admitting63 Reduce LT for report sign-off from 16 hrs to 7 hrs (65% improvement)4 Reduce waiting area time from 3 hrs to 30 mins (83% improvement)87910Potential DeliverablesOn-Call Support1 Standard work for referral process / patient education pieceFunctionNameRadiologist practice presidentMarlene Diosdado2ITJerry Gambrell3MD advisotry board presDave Madden21344Possible Obstacles1 Potential Joint Commission surprise audit2 No backup if a non-team member tech calls in sick4Team 3/27/2008Presentation 3:30 - 4:30 pmTeam Members23Workforce3/27/2008; TBD (11 am - 1 pm)TrainingFunction3 Patient dissatisfaction re: "hassle factor"4 100% tech turnover in 6 months5InterimEvery day 3:30 - 4:30BriefingsEvent Coordinator Ann MarieEvent Drivers / Current State Issues5Location Conference Room ATeam Lead Sean MichaelsLast Step Referring physician receives reportEvent Goals and ObjectivesStart & End7:30 am - 4:30 pmTimesFacilitator Dave ParksFirst Step Physician's office calls scheduling department1 Losing patients to new outpatient imaging center2 Referring physician complaints re: slow report turnaroundDates 3/24 - 3/27/2008Value StreamSally McKinseyChampionSpecific Conditions CT ScansEvent Boundaries & 1,000 budgetLimitations No major program changes to Medi-TechScheduleApprovalsExecutive SponsorValue Stream ChampionFacilitatorAllen WardSally McKinseyDave ParksSignature:Date:Signature:Date:Signature:Date:
Scoping: Refining the FocusNuc MedOutpatientMRICTX-RayImagingNuc MedInpatientMRICR 2008 Karen Martin & AssociatesX-Ray25
Kaizen Event Facilitator Traits Skills / Knowledge Lean toolsRoot cause analysisProject & time managementTeam building / facilitationPeople effectiveness – from front line workers to execs Authority / Respect Designated change agent / influence leaderTrustworthyComfortable removing obstacles & reaching out to senior leadership Personality / Energy Challenging, yet supportivePositive, upbeat, energeticPushy without irritating Objectivity / Fairness No attachment to outcome 2008 Karen Martin & Associates26
The Kaizen Team The single greatest determinant of event success No more than 10 Cross-functional composition Process workersUpstream suppliers (internal)Downstream customers (internal)Subject matter expertsOutside eyesExternal suppliers / contractorsExternal customersAdministrative support (if needed)Union representatives (if relevant)Maintenance / facilities representativesManagement (limited representation) Sequestered; Must be relieved of regular duties 2008 Karen Martin & Associates27
Kaizen Event PhasesPlanning4-6 Weeks PriorExecution2-5 DaysFollowUp4-8 Weeks Post 2008 Karen Martin & Associates28
Team DynamicsPerformingAdjourningNormingStormingForming 2008 Karen Martin & AssociatesTuckman ModelBruce Tuckman, 196529
Kaizen Commandments – “Top Twelve”1.2.3.4.5.6.7.No interruptions from outside the Event.No veto power from outside the team.Rank has no privilege.Abandon departmental / silo thinking.Finger-pointing has no place.Avoid scope creep.Use creativity before capital. 2008 Karen Martin & Associates30
Kaizen Commandments (continued)8. Think “yes, if ” instead of “no, because ”9. Get good data, then add experience and“instinct” to the mix.10. Seek the wisdom of ten rather than theknowledge of one.11. Keep an open mind. Challenge existingparadigms. Challenge everything!12. Improvements implemented today arebetter than planning to implement in thefuture. 2008 Karen Martin & Associates31
Execution Phase Activities Document the Current State Perform Root Cause Analysis Brainstorm and PrioritizeImprovements Design the Improvement(s) Test the Design(s) Finalize the Design(s) Implement the Improvement(s) 2008 Karen Martin & AssociatesPlanDoCheckAct32
Execution Phase Activities Document the Current State Perform Root Cause Analysis Brainstorm and Prioritize Improvements Design the Improvement(s) Test the Design(s) Finalize the Design(s) Implement the Improvement(s) 2008 Karen Martin & Associates33
Current State DocumentationTools/Activities Go to Gemba Spaghetti Diagrams Calculate motion / transportation costs andproductivity losses MBPM Videotape Product samples Floor plans / blueprints Photos Process measurements 2008 Karen Martin & Associates34
What to Look for at Gemba “Waste walk” Workplace organization Variation in how the work is performed Work-in-process Quantity, oldest in queue, “problem” work, etc. Layout Where people are located relative to their upstreamsuppliers and downstream customersWhere people, equipment, and supplies are locatedrelative to each other Ergonomic concerns Environmental issues – noise, temperature, airquality, etc. 2008 Karen Martin & Associates35
First, Seek to Understand: Go to Gemba
Spaghetti DiagramEmergency ServicesWaiting -out/ yCASH
The Cost of Unnecessary Motion Distance traveled to printer Work Group A 92 ft. per occurrenceWork Group B 696 ft. per occurrence 120 occurrences / day 4,656 miles/year Walk pace 1 mile per hour 582 days/year ofunproductive, non-value-adding time 2.2 FTEs 2008 Karen Martin & Associates38
Understand the Current State:Metrics-Based Process Mapping (MBPM)
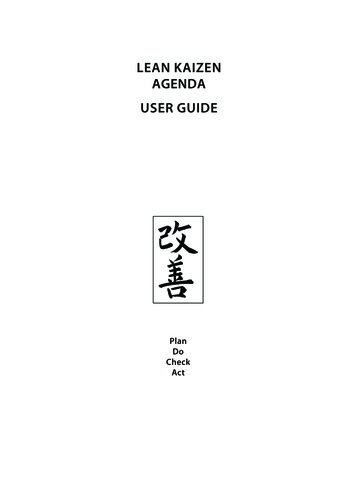
Future State Projected ResultsSummary MetricsPre-Defined Performance MetricsCurrent StateMetricValueUnitsProjected Future StateValueUnitsDesired DirectionUpDownProjectedImprovementCritical Path PT Sum140.0 minutes65.0 minutes53.6%Critical Path LT Sum2325.0 minutes405.0 minutes82.6%Activity RatioRolled First Pass Yield6.0 %16.0 %166.5%23.8 %75.3 %217.1%16 activities# of Activities8 activities50.0%Staffing MetricsCurrent StateMetricValueUnitsSum of Total PTs155.0 minutesOccurrences per Year37500 occurrencesStaffing Requirements46.6 FTEsProjected Future StateValueUnits65.0 minutes37500 occurrences19.5 FTEsProjectedChange-58.1%0.0%-58.1%
Execution Phase Activities Document the Current State Perform Root Cause Analysis Brainstorm and Prioritize Improvements Design the Improvement(s) Test the Design(s) Finalize the Design(s) Implement the Improvement(s) 2008 Karen Martin & Associates41
Root Cause Analysis 2008 Karen Martin & Associates42
Root Cause Analysis Waste is a symptom. Causes often lie very deep. Must discover the root cause to:Avoid band-aid fixes PERMANENTLY eliminate the waste. 2008 Karen Martin & Associates43
Key Root Cause Analysis Tools Five Whys Cause-and-Effect diagrams (aka Fishboneor Ishikawa diagrams) Check Sheets / Pareto Charts 2008 Karen Martin & Associates44
Execution Phase Activities Document the Current State Perform Root Cause Analysis Brainstorm and Prioritize Improvements Design the Improvement(s) Test the Design(s) Finalize the Design(s) Implement the Improvement(s) 2008 Karen Martin & Associates45
PACE Improvement Prioritization cultEase of Implementation4HighAnticipated BenefitLow
Execution Phase Activities Document the Current State Perform Root Cause Analysis Brainstorm and Prioritize Improvements Design the Improvement(s) Test the Design(s) Finalize the Design(s) Implement the Improvement(s) 2008 Karen Martin & Associates47
Building a Lean Enterprise
StandardizeWork
Install KanbanOK 2008 Karen Martin & AssociatesTime to Replenish50
Organize the WorkplaceBEFOREAFTER
Execution Phase Activities Document the Current State Perform Root Cause Analysis Brainstorm and Prioritize Improvements Design the Improvement(s) Test the Design(s) Finalize the Design(s) Implement the Improvement(s) Celebrate! 2008 Karen Martin & Associates52
Implementation Training Training must occur within the KaizenEvent itself. Therefore, it must be innovative Stand-up sessions at the work siteMultiple offerings in a conference roomConference call sessionsVoice mail blastsWeb-based supportEmail blasts (NEVER sole training method!)Designated mentors 2008 Karen Martin & Associates53
54
Kaizen EventFinal Presentation AgendaValue Stream ChampionEvent NameFacilitatorEvent DatesAgenda ItemPresenter(s)Opening Comments1 Team introductions Agenda "Rules" for attendeesScope and Objectives2 Process being addressed First & last steps Specific conditions Event drivers / current state issues Objectives Boundaries & limitations"Before" Condition3 VSM and/or MBPM review Relevant metrics Photos (if relevant)Key Improvements Implemented4 Key improvements and accomplishments implemented during the event Tools used"After" Condition56 New process description Projected results (direct and collateral)Key Open Action Items 30-Day ListSustainability Plan7 Potential obstacles that could prevent attaining projected performancelevels55
Kaizen Event PhasesPlanningExecution4-6 Weeks Prior2-5 DaysFollowUp4-8 Weeks Post 2008 Karen Martin & Associates56
Sustaining Improvement Hold weekly follow-up meetings Full team presence highly desirableEvent Facilitator or VS Champion leadsMonitor process, refine if neededTransition improvement oversight from KaizenTeam to area supervision/management Execute Sustainability Plan Update VSM Conduct 30-Day and 60-Day Audits 2008 Karen Martin & Associates57
Plan to Succeed – The Sustainability Plan58
Sustainability Plan – Page 259
60
Additional QuestionsKaren Martin, Principal7770 Regents Road #635San Diego, CA 92122(858) 677-6799ksm@ksmartin.com 2008 Karen Martin & Associates61
Auto Fax 50% Us Mail 25% MD Mailbox 25% Rework Loop via Fax 25% of the time Rolled First Pass yield 30% Patient 1 Value Stream Champion: Paul Scanner Created July 19, 2005 Refer Patient (Physician)