Transcription
HindawiJournal of SensorsVolume 2018, Article ID 4286894, 9 pageshttps://doi.org/10.1155/2018/4286894Research ArticleInexpensive Measuring System for the Characterization ofOrganic TransistorsClara Pérez-Fuster, José Vicente Lidón-Roger, Laura Contat-Rodrigo,and Eduardo García-BreijoGroup of Electronic Development and Printed Sensors (GEPDS),Instituto Interuniversitario de Investigación de Reconocimiento Molecular y Desarrollo Tecnológico (IDM),Universitat Politècnica de València, Universitat de València, Camino de Vera, s/n, 46022 Valencia, SpainCorrespondence should be addressed to Eduardo García-Breijo; egarciab@eln.upv.esReceived 22 August 2017; Revised 24 November 2017; Accepted 10 December 2017; Published 18 February 2018Academic Editor: Andreas SchützeCopyright 2018 Clara Pérez-Fuster et al. This is an open access article distributed under the Creative Commons AttributionLicense, which permits unrestricted use, distribution, and reproduction in any medium, provided the original work isproperly cited.A measuring module has been specifically designed for the electrical characterization of organic semiconductor devices such asorganic field effect transistors (OFETs) and organic electrochemical transistors (OECTs) according to the IEEE 1620-2008standard. This device has been tested with OFETs based on 6,13-bis(triisopropylsilylethinyl)pentacene (TIPS-pentacene). Themeasuring system has been constructed using a NI-PXIe-1073 chassis with integrated controller and two NI-PXI-4132programmable high-precision source measure units (SMUs) that offer a four-quadrant 100 V output, with resolution down to10 pA. LabVIEW has been used to develop the appropriate program. Most of the main OFET parameters included in the IEEE1620 standard can be measured by means of this device. Although nowadays expensive devices for the characterization ofSi-based transistors are available, devices for the characterization of organic transistors are not yet widespread in the market.Fabrication of a specific and flexible module that can be used to characterize this type of transistors would provide a powerfultool to researchers.1. IntroductionLatest trends in the electronics industry are focused on looking for alternatives to inorganic semiconductors (based onsilicon) by organic semiconductors in some applications,namely, transistors [1, 2], light-emitting diodes [3, 4], photovoltaic cells [5, 6], displays [7], sensors [8, 9], and even integrated circuits [1, 10]. These new devices use the samecircuits and mechanical structures than inorganic devices,with the advantage of being easier to develop and setup byconventional chemical techniques. Standards describing thefabrication procedures of these organic devices already exist,and substrates and other raw materials for their fabricationare commercially available at low cost [11–13].Development of these new electronic devices requirestheir electrical characterization by means of the appropriateequipment [14]. Devices used so far for this purpose are thosetraditionally used for the characterization of Si-based transistors, since the operation of organic transistors can beexplained on the basis of the Si semiconductors theory, witha good approach. However, it is of great interest to developdevices that allow organic transistors to be specificallystudied and that could contribute therefore to improve theunderstanding of their operation. Characterization of thesenew electronic devices is hindered by the very low electricalcurrent they provide (around 10 6 A), with the further difficulty that they usually require high voltages (tens of volts).Moreover, commercial systems that fulfill these characteristics are very expensive.This work aims at describing a measuring device that hasbeen specifically designed to study organic transistors, usingexclusively low-cost commercial components and a softwarethat has been specially developed for this application. Thedevice described here has great flexibility, since it can be used
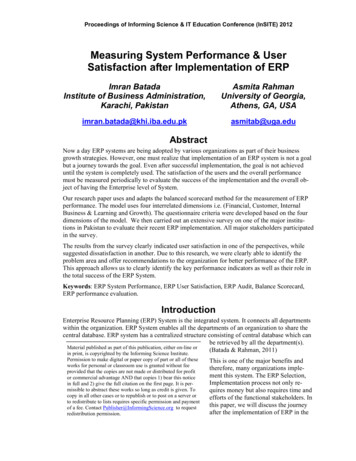
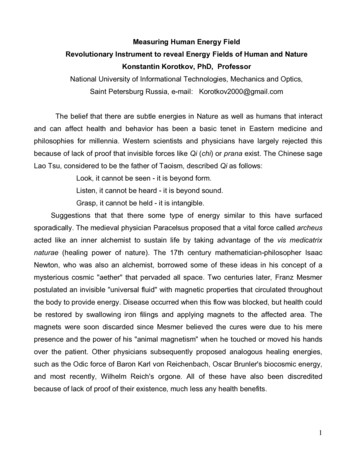
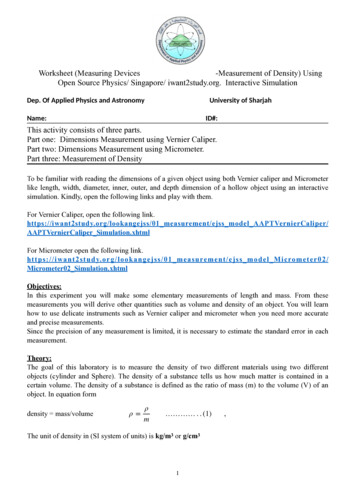
2for different types of transistors. Finally, this module hasbeen used to characterize an organic field effect transistor(OFET) based on TIPS-pentacene.OFETs have attracted increasing attention in the pastdecades due to their potential application as sensor systemsfor the detection of chemical species [15]. OFETs show superior performance compared to resistor-type, amperometric,and potentiometric sensors, and the amplification inherentto transistors enhances their sensitivity [16]. Moreover,OFETs are low cost and flexible devices that offer severalopportunities for selectivity, among others, to polar vapors[17] and vapors of small-molecule analytes [18].2. Materials and Methods2.1. OFET Fabrication. Prefabricated OFET test chips basedon low-density silicon oxide (SiO2) substrate have been used(Ossila Ltd., Sheffield, UK). Each unit consists of 5 bottomcontact/bottom-gate transistors, with 30 μm channel lengthand 1 mm channel width, gold/chrome electrodes in theactive area and chrome/aluminum electrodes in the contactpads. The substrate consists of a highly p-doped (Boron)silicon wafer coated with 100 nm thick layer of SiO2 on bothsides (Table 1). The doped silicon and the oxide layer providethe gate and the dielectric, respectively. A detailed schematicof the substrate is displayed in Figure 1.TIPS-pentacene (6,13-bis (triisopropylsilylethinyl) pentacene) has been used as a semiconductor in these OFETs[19]. This compound is a dark blue solid that is commerciallyavailable in the form of small crystals that can be dissolved inanisole, decane, toluene, and so on. Traditional depositionmethods of TIPS-pentacene are drop-casting and spincoating. In this work, drop-casting has proven to lead to better results. A solution of 2% (in weight) of TIPS-pentacene(Sigma-Aldrich, St. Louis, MS, USA) in a solvent mixturecontaining 91% anisole (Sigma-Aldrich) and 9% decane(Sigma-Aldrich) (in weight) has been used. 50 μl of the semiconductor solution has been deposited by drop-casting, positioning the substrate inside a Petri dish at 3.5 angle withrespect to the horizontal line of a flat hotplate at 50 C during5 minutes. Immediately afterwards, the glass lid has beenswapped with filter paper. The substrate has been left to cooldown for 1 minute, taking caution that the solvent condensing on the lid does not fall onto the substrate (Figure 2).HMDS (hexamethyldisilazane) (Sigma-Aldrich) treatment of the substrate surface by vaporization has been usedprior to the semiconductor deposition, in order to obtain anonpolar surface. For that, the substrate has been washedwith 2-propanol (IPA) (Sigma-Aldrich), rinsed with deionized water, and air dried. The substrate was treated in a closedPetri dish (sealed with parafilm) together with an 80 μLHMDS vial during 4 hours. Figure 3 shows TIPS-pentacenedeposition by means of this technique. A dielectric thicknessof 300 nm was achieved.The electrical characterization of this transistor has beenperformed with the measuring device described in this work,in order to test its proper operation. A detailed description ofthis device and the results obtained for this TIP-pentaceneOFET are provided in the subsequent sections.Journal of SensorsTable 1: Substrate specifications ntResistivityFront/back surfaceOxide thickness (SiO2)Capacitance20 mm 15 mm/725 25 μmCZ/(100)p-type/Boron5 10 4 to 10 2 Ω/cmPolished/etched300 5% nm 1.09 10 8 F/cm22.2. Architecture of the Measuring Device. Current flowingthrough a device is traditionally measured with an ammeterand a power supply or a (power or voltage) generator. Inrecent years, almost all of the top/medium of the range measuring devices have communication ports that allow for control of the instruments (GP-IB, RS232, USB, Ethernet, etc.).In order to plot the I-V characteristics of a device, it isnecessary to measure the drain-source current (IDS) andthe drain-source voltage (VDS) for fixed values of the gatesource voltage (VGS). That is, a VDS sweep is performed in acertain interval for every selected value of VGS, while measuring simultaneously IDS and VDS. This can be performedmanually, changing the applied voltage and measuring thecurrent point-by-point. Several programs that allow a generator and a measuring device to be controlled simultaneouslyusing a computer have now come on the market. Nowadays,there are systems that can source a voltage (or electricalcurrent) and read back the associated current (or voltage)simultaneously. These are called source and measurementunits (SMUs). A defining SMU characteristic is that theyhave four-quadrant outputs. They are able to source powerin quadrants I and III, as well as sink power in quadrants IIand IV. The device developed in this work is based on theNI-PXIe-1073 chassis (National Instruments, Austin, TX,USA). This has been connected to the PCI-e bus of a computer, in order to be controlled (either a laptop or a desktopwith Windows 7). This chassis accepts a variety of peripheralmodule types to be installed. In this work, two NI-PXI-4132SMU modules (National Instruments) have been selected.Each one of these SMUs offers up to 100 V output (withvoltage programming resolution down to 50 μV, accuracy of0.025%, and offset of 3 mV), with current measurement resolution down to 10 pA, accuracy of 0.028%, and offset of 1 nA.The combination of these features makes this system ideal forthe measurement of almost all the characteristics of organicsemiconductors. The only inconvenient is that OFET characterization requires current sensitivity into the nanoamperesrange and below, which is comparable to the module offset.This demands the use of calibration and compensation techniques to ensure correct measurement.The SMUs are in turn connected to an EverBeing PE-4probe station (EverBeing Int’l Corp., Hsinchu, Taiwan), consisting of three test probes, three micropositioners, and threetriaxial (coaxial) wires. A test probe is used in each one of theterminals of the transistor (gate, source, and drain). The testprobes can be moved in several directions with the micropositioners, which allows for measurement of any type of
Journal of Sensors33 mm1 mm0.2 mm3 mm0.03 mm2.54 mmGate maskSource-drain mask1 mmActive area mask1 mmInsulator maskSubstrate18 mm(a)(b)Figure 1: (a) Schematic and dimensions of the substrate. (b) Fabrication layers (source: Ossila).Petri dish3.5 Drop directionDropSubstrateHotplate(a)(b)Figure 2: (a) Chip preparation by drop-casting deposition (source: Ossila). (b) Top view of the chip with the pentacene solution drop.Figure 3: Microscope photograph of one of the OFETs of the Ossilalow-density chip after deposition of a TIPS-pentacene layer.transistor and wafer. The L wires of the SMU-1 and SMU-2are connected to the source, the H wire of the SMU-1 is connected to the drain, and the H wire of the SMU-2 is connected to the gate. Due to the low-level current provided bythe organic transistors, 2 wire measurements are performedfor the characterization of these transistors. Figure 4 displaysthe diagram of the complete device. An expansion cardhas been inserted on the computer motherboard via thePCI-e bus. The wire that has been used to connect thecomputer with the PXI chassis is several meters long. Thisallows the computer to be kept away from the deviceunder test (D.U.T.).The device has been programmed so that measurementsand procedures meet the IEEE 1620-2008 standard for testmethods for the characterization of organic transistors andmaterials [20], and the results can be comparable to thoseobtained with commercial instruments. The device that hasbeen developed here is able to measure and plot transfercurves (IDS versus VDS) and to calculate threshold voltage,VT, carrier mobility, μ, (both in the linear regime and the saturation regime), on/off ratio, and so forth. It can also be usedto perform measurements in a certain time interval. This canbe useful to record the change in a magnitude with time(i.e., IDS) or when a change in the characterization environment of the OFET occurs (i.e., when a pollutant is added).3. Results and Discussion3.1. Parameter Extraction Program. As previously mentioned, procedures for obtaining the characterization parameters have been developed according to the IEEE 1620-2008
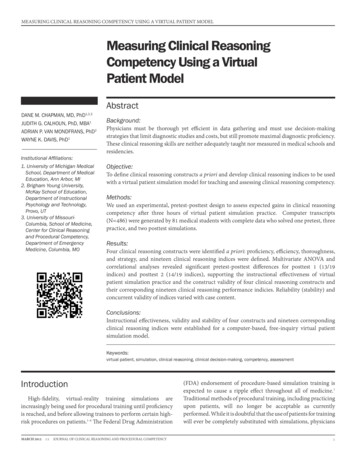
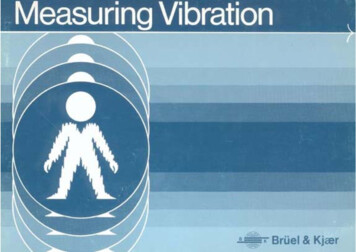
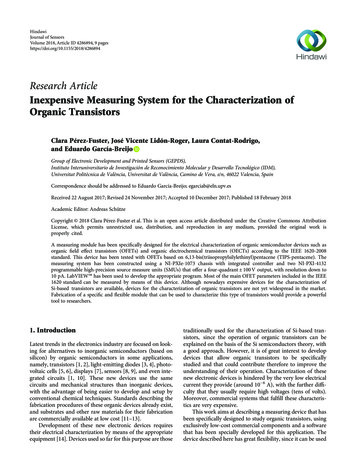
4Journal of SensorsBusPXIBusPCI-ePC(desktop)SMU 1(VGS)Wire HWire LChasisPXIWire HProbestationandD.U.T.SMU 2(VDS)Wire LFigure 4: Buses and connection diagram.standard [20]. Test methods are mainly based on the determination of the following parameters:(i) Transfer curves (IDS versus VGS), which allow fordetermination of carrier mobility, μ, and thresholdvoltage, VT.(ii) Output curves (IDS versus VDS), which allow fordetermination of the channel resistance (RDS) whenthe device operates in the ohmic (linear) regimeand the characteristics of the saturation regime.These curves can also be used to determine whetherthe device exhibits FET-like behaviour.(iii) Gate leakage curves (IGS versus VGS), which allow forcharacterization of the gate dielectric quality and fordetermination of the leakage current from the gate tothe channel (Ileakage).The test system is controlled by a program that has beendeveloped using LabVIEW (National Instruments). Fourmodules of this system are currently available: IDS versusVDS measurement, IDS versus VGS measurement, IDS versustime measurement, and IGS versus VGS measurement.Figure 5 shows the flowchart of the different measurementprocedures of the test system.3.1.1. IDS versus VDS Module. This module is based on themeasurement of the drain characteristics. The drain current(IDS) is measured versus the drain voltage (VDS) for differentgate voltages (VGS). Figure 6 shows a screenshot of this module and Figure 7 displays the output curves corresponding tothe TIPS-pentacene OFET described previously. Configuration of the following parameters is required to run this module: VDS start, VDS stop, VDS step, IDS current limit, and VDSdelay (dwell time). The dwell time corresponds to the duration from the time when the measurement voltage is appliedto the time when the measurement is recorded. This parameter is used to minimize measurement errors due to currenttransients.Two types of tests can be performed. The first test(VGS sweep) consists of a scan between two selected valuesof VGS, that is, the VDS value is swept between two limitsfor each VGS step. As a result, a set of curves is obtained. Inthe second test (VGS fixed), a scan is performed for a fixedVGS. As a result, a single characteristic curve is obtained.3.1.2. IDS versus VGS Module. This module is based on a transfer measurement (IDS versus VGS for a fixed VDS). This curveallows for the determination of additional parameters likethreshold voltage (VT), on/off ratio (Ion/Ioff ), subthresholdswing (S) and carrier mobility (μ). Moreover, measurementscan be performed either in the linear regime or in the saturation regime.(1) Linear Regime. Two types of scans can be performed forthe determination of IDS versus VGS in the linear regime: simple (single linear scan) and hysteresis (there-and-back scan).The threshold voltage (VT) corresponds to the interceptionwith the x-axis (VGS) of the straight line with the same slopein the linear part of the IDS-VGS curve (Figure 8(a)). The on/off ratio (Ion/Ioff ) can also be determined by dividing themaximum IDS value by the minimum IDS value obtainedfrom the transfer curve.The carrier mobility (μ) of the semiconductor can also bederived through transfer curve measurement of the device, incombination with geometric and electrical parameters of theOFET that are additional inputs to be provided by the user.Carrier mobility also requires knowledge of the slope of thelinear part of the transfer curve. The program developed hereallows for the determination of carrier mobility by means ofthree different methods:(i) Backward derivative (B.D.):μ BD 11L I DS V h ‐I DS V , Cox V DS Wh1(ii) Two-point derivative (T.P.):μ TP 11L I DS V h ‐I DS V‐h , Cox V DS W2h2(iii) Least square fit derivative (alpha):μα 11L α V GS , Cox V DS W3where Cox is the capacitance per unit area, VDS is the voltagemeasured between the drain electrode and the source
Journal of Sensors5StartOn PXI-1073On PCTransistor onprobestationMeasureIDS versus VDS?NoYesMeasureIDS versus VGS?NoYesOn IDS versus VGSOn IDS versus VGSData VDS and VGSDataVDS, VGS, W, L,Cox, linealsaturationGraphIDS versus VDSGraphIDS versus VGSSave?NoVTH,ION/IOFF,S, 𝜇 ?YesFile ExcelNoYesCursors in thegraphIDS versus VGSSave?NoYesFile ExcelEndGraphmobility (𝜇)Figure 5: Flowchart of the test system.electrode (fixed value), L is the channel length, W is the channel width, IDS is the current flow measured through the drainelectrode, and h is the step between two consecutive VGS. Theslope α is determined with three points of the curve by theleas-squares method. Figure 9(a) shows an example of thedetermination of carrier mobility using the backward derivative method.(2) Saturation Regime. The OFET behaviour in the saturationregime can be properly displayed in an I-V diagram, wherethe square root of IDS and the logarithm of IDS are plottedversus VGS. Figure 8(b) shows an example of this diagram.The threshold voltage (VT) can be obtained similarly to thatof the linear regime, using the curve of the square root ofthe drain current (IDS) versus the gate-source voltage (VGS).The on/off ratio (Ion/Ioff ) can be obtained from the maximumand minimum values of the curve of the logarithm of IDSversus VGS. The subthreshold swing (S) corresponds to themaximum slope of the log(IDS) versus VGS curve in thesaturation regime. Carrier mobility (μ) in the saturationregime can also be obtained similarly to that of the linearregime (Figure 9(b)).3.1.3. Measurements as a Function of Time. OFETs in generalhave been demonstrated as effective sensors in both liquid(H , glucose, hydrogen peroxide, Cu(II) ions, etc.) andgaseous environments (water vapor, chloroform, ammonia,
6Journal of SensorsFigure 6: Screenshot of the program running the IDS versus VDS module.1 10 7values of VGS, VDS, and storage time, IDS values are displayed in real time. Furthermore, since sensing experiments are usually performed while changing the analyteconcentration, the program developed here can also indicate when the change in concentration occurs.0IDS (A) 1 10 7 2 10 7 3 10 7 4 10 7 5 10 7 6 10 7 40 30VGS 0 VVGS 5 VVGS 10 V 20VDS (V)VGS 15 VVGS 20 VVGS 25 V 100VGS 30 VVGS 35 VVGS 40 VFigure 7: IDS-VDS curves of the TIPs-pentacene OFET.etc.) [15]. Response of these sensors is usually not immediate, since the semiconductor has to react with the analyte. In order to study the OFET behaviour in transients,a module that monitors changes of IDS with time has beenincluded in the characterization program. By providing3.1.4. IGS versus VGS Measurements. This is the mostdemanding measurement of the acquisition system, sinceIGS is very small and several orders of magnitude below IDS(which is also small by itself). Thus, to perform this measurement, the sensitivity in the determination of VGS by the SMUmust be enhanced as much as possible. This in turn leads to asignificant increase in the measurement time. Figure 10shows an example of the gate leakage measurement performed with this device.3.2. Characterization of the TIPS-Pentacene OFET. Themain characteristic parameters of the TIPS-pentaceneOFET that have been determined in this work accordingto the IEEE 1620-2008 standard are summarized in Table 2.The threshold voltage that has been obtained is in goodagreement with that reported by Ossila for this transistor. Abetter carrier mobility has been found than that reported byOssila [21].3.3. Comparison with a Standard Semiconductor Test System.A comparative measurement has been made between the
Journal of SensorsVDS 40 V 10 6VDS 25 V1.0 1/2 (A1/2)ISDIDS (A) 4 10 7 3 10 7 2 10 710 310 75.0 10 4 1 10 710 8VT 11.7921
measuring system has been constructed using a NI-PXIe-1073 chassis with integrated controller and two NI-PXI-4132 programmable high-p