Transcription
Utilise the 15 brand new, interactivecharting indicators. Enhance yourtrading experience with the MiniChart, Magnifier, a Renko Barsgenerator, freehand drawer and more.Discover more onhow to use them within.
ThinkMarkets - MT4 Super User Guide For IndicatorsMINI CHART INDICATOR1.Overview . 22.Using the Mini Chart indicator . 32.1Adding the indicator to a chart . 32.2Choosing the symbol . 32.2.12.3Inverting prices . 3Chart timeframe / type . 32.3.1Seconds charts . 42.3.2Tick charts . 42.3.3Tick lines . 42.3.4Renko, Range, Kagi, and Point & Figure charts . 42.4Data transformations .62.5Drawing style and colours .62.6Minimum, maximum, and grid . 72.6.1Maximum and minimum . 72.6.2Horizontal grid . 72.6.3Vertical grid . 72.7Size and position . 72.8Indicators .82.8.1Moving averages (SMA, EMA, SMMA, LWMA) .82.8.2Bollinger bands.82.8.3Envelopes (SMA and EMA) .92.8.4D1 high and low .92.8.5H1 high and low .92.8.6Linear regression .92.8.7Fixed price .92.8.8Current bid price .9Page 1 of 76
ThinkMarkets - MT4 Super User Guide For Indicators1.OverviewThe Mini Chart indicator creates a chart in a draggable, resizable sub-window inside amain MT4 chart. It lets you see the price action on other instruments and/or timeframeswithout needing to switch between different MT4 charts.The Mini Chart has a wide variety of features: Timeframes such as M4 and H3 in addition to standard timeframes such as M1 orH1 Tick bars (e.g. bars made up of 10 ticks each) and seconds bars (e.g. 20-secondbars) Range, Renko, Kagi and Point & Figure charts Data-transformations such as Heikin Ashi and Three Line BreakAlthough you cannot add MT4 indicators to a Mini Chart, it does provide its own optionsfor showing popular indicator calculations such as moving averages and Bollinger bands.Page 2 of 76
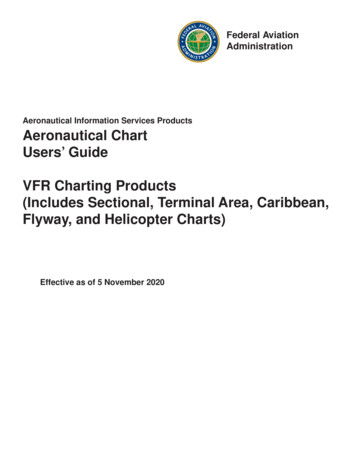
ThinkMarkets - MT4 Super User Guide For Indicators2.Using the Mini Chart indicator2.1Adding the indicator to a chartYou add the Mini Chart indicator to a chart in the usual MT4 way, either by dragging itfrom the Navigator onto a chart, or by double-clicking on it in the Navigator. You canalso use standard MT4 features such as adding the indicator to your list of Favorites, orassigning a Hotkey to it.You need to turn on the “Allow DLL imports” setting in the “Common” tab of theindicator’s options:2.2Choosing the symbolYou set the symbol to display using the Symbol parameter in the Inputs tab. The symbolmust be present in the MT4 market watch, and you should include any suffix which youraccount has for symbol names, e.g. EURUSD To display more than one symbol, you simply add multiple copies of the indicator to thechart.You can also leave the symbol set to (current). This will then display the same symbol asthe main MT4 chart, and will change if the main chart changes.2.2.1Inverting pricesYou can invert prices by turning on the option on the Inputs tab. For example, this willconvert USDJPY into JPYUSD.2.3Chart timeframe / typeYou choose the chart timeframe, or a type such as Kagi, using the option on the Inputstab.Page 3 of 76
ThinkMarkets - MT4 Super User Guide For IndicatorsIf you leave the timeframe set to (current) then the Mini Chart will use the sametimeframe as the main MT4 chart, and will change if the main chart changes.The Mini Chart offers a range of different timeframes and chart types: Standard timeframes such as M5 and H1 Extra timeframes such as M4 and H6 Sub-minute, seconds-based time periods such as S10 and S30 Tick-lines, i.e. lines showing each change in the ask and bid price Tick charts, i.e. candles which are not time-based and are instead made up of thesame number of ticks 2.3.1Price-based charts such as Renko and KagiSeconds chartsMT4 does not have historic data at frequencies under 1 minute (M1). Therefore, the MiniChart cannot show a history for a seconds-period such as S30 when it loads. Theindicator can only start recording and showing the data from the time that it startsrunning.2.3.2 Tick chartsTick charts draw a new bar every N ticks (i.e. they are based on activity, not on time). Youneed to fill in the number of ticks you want to use in the setting on the Inputs tab.As with seconds charts, MT4 does not have historic data at frequencies under 1 minute(M1), and can only show the tick bars from the time that the indicator starts running.2.3.3 Tick linesA tick-lines chart shows the ask and bid prices as separate lines, updating whenevereither the ask or bid price changes (i.e. each new tick).2.3.4 Renko, Range, Kagi, and Point & Figure chartsRenko, Range, Kagi, and Point & Figure charts are price-based rather than time-based,and draw new bars based on price movement instead of time elapsing. All of them use a“block” size, which you set using the Inputs tab. This defines the minimum pricemovement which is required before the chart changes. It can be set either to a pricePage 4 of 76
ThinkMarkets - MT4 Super User Guide For Indicatorsamount (e.g. 0.0010), or a value in pips (e.g. 10), or to a percentage change (notapplicable to P&F). Range charts: a new bar is drawn each time that the price rises or falls by theblock size. The Mini Chart indicator also offers stacked range charts, whereconsecutive bars in the same direction are combined into a single bar. Renko charts: similar to range charts, but the price must reverse by two wholeblocks before a new block is drawn in the opposite direction to the current trend.The Mini Chart indicator offers a variant on standard Renko charts which drawsthe “tails” on each bar, i.e. the movement in each bar against the trend. Kagi charts: the chart changes direction when the price reverses by the block sizefrom the previous high/low. Each additional movement in the direction of thecurrent trend extends the Kagi line, and therefore, unlike range or Renko charts,Kagi highs and lows are not aligned to a grid. Point and Figure charts: similar to range charts, but traditionally drawn in adifferent way, with consecutive movements stacked rather than displayed asseparate bars, and with a reversal rule where a new bar is not drawn in theopposite direction until the prices reverses by three units.2.3.4.1Reversal factorFor Range and P&F charts you can also set the “reversal” amount which is requiredbefore the chart changes direction. If left at zero, then Range charts will use a reversalfactor of 1 – i.e. the threshold for a new block in the opposite direction is the same as fora continuation – and P&F charts will use the standard P&F reversal factor of 3 – i.e. theprice must reverse by 3 units before a new column is drawn on the P&F chart.2.3.4.2Base timeframe for Range, Renko, Kagi, and P&F chartsWhen the Mini Chart indicator loads, it will create historic data for Range, Renko, Kagi,and P&F charts using the price history in the trading platform.By default this creates the history from M1 data. If you use a large block size (e.g. 1 wholecent, price change of 0.01, on EUR/USD), then there may not be many historic blocksover the period covered by the M1 data in the platform.To go further back in time you can choose a longer base period such as M30 or H1. Thedisadvantage of longer timeframes is that the Mini Chart cannot be certain whathappened inside each historic bar. It can only “see” the high and low. If a historic barcovers a price range such as 0.04, and the block size is 0.01, then the Mini Chart does notPage 5 of 76
ThinkMarkets - MT4 Super User Guide For Indicatorsknow, and has to guess, whether the price went up/down in four simple sequentialblocks rather than bouncing up and down within the bar, creating several historic blocks.2.4Data transformationsThe Mini Chart indicator provides popular transformations of the bar data: Heikin Ashi Three Line Break 2-bar average (i.e. each bar is the average of itself and the previous bar) 3-bar average(Transformations are different to chart types such as Kagi or Renko. With a chart typesuch as Kagi, there is a price-based rule for when/how to draw each new bar, i.e. a rulewhich is not simply based on time such as H1 or S30. A transformation such as HeikinAshi takes bar data such as H1 and applies averaging to it. A Heikin Ashi chart has anunderlying timeframe, such as H1. A Kagi or Renko chart does not.)2.5Drawing style and coloursYou can use the Inputs tab to change the style and colours. The Mini Chart offers a rangeof drawing styles: Candles Bars (i.e. a central high-low bar with open and close horizontal markers) A line showing each close price Close points (i.e. dots at each close price, without a line) Lines showing the high and low (but not the close) A filled channel showing the high and low, with a line showing the close inside thechannel No drawing – the bars themselves are not drawn, and only indicators aredisplayed.Please note: the drawing style is fixed for tick-lines, Kagi, and P&F charts. Changing thestyle setting has no effect for these types of chart.Page 6 of 76
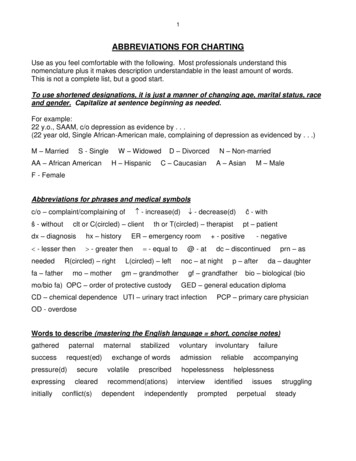
ThinkMarkets - MT4 Super User Guide For Indicators2.6Minimum, maximum, and grid2.6.1 Maximum and minimumBy default the Mini Chart will automatically select a high and low range to draw based onthe bars which are visible (as MT4 itself does). You can use the Inputs tab to tell the MiniChart to include any indicator values in the high-low. Otherwise, as in MT4, indicatorvalues may be invisible off the top or bottom end of the chart.You can also set a fixed maximum and/or minimum price for the chart using the Inputstab.2.6.2 Horizontal gridBy default the Mini Chart will automatically draw horizontal grid lines. It will choose thenearest power of 10 (e.g. 0.01, 0.001) which does not create an excessive number ofvisible lines.You can set a specific grid size using the Inputs tab, setting the parameter to a priceamount such as 0.0020, or you can turn off the grid entirely by setting the parameter tozero.2.6.3 Vertical gridBy default the Mini Chart will automatically draw vertical grid lines based on the charttimeframe/type which you select. You can change the vertical grid lines, or turn them off,using the Inputs tab.Please note: for chart types such as Renko and Kagi which are based on price movementrather than time, the vertical grid lines will not be evenly spaced.2.7Size and positionYou can use the Inputs tab to set the indicator’s initial position within the MT4 chart. Youcan define a position in terms of pixels (replacing the default values of -1) from a specificcorner of the chart.The Mini Chart is both draggable and resizable, in the usual way by pressing and holdingthe mouse over the sub-window’s title bar or border. By default the indicator will thenchoose a corner of the chart to “dock” itself to. For example, if you drag the sub-windowclose to the bottom-right corner, the indicator will then dock itself to that corner of thePage 7 of 76
ThinkMarkets - MT4 Super User Guide For Indicatorschart. If you resize the chart window, the indicator will automatically re-position itself sothat it maintains the distance from the edge(s) of the chart. You can manually overridethe docking using the setting on the Inputs tab.You can also change the following settings for the chart: The zoom level, i.e. how large each candle/bar is The amount of space (in pixels) at the top and bottom of the chart The amount of space (in pixels) at the right of the chart (i.e. equivalent to thechart-shift on MT4’s own chart) The height of the bar which shows the time and price corresponding to theposition of the mouse. You can turn off this information bar entirely by settingthe height to zero.2.8IndicatorsYou cannot add MT4 indicators (e.g. moving averages) to a Mini Chart, but you can usethe Inputs tab to configure the display of popular indicator calculations. This includesdrawing lines at fixed prices, i.e. the equivalent of drawing a horizontal line on a mainMT4 chart.You can define up to 10 indicator calculations. For each one, you can choose a drawingstyle and a colour.For some indicators, you can change the parameters and/or or the type of price – close,high, low etc – which is used in the indicator calculation. In other words, the meaning ofthe Parameter A and Parameter B values on the Inputs tab depends on the type ofindicator, as described below.2.8.1 Moving averages (SMA, EMA, SMMA, LWMA)The Parameter A value defines the period for the moving average calculation. You canalso choose which price to apply the average to. Parameter B is unused.2.8.2 Bollinger bandsThe Parameter A value defines the period for the average (the mid-point of the bands).The parameter B value defines the number of deviations for the bands, from the midpoint. You can also choose which type of price to use in the calculation.Page 8 of 76
ThinkMarkets - MT4 Super User Guide For Indicators2.8.3 Envelopes (SMA and EMA)The Parameter A value defines the period for the moving average (the mid-point of theenvelope bands). The Parameter B value defines the % for the envelopes, e.g. 0.1% fromthe moving average mid-point. You can also choose which type of price to use in thecalculation2.8.4 D1 high and lowDraws horizontal lines at the D1 high and low. The Parameter A value defines the offset,and the Parameter B value defines the number of D1 bars to include (defaulting to 1 if leftat zero).For example, Parameter A 1 and Parameter B 3 means “the high and low of the 3 D1bars starting yesterday”.2.8.5 H1 high and lowSame as the D1 high and low, with the same meaning for the Parameter A and ParameterB values, but using H1 data rather than D1 data.2.8.6 Linear regressionDraws a line showing the linear regression of the last N bars, defined by the Parameter Avalue. You can choose which type of price is used in the calculation (e.g. linear regressionof the highs rather than the closes). The Parameter B value is unused.2.8.7 Fixed priceDraws a horizontal line at the fixed price specified by Parameter A, i.e. the equivalent ofmanually drawing a horizontal line on an MT4 chart. You can also use the Parameter Bvalue to draw a second line at a different price.2.8.8 Current bid priceDraws a horizontal line at the current bid price (i.e. constantly changing). The ParameterA and B values and the price-type are not used.Page 9 of 76
ThinkMarkets - MT4 Super User Guide For IndicatorsPIVOT INDICATOR1.Overview . 112.Using the Pivot indicator . 122.1Adding the indicator to a chart . 122.2Timeframe . 122.3Pivot calculation . 122.4Drawing options . 122.5Alerts . 13Page 10 of 76
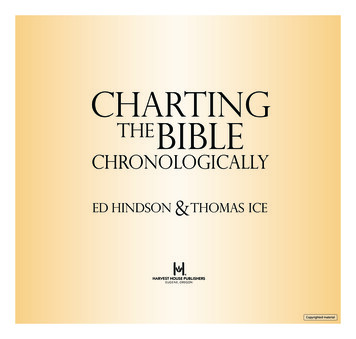
ThinkMarkets - MT4 Super User Guide For Indicators1.OverviewThe Pivot indicator shows a classic pivot calculation based on historic price action: acentral pivot price, with 3 support and resistance levels either side (R1-R3 and S1-S3).The indicator can be based on any timeframe – for example, you can choose to displayH4 pivot levels on an M30 chart – and you can configure the indicator to generate alertswhen the current price crosses a support or resistance level.Page 11 of 76
ThinkMarkets - MT4 Super User Guide For Indicators2.Using the Pivot indicator2.1Adding the indicator to a chartYou add the Pivot indicator to a chart in the usual MT4 way, either by dragging it fromthe Navigator onto a chart, or by double-clicking on it in the Navigator. You can also usestandard MT4 features such as adding the indicator to your list of Favorites, or assigninga Hotkey to it.All the following options in the indicator are configured using the settings on its Inputstab.If you want to display more than one set of pivot points, either using differenttimeframes or different calculations, then you simply add multiple copies of the indicatorto the chart.2.2TimeframeYou choose the timeframe for the pivot calculating using the first of the parameters onthe Inputs tab. You can either make this the same as the current chart, so that the pivotcalculation changes if you alter the timeframe of the chart, or the pivot can be a differentfixed timeframe such as D1.2.3Pivot calculationYou can choose how many historic bars to include in the pivot calculation – 1 (standard),2 or 3 – and you can also choose between different calculations of the central pivot point.The options for the pivot calculation are as follows: “Typical” price of previous bar(s): high low close / 3 “Weighted” price of previous bar(s): high low close close / 4 “Median” price of previous bar(s): high
ThinkMarkets - MT4 Super User Guide For Indicators Page 7 of 76 2.6 Minimum, maximum, and grid 2.6.1 Maximum and minimum By default the Mini Chart will automatically select a high and low range to draw based on the bars which are visible (as MT4