Transcription
Mini ChartIndicator
1.2.Overview. 2Using the Mini Chart indicator. 32.1 Adding the indicator to a chart . 32.2 Choosing the symbol . 32.2.1 Inverting prices . 32.3 Chart timeframe / type . 32.3.1 Seconds charts. 42.3.2 Tick charts . 42.3.3 Tick lines . 42.3.4 Renko, Range, Kagi, and Point & Figure charts . 42.4 Data transformations. 62.5 Drawing style and colours. 62.6 Minimum, maximum, and grid . 72.6.1 Maximum and minimum . 72.6.2 Horizontal grid . 72.6.3 Vertical grid . 72.7 Size and position . 72.8 Indicators . 82.8.1 Moving averages (SMA, EMA, SMMA, LWMA) . 82.8.2 Bollinger bands . 82.8.3 Envelopes (SMA and EMA) . 92.8.4 D1 high and low. 92.8.5 H1 high and low. 92.8.6 Linear regression. 92.8.7 Fixed price . 92.8.8 Current bid price . 9Page 1 of 9
1.OverviewThe Mini Chart indicator creates a chart in a draggable, resizable sub-window insidea main MT4 chart. It lets you see the price action on other instruments and/ortimeframes without needing to switch between different MT4 charts.The Mini Chart has a wide variety of features: Timeframes such as M4 and H3 in addition to standard timeframes such asM1 or H1Tick bars (e.g. bars made up of 10 ticks each) and seconds bars (e.g. 20second bars)Range, Renko, Kagi and Point & Figure chartsData-transformations such as Heikin Ashi and Three Line BreakAlthough you cannot add MT4 indicators to a Mini Chart, it does provide its ownoptions for showing popular indicator calculations such as moving averages andBollinger bands.Page 2 of 9
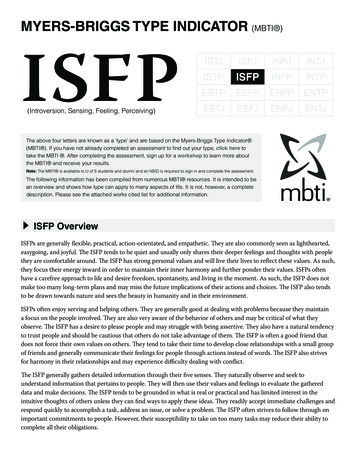
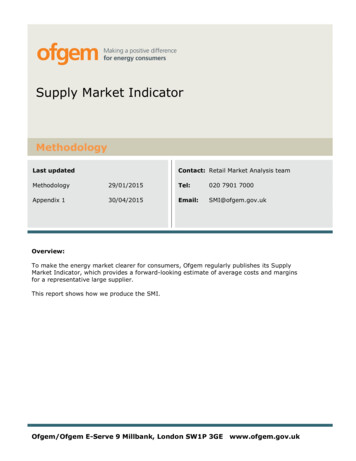
2.Using the Mini Chart indicator2.1Adding the indicator to a chartYou add the Mini Chart indicator to a chart in the usual MT4 way, either by draggingit from the Navigator onto a chart, or by double-clicking on it in the Navigator. Youcan also use standard MT4 features such as adding the indicator to your list ofFavorites, or assigning a Hotkey to it.You need to turn on the “Allow DLL imports” setting in the “Common” tab of theindicator’s options:2.2Choosing the symbolYou set the symbol to display using the Symbol parameter in the Inputs tab. Thesymbol must be present in the MT4 market watch, and you should include any suffixwhich your account has for symbol names, e.g. EURUSD To display more than one symbol, you simply add multiple copies of the indicator tothe chart.You can also leave the symbol set to (current). This will then display the samesymbol as the main MT4 chart, and will change if the main chart changes.2.2.1Inverting pricesYou can invert prices by turning on the option on the Inputs tab. For example, thiswill convert USDJPY into JPYUSD.2.3Chart timeframe / typeYou choose the chart timeframe, or a type such as Kagi, using the option on theInputs tab.Page 3 of 9
If you leave the timeframe set to (current) then the Mini Chart will use the sametimeframe as the main MT4 chart, and will change if the main chart changes.The Mini Chart offers a range of different timeframes and chart types: Standard timeframes such as M5 and H1Extra timeframes such as M4 and H6Sub-minute, seconds-based time periods such as S10 and S30 Tick-lines, i.e. lines showing each change in the ask and bid priceTick charts, i.e. candles which are not time-based and are instead made up ofthe same number of ticksPrice-based charts such as Renko and Kagi 2.3.1Seconds chartsMT4 does not have historic data at frequencies under 1 minute (M1). Therefore, theMini Chart cannot show a history for a seconds-period such as S30 when it loads.The indicator can only start recording and showing the data from the time that itstarts running.2.3.2Tick chartsTick charts draw a new bar every N ticks (i.e. they are based on activity, not ontime). You need to fill in the number of ticks you want to use in the setting on theInputs tab.As with seconds charts, MT4 does not have historic data at frequencies under 1minute (M1), and can only show the tick bars from the time that the indicator startsrunning.2.3.3Tick linesA tick-lines chart shows the ask and bid prices as separate lines, updating whenevereither the ask or bid price changes (i.e. each new tick).2.3.4Renko, Range, Kagi, and Point & Figure chartsRenko, Range, Kagi, and Point & Figure charts are price-based rather than timebased, and draw new bars based on price movement instead of time elapsing. All ofthem use a “block” size, which you set using the Inputs tab. This defines thePage 4 of 9
minimum price movement which is required before the chart changes. It can be seteither to a price amount (e.g. 0.0010), or a value in pips (e.g. 10), or to a percentagechange (not applicable to P&F). 2.3.4.1Range charts: a new bar is drawn each time that the price rises or falls by theblock size. The Mini Chart indicator also offers stacked range charts, whereconsecutive bars in the same direction are combined into a single bar.Renko charts: similar to range charts, but the price must reverse by two wholeblocks before a new block is drawn in the opposite direction to the currenttrend. The Mini Chart indicator offers a variant on standard Renko chartswhich draws the “tails” on each bar, i.e. the movement in each bar against thetrend.Kagi charts: the chart changes direction when the price reverses by the blocksize from the previous high/low. Each additional movement in the direction ofthe current trend extends the Kagi line, and therefore, unlike range or Renkocharts, Kagi highs and lows are not aligned to a grid.Point and Figure charts: similar to range charts, but traditionally drawn in adifferent way, with consecutive movements stacked rather than displayed asseparate bars, and with a reversal rule where a new bar is not drawn in theopposite direction until the prices reverses by three units.Reversal factorFor Range and P&F charts you can also set the “reversal” amount which is requiredbefore the chart changes direction. If left at zero, then Range charts will use areversal factor of 1 – i.e. the threshold for a new block in the opposite direction is thesame as for a continuation – and P&F charts will use the standard P&F reversalfactor of 3 – i.e. the price must reverse by 3 units before a new column is drawn onthe P&F chart.2.3.4.2Base timeframe for Range, Renko, Kagi, and P&F chartsWhen the Mini Chart indicator loads, it will create historic data for Range, Renko,Kagi, and P&F charts using the price history in the trading platform.By default this creates the history from M1 data. If you use a large block size (e.g. 1whole cent, price change of 0.01, on EUR/USD), then there may not be manyhistoric blocks over the period covered by the M1 data in the platform.To go further back in time you can choose a longer base period such as M30 or H1.The disadvantage of longer timeframes is that the Mini Chart cannot be certain whatPage 5 of 9
happened inside each historic bar. It can only “see” the high and low. If a historic barcovers a price range such as 0.04, and the block size is 0.01, then the Mini Chartdoes not know, and has to guess, whether the price went up/down in four simplesequential blocks rather than bouncing up and down within the bar, creating severalhistoric blocks.2.4Data transformationsThe Mini Chart indicator provides popular transformations of the bar data: Heikin AshiThree Line Break2-bar average (i.e. each bar is the average of itself and the previous bar) 3-bar average(Transformations are different to chart types such as Kagi or Renko. With a charttype such as Kagi, there is a price-based rule for when/how to draw each new bar,i.e. a rule which is not simply based on time such as H1 or S30. A transformationsuch as Heikin Ashi takes bar data such as H1 and applies averaging to it. A HeikinAshi chart has an underlying timeframe, such as H1. A Kagi or Renko chart doesnot.)2.5Drawing style and coloursYou can use the Inputs tab to change the style and colours. The Mini Chart offers arange of drawing styles: CandlesBars (i.e. a central high-low bar with open and close horizontal markers)A line showing each close priceClose points (i.e. dots at each close price, without a line) Lines showing the high and low (but not the close) A filled channel showing the high and low, with a line showing the close insidethe channelNo drawing – the bars themselves are not drawn, and only indicators aredisplayed. Please note: the drawing style is fixed for tick-lines, Kagi, and P&F charts. Changingthe style setting has no effect for these types of chart.Page 6 of 9
2.6Minimum, maximum, and grid2.6.1Maximum and minimumBy default the Mini Chart will automatically select a high and low range to drawbased on the bars which are visible (as MT4 itself does). You can use the Inputs tabto tell the Mini Chart to include any indicator values in the high-low. Otherwise, as inMT4, indicator values may be invisible off the top or bottom end of the chart.You can also set a fixed maximum and/or minimum price for the chart using theInputs tab.2.6.2Horizontal gridBy default the Mini Chart will automatically draw horizontal grid lines. It will choosethe nearest power of 10 (e.g. 0.01, 0.001) which does not create an excessivenumber of visible lines.You can set a specific grid size using the Inputs tab, setting the parameter to a priceamount such as 0.0020, or you can turn off the grid entirely by setting the parameterto zero.2.6.3Vertical gridBy default the Mini Chart will automatically draw vertical grid lines based on the charttimeframe/type which you select. You can change the vertical grid lines, or turn themoff, using the Inputs tab.Please note: for chart types such as Renko and Kagi which are based on pricemovement rather than time, the vertical grid lines will not be evenly spaced.2.7Size and positionYou can use the Inputs tab to set the indicator’s initial position within the MT4 chart.You can define a position in terms of pixels (replacing the default values of -1) from aspecific corner of the chart.The Mini Chart is both draggable and resizable, in the usual way by pressing andholding the mouse over the sub-window’s title bar or border. By default the indicatorwill then choose a corner of the chart to “dock” itself to. For example, if you drag thesub-window close to the bottom-right corner, the indicator will then dock itself to thatPage 7 of 9
corner of the chart. If you resize the chart window, the indicator will automatically reposition itself so that it maintains the distance from the edge(s) of the chart. You canmanually override the docking using the setting on the Inputs tab.You can also change the following settings for the chart: The zoom level, i.e. how large each candle/bar isThe amount of space (in pixels) at the top and bottom of the chart The amount of space (in pixels) at the right of the chart (i.e. equivalent to thechart-shift on MT4’s own chart)The height of the bar which shows the time and price corresponding to theposition of the mouse. You can turn off this information bar entirely by settingthe height to zero. 2.8IndicatorsYou cannot add MT4 indicators (e.g. moving averages) to a Mini Chart, but you canuse the Inputs tab to configure the display of popular indicator calculations. Thisincludes drawing lines at fixed prices, i.e. the equivalent of drawing a horizontal lineon a main MT4 chart.You can define up to 10 indicator calculations. For each one, you can choose adrawing style and a colour.For some indicators, you can change the parameters and/or or the type of price –close, high, low etc – which is used in the indicator calculation. In other words, themeaning of the Parameter A and Parameter B values on the Inputs tab depends onthe type of indicator, as described below.2.8.1Moving averages (SMA, EMA, SMMA, LWMA)The Parameter A value defines the period for the moving average calculation. Youcan also choose which price to apply the average to. Parameter B is unused.2.8.2Bollinger bandsThe Parameter A value defines the period for the average (the mid-point of thebands). The parameter B value defines the number of deviations for the bands, fromthe mid-point. You can also choose which type of price to use in the calculation.Page 8 of 9
2.8.3Envelopes (SMA and EMA)The Parameter A value defines the period for the moving average (the mid-point ofthe envelope bands). The Parameter B value defines the % for the envelopes, e.g.0.1% from the moving average mid-point. You can also choose which type of price touse in the calculation2.8.4D1 high and lowDraws horizontal lines at the D1 high and low. The Parameter A value defines theoffset, and the Parameter B value defines the number of D1 bars to include(defaulting to 1 if left at zero).For example, Parameter A 1 and Parameter B 3 means “the high and low of the3 D1 bars starting yesterday”.2.8.5H1 high and lowSame as the D1 high and low, with the same meaning for the Parameter A andParameter B values, but using H1 data rather than D1 data.2.8.6Linear regressionDraws a line showing the linear regression of the last N bars, defined by theParameter A value. You can choose which type of price is used in the calculation(e.g. linear regression of the highs rather than the closes). The Parameter B value isunused.2.8.7Fixed priceDraws a horizontal line at the fixed price specified by Parameter A, i.e. the equivalentof manually drawing a horizontal line on an MT4 chart. You can also use theParameter B value to draw a second line at a different price.2.8.8Current bid priceDraws a horizontal line at the current bid price (i.e. constantly changing). TheParameter A and B values and the price-type are not used.Page 9 of 9
Level 16, Tower One727 Collins StreetMelbourne VIC 3008AUSTRALIA2Local Call 1300 033 375Phone 61 3 9020 0155Fax 61 3 8679 4408www.pepperstone.comsupport@pepperstone.com
By default the Mini Chart will automatically select a high and low range to draw based on the bars which are visible (as MT4 itself does). You can use the Inputs tab to tell the Mini Chart to include any indicator values in the high-low. Otherwise, as in MT4, indicat