Transcription
The Leading Ultra-Low-Cost Airline ServingMexico and the USMay 2015
DisclaimerThe information ("Confidential Information") contained in this presentation is confidential and is provided by ControladoraVuela Compañía de Aviación, S.A.B. de C.V., (d/b/a Volaris, the "Company") confidentially to you solely for your referenceand may not be retransmitted or distributed to any other persons for any purpose whatsoever. The Confidential Informationis subject to change without notice, its accuracy is not guaranteed, it has not been independently verified and it may notcontain all material information concerning the Company. The Company, nor any of their respective directors makes anyrepresentation or warranty (express or implied) regarding, or assumes any responsibility or liability for, the accuracy orcompleteness of, or any errors or omissions in, any information or opinions contained herein. None of the Company or anyof their respective directors, officers, employees, stockholders or affiliates nor any other person accepts any liability (innegligence, or otherwise) whatsoever for any loss howsoever arising from any use of this presentation or its contents orotherwise arising in connection therewith. No reliance may be placed for any purposes whatsoever on the information setforth in this presentation or on its completeness.This presentation does not constitute or form part of any offer or invitation for sale or subscription of or solicitation orinvitation of any offer to buy or subscribe for any securities, nor shall it or any part of it form the basis of or be relied on inconnection with any contract or commitment whatsoever. Recipients of this presentation are not to construe the contents ofthis presentation as legal, tax or investment advice and should consult their own advisers in this regard.This presentation contains statements that constitute forward-looking statements which involve risks and uncertainties.These statements include descriptions regarding the intent, belief or current expectations of the Company or its officers withrespect to the consolidated results of operations and financial condition, and future events and plans of the Company. Thesestatements can be recognized by the use of words such as "expects," "plans," "will," "estimates," "projects," or words ofsimilar meaning. Such forward-looking statements are not guarantees of future performance and actual results may differsignificantly from those in the forward-looking statements as a result of various factors and assumptions. You are cautionednot to place undue reliance on these forward looking statements, which are based on the current view of the management ofthe Company on future events. The Company does not undertake to revise forward-looking statements to reflect futureevents or circumstances.2
Solid first quarter 2015 financial resultsDisciplined capacity management: International ASMs grew 31% in 1Q YoY, whiledomestic ASMs grew 4% for same period as a continuous domestic capacity discipline.Total ASMs grew 11% during the quarter.Total operating revenues: Increase 36% for the 1Q YoY, reaching Ps. 3,768 million.TRASM increased to Ps. 123.8 cents ( 22% YoY).Costumer acceptance for our ancillary revenue strategy: Non-ticket revenue excl.cargo per pax reached Ps. 319 (US. 21(1)), an increase of 53% for the quarter YoY;driven by improved ancillary bundles, revenue management for bag and seats fees andnew products.Costs control & strong profitability: Maintaining lowest unit cost in the Americas, CASMof US 7.5 cents, decreased 16% YoY (CASM excl. fuel US 5.2 cents); EBITDAR marginfor the period 32% ( 26.1 pp, YoY).Positive cash flow generation, well funded for growth: Net increase of cash byPs. 862 million, mainly driven by operating activities. Unrestricted cash of Ps. 3,156 million(US 208 (1) million), 21% of LTM revenues.Notes:(1) Converted to USD at March end of period spot exchange rate corresponding for the period, 15.1532.3
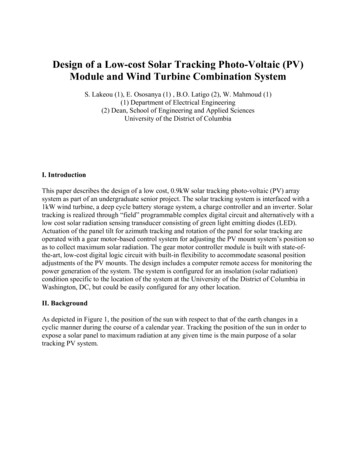
Volaris – Mexico’s Ultra-Low-Cost Carrier’s snapshot at30,000 feetServing to 60 destinations throughout Mexico, US. Recently announced Guatemala and Costa Rica20082014CAGRUnit cost(CASM ex-fuel;cents, USD)(1)5.55.4-0.4%Passengerdemand(RPMs, bn)3.29.7 20.5%Aircraft(End of Period)2150 15.6%Passengers(mm)(2)3.59.8 18.7%Operatingrevenue(mm, USD)(1)397Adj. EBITDAR(mm. USD)(1)67232 23.0%Adj. ROIC (pretax)11%14% 3 pp.Volaris’ destinationsLTM Int. PaxRevenue 28%1,056 17.7%Notes:(1) Converted to USD at an average annual exchange rate(2) Corresponds to the number of booked passengers(3) Based on number of passengers, domestic and international passengersSource: Company data, SCT-DGACLTM Dom. PaxRevenue 72%Domestic market share(3)20.5%23.1%23.3%23.8%201220132014Mar YTD201512.2%20084
Volaris’ low base fares stimulate demand and drivecontinuing growthSince its launch, Volaris has stimulated new demand in the Mexican market through an aggressiverevenue management strategy that drives lower fares and higher load factorsLower basefaresLower costStimulationofdemandResilient ULCC businessmodel driving high,profitable growthMoreancillaryrevenueMore capacity5
Volaris’ ULCC business model is clearly differentiated fromlegacies, hybrids and other LCC’sAeromexicoInterjetVivaAerobusVolaris 13.212.59.9(3)8.4 144885778Non-ticket rev. exc. Cargo 1Q 2015 Non-ticket rev. exc. Cargo per pax (USD)(1)9.26.623.121.3Modern & uniform fleet Average age fleet (years)8.06.4(2)19.7(3)4.5High daily utilization Block hours per day11.4(2)8.8(2)8.4(3)11.8Other/ eg. (No GDS) CASM LTM March 2015(cents, USD)(1)Low ticket prices 1Q 2015Average Fare (USD)(1)Legacy Hybrid/LCC ULCCNotes;(1) Converted to USD at an average exchange rate corresponding for the period(2) Figures updated as per latest public reports as of December 2014(3) Figures updated as per latest public reports as of September 2014Source: Company data, data airlines public information, DGAC reports, MI DIIO6
Volaris has a best-in-class unit cost structureLowest unit cost in the Americas(1)CASM and CASM ex-fuel (LTM March 2015, USD etGolLatin American CarriersCopa6.75.6VivaAerobus(4)SouthWest Allegiant5.8SpiritUS LCCsDenotes fuelcost per ASMNotes:(1) Based on CASM among the publicly-traded airlines(2) DCOMPS Direct Competitors: Average CASM and CASM ex-fuel; US network carriers include: Delta, United, Alaska Airlines, American Airlines(3) Non-USD data converted to USD at an average exchange rate corresponding for the period(4) Based on CASM among the publicly-traded airlines as of FY 2014. VivaAerobus as per latest public report as of September 2014.Source: Company data, Airlines public informationDCOMPSUS NetworkCarriers(2)7
Focus on fleet utilization and efficiency drives higher revenueand lower cost: A320 retrofit and A321 arrival(1)High density configuration(5)Volaris A320179 seats per aircraftLoad factor(1Q 2015)Implied passengersper aircraft(2)80%143Aeromexico 737-800160 seats per aircraftInterjet A320150 seats per aircraftAeromexico77%124VivaAerobus 737-300148 seats per aircraftInterjet70%104VivaAerobus81%12011.8High daily utilizationYoung, fuel efficient fleetBlock hours per day (1Q 2015)(4)Average age (Yrs, 1Q obusMexicanAverageAeromexico4.5InterjetNotes:(1) A320 retrofit and factory fit to 179 seats/A321 arrival with 220 seats(2) Implied passengers per aircraft is calculated as available seats per aircraft multiplied by the load factor. VivaAerobus figures as of FY 2014(3) Block hours per day figures updated as per DGAC latest reports.(4) Block hours per day calculated as ((Total block hours for the period / Monthly average number of aircraft) / Number of days for the period)(5) Aeromexico, Interjet and VivaAerobus represent domestic competitors of VolarisSource: Company data, airlines public information, DGAC, Airbus, miDiio8
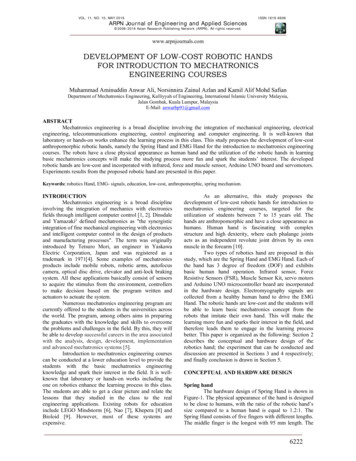
Bus passenger shift to air travelSignificant upside for air travelTotal bus trips(mm)Air travel time and cost savingsTotal air travel trips(mm)Mexico City – TijuanaTravel time (Hrs)2,78114540.536.5 hours less2,706Fare (USD)(2,3)24% cost savings110604.03075302013First, economyand otherExecutive &luxury2013InternationalDomesticBus(1)AirBus (1) Mexico is almost three times the size of the state of Texas The distance between Tijuana and Cancún is similar to thedistance between New York City and San Francisco 4Q14 bus switching campaign resulted in a great success:Notes:(1) Executive and luxury class(2) Fare figures calculated with average prices for September 2014(3) Non-USD data converted to USD at an average exchange rate corresponding for the periodSource: Company data, Secretaría de Comunicaciones y Transportes (SCT)- Education an trial plans went viral- Reached 20M impacts in social media and becametrending topic in Twitter: 8.4M impacts9
Unbundled strategy: “Tú decides” – You decidePre-flight(1) V-Club subscription(113k active)suscriptions) Co-branded creditcards (106k activecardholders) Manage mybooking VempresaFlightplanningAt theairport Seatassignment Excessbaggage Change /booking fees Checkedbag limitedto 1 piece(25kgs.) Insurance Packages Additional formsof payment Advertising Food andbeveragePost-flight Hotelrooms Car rentals Airportshuttle Carry-on(oversized) Strollers TravelCommerce Priorityboarding IOS mobile app Check-inNotes:(1) V-Club & Co-branded credit cards figures as of January 31 th,2015Onboardaircraft10
Acceleration of Volaris’ non-ticket revenuesIncreased contribution of non-ticket revenue to the top lineNon-ticket revenue(USD mm)(1)2009 – 2014 CAGR: 53.2%206223148115682439200920102011201220132014LTM Mar 20157%7%9%13%14%19%20%Contributionto OperatingRevenueNon-ticket revenue per passengerBest-in class US LCC’s(1Q 2015, USD)Volaris (USD)(1)5755AllegiantSpirit2009 – 2014 CAGR: 24.5%792009201011201115172012201321222014LTM Mar 2015Notes:(1) Converted to USD at an annual average exchange rate corresponding for the periodSource: Company data, Airlines public information11
Attractive growth opportunities in Mexico and throughoutthe Americas50Domestic – growth potential of nearly 126routes (4)International – growth potential of about 139routes (4)Number of routes(1)Number of routes(2)4848991004140403875304850203213251000USA (Leisure)Routes servedCapacity – ASMs(Year-over-year change)Total(3)USA (VFR)CAM, SAM,Canada, Growth potentialFY149%1Q1511%2Q15E12%-13%FY15E10% - 12%Domestic6%4%5%-6%2% - 4%International17%31%33%-34%33% - 36%Notes:(1) Minimum stage length of 170 miles(2) Minimum stage length of 200 miles; CAM stands for Central America; SAM stands for South America(3) South and northbound leisure routes(4) Figures calculated as of March 2015.Source: Company data and DIIO MI Market Intelligence for the Aviation Industry12
Substantial growth opportunity in the US-Mexico VFR /leisure travel mmSacramento0.3mmFresno0.5mmLas Vegas0.4mmSan Jose0.4mmAlbuquerque0.2mmPhoenix1.2mmLos .7mmChicago1.5mmDenver0.5mmAustin0.4mmEl Paso0.6mmWashington0.1mmDallas1.5mmSan Antonio0.9mmNew Mission0.6mmDenotes Volarispresence(1)Denotes other cities with largeMexican origin populations(1,2)Notes:(1) Represents Mexican origin population figures as per population data released on May 26, 2011(2) Mexican origin is based on self-described ancestry, lineage, heritage, nationality group or country of birth.Source: Pew Research Hispanic CenterOrlando0.1mmTampa0.1mmMiami0.1mmSan Benito0.3mmSignificant Mexican originpopulation(2) of 33.7 millionin the US13
Positive expansion, managing capacity and diversification ofroutesVolaris offers more domestic routes than any other Mexican carrierVolaris flown domestic routesVolaris flown international routesMore than 2x7839Dec' 11More than 2x939350Dec' 1217Dec' 13Dec' 14Mar' 15Dec' 112326Dec' 12Dec' 134336Dec' 14Mar' 15A significant portion of our capacity faces no competition(1)Percentage of Volaris’ 2Q15 domestic capacity competing with:65%66%32%18%AeromexicoNotes:(1) Capacity measured by ASM’sSource: Data company, SCT-DGAC, DIIO MIInterjetVivaAerobusNon-competed14
Fleet and financials15
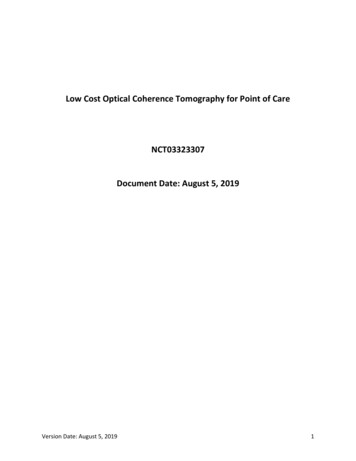
A higher density fleet generates more incremental capacitywith fewer additional aircraftProjected fleet under current contracts (number of 319258FY15A320 w/SharkletsA320 NEO w/Sharklets13129FY16FY17A321 w/SharkletsA321 NEO w/SharkletsSeat growth11%13%8%% fleet w/Sharklets(3)40%58%66%Backlog of 62 Aircraft to support growth(2)Notes:(1) Net fleet after additions and returns(2) Figure calculated as of April 2015(3) Percentage of year-end fleet with sharkletsSource: Company data16
Solid financial performanceOperating 011201220132014Operating Revenues CAGR 2009 - 201420132014140100201020112012LTMMar '15LTM March 2015 Adj. EBITDAR margin30%30%1162009LTMMar 6(USD mm)(USD mm)1,000Adj. %7%6%GolLatAm0%10%0%CopaAeromexicoNote:(1) Converted to USD at an average exchange rate corresponding for the periodSource: Company data, airlines public informationCopaAeromexico17
Solid balance sheet and liquidity, well funded for growth IPO provided sufficient liquidity / capitalLTM Liquidity – Cash and Equivalents / Op.Revenuefor growth over the next years Fully financed pre-delivery payments andexecuted sale-leasebacks for all22.8%21.0%19.8%deliveries in 2015 and 2016 A good liquidity position to strengthen our14.4%balance sheet Unrestricted cash of 3.2 billion pesos(US 208 million(2))as of March8.9%31st2015 Negative net debt of 1.9 billion pesos(US 125 million (2)) as of March 31st2015.CopaGol(1)LatAmAeromexicoNote:(1) Includes IPO Smiles program proceeds(2) Figures converted to USD December end of the period spot exchange rate 15.1542 for convenience purposes onlySource: Company data, Airlines public information18
Active in jet fuel hedging, reaching up to 45% of projectedconsumption for 2015 and 2016PeriodTotal % hedgedAvg. price (gal/USD )Instrument1Q1529% 2.53Swap/Call2Q1545% 2.15Swap/Call3Q-4Q1545% 2.07Call1Q1645% 1.95Call2Q1645% 1.97Call3Q16-4Q1640% 2.00Call19
Appendix20
Non-IFRS Terms Glossary Available seat miles (ASMs): Number of seats available for passengers multiplied by the number of miles the seats are flown. Block hours: Number of hours during which the aircraft is in revenue service, measured from the time it leaves the gate until thetime it arrives to the gate at destination. Revenue passenger miles (RPMs): Means the number of miles flown by passengers. TRASM: Total revenue divided by ASMs. RASM: Passenger revenue divided by ASMs. CASM: Total operating expenses, net divided by ASMs. CASM ex fuel: Total operating expenses, net excluding fuel expense divided by ASMs. Load factor: RPMs divided by ASMs and expressed as a percentage. EBITDA: Earnings before interest, taxes, depreciation and amortization. EBITDAR: Earnings before interest, taxes, depreciation, amortization and aircraft rent expense. Adj. EBITDAR: EBITDAR adjusted by non-cash and non-recurring items. Adj. Debt: Financial debt plus seven times the aircraft rent expense. Adj. Net debt: Adj. Debt minus cash and cash equivalents. VFR: Passengers who are visiting friends and relatives.21
Consolidated statements of operations summaryMXN millions unless otherwise stated ,0372014A (1)(USDmillions)768186954Fuel4,730Aircraft and engines rent expense1,886Salaries and benefits1,303Landing, take off and navigation expenses1,640Sales, marketing and distribution expenses752Maintenance expenses499Other operating expense288Depreciation and amortization211Total operating erNon-ticketTotal operating revenues2012A2013A2014A1Q 2015A2,9228463,7681Q 2015 (1)(USDmillions)19356249% of totaloperatingrevenues77.522.51006EBITOperating margin (%)3783.23172.42041.5141.53469.2239.29.2Finance incomeFinance costExchange (loss) gain, netIncome tax 30(3)9(4)86(131)1(0)6(9)0.2(0.1)2.3(3.5)Net incomeNet margin (%)Net income excluding special 8.1208.1Adjusted EBITDARAdj. EBITDAR margin .032.0EPS Basic and Diluted0.290.310.600.040.300.02EPADS Basic and Diluted2.943.105.980.413.030.20(3)8.1Notes:(1) Full year 2014 and 1Q 2015 figures converted to USD December end of the period spot exchange rate 14.7180 and 15.1532, respectively, for convenience purposes only(2) Audited financial information 2012A – 2013A(3) Excludes debt prepayment of Ps.65 million, and reservation system migration costs and other non-recurring items of Ps.48 million.Source: Company data22
Consolidated statements of financial position summaryMXN millions unless otherwise stated (5)2012A2013A2014ACash and cash equivalentsCurrent guarantee depositsOther current assetsTotal current assetsRotable spare parts, furniture andequipment, netNon-current guarantee depositsOther non-current assetsTotal assetsUnearned transportation revenueShort-term financial debtOther short-term liabilitiesTotal short-term liabilitiesLong-term financial debtOther long-term liabilitiesTotal liabilities8222387551,8152,4514991,0504,0001,1951Q 20152,2655458793,6892014A (1)(USDmillions)15437602513,1565827274,4651Q 2015A 29561873732715414Total equity1,0753,9624,4703044,806317Total liabilities and (69)(1,900)(125)Adjusted debt (3)14,36015,87418,9901,29020,1351,329Adjusted net debt (4)13,53813,42316,7251,13616,9791,120Net debt (2)Notes:(1) Full year 2014 and 1Q 2015 figures converted to USD December end of the period spot exchange rate 14.7180 and 15.1532, respectively, for convenience purposes only(2) Net debt financial debt - cash and cash equivalents(3) Adjusted debt (LTM aircraft rent expense x 7) financial debt(4) Adjusted net debt adjusted debt - cash and cash equivalents(5) Audited financial information 2012A – 2013ASource: Company data23
Consolidated statements of cash flows summaryMXN millions unless otherwise stated (2)Cash flow from operating activitiesIncome before income taxDepreciation and amortizationGuarantee depositsUnearned transportation revenueChanges in working capital and provisionsNet cash flows provided by operating activitiesCash flow from investing activitiesAcquisitions of rotable spare parts, furniture, equipment andintangible assetsProceeds from disposals of rotable spare parts, furniture andequipmentNet cash flows provided by (used in) investing activitiesCash flow from financing activitiesPayments of Treasury SharesNet proceeds from initial public offeringTransaction costs on issue of sharesProceeds from exercised treasury sharesInterest paidOther financing costsPayments of financial debtProceeds from financial debtNet cash flows (used in) provided by financing activitiesIncrease (decrease) in cash and cash equivalentsNet foreign exchange differencesCash and cash equivalents at beginning of periodCash and cas
Significant upside for air travel Air travel time and cost savings Travel time(Hrs) Fare(USD)(2,3) Mexico City –Tijuana (1) Total air travel trips (mm) Total bus trips (mm) 40.5 4.0 Bus Air 36.5 hours less Mexico is almost three times the size of the state of Texas