Transcription
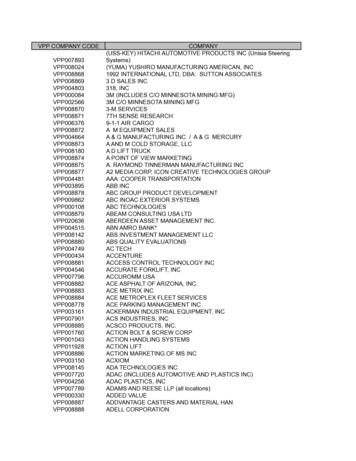
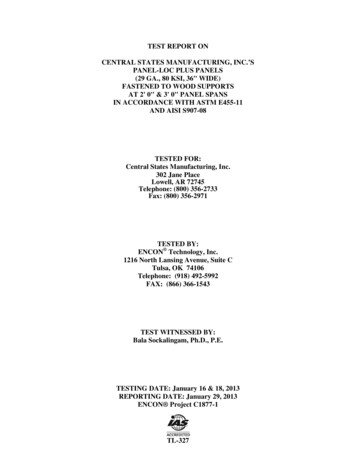
9/25/2020DNBiPrinted By:Kristy BoehmeDate Printed:September 25, 2020LIVE REPORTGORMAN MANUFACTURINGCOMPANY, INC.Tradestyle(s): ACTIVEHEADQUARTERSD-U-N-S Number:Company:80-473-5132GORMAN MANUFACTURING COMPAN D&B492 Koller St, SanAdded toAddress:Francisco, CA,Portfolio:94110, UnitedEndorsement:testStates Of AmericaLast ype:Phone: 1 650-555-0000SummaryKEY DATA ELEMENTS (Formerly: SCORE BAR)KDE NamePAYDEX Commercial Credit ScorePercentileCurrent Status Details68Paying 17 days past due13Moderate to High Risk ofsevere paymentdelinquency.Financial Stress ScoreNational Percentile 44Moderate Risk of severefinancial stress.D&B Viability Rating1Bankruptcy FoundND&B Rating3A43AAView More Details3A indicates 1 to 10million, Creditappraisal of 4 islimitedCOMPANY PROFILE D-U-N-SMailing AddressAnnual Sales80-473-5132UNITED STATES report/804735132/printPdf1/23
9/25/2020DNBiLegal FormTelephoneNet WorthCorporation (US) 1 650-555-0000 4,110,181History RecordPresent Control SucceededEmployeesClear1985153 (120 here)Date IncorporatedAge (Year Started)01/03/197735 Years (1985)State of IncorporationNamed PrincipalCALIFORNIALeslie Smith , PRESOwnershipLine of BusinessNot publicly tradedLithographic commercial printingStreet Address:492 Koller St,San Francisco, CA, 94110,United States Of AmericaOVERALL BUSINESS RISK Dun & Bradstreet rall assessment of this organization over the next 12 months:Some-Payment-Behavior-ConcernsBased on the predicted risk of business Based on the predicted risk of severely delinquent payments:Heightened Potential For Severely DelinquentPaymentsD&B MAX CREDIT RECOMMENDATION MAXIMUM CREDIT RECOMMENDATIONUS 90,000The recommended limit is based on a moderate to high risk of business failure.FAILURE SCORE (Formerly Financial Stress Score) Company's Risk LevelProbability of failure over the next 12 months0.27 4735132/printPdf2/23
9/25/2020DNBiMODERATE44High Risk (1)Low Risk (100)Past 12 MonthsLow RiskHigh RiskDELINQUENCY SCORE (Formerly Commercial Credit Score) Company's Risk LevelProbability of delinquency over the next 12 months10.69 %MODERATE-HIGH13High Risk (1)Low Risk (100)Past 12 MonthsLow RiskHigh RiskVIABILITY RATING SUMMARY Viability Score1High Risk (9)Low Risk (1)Data Depth IndicatorADescriptive (G)Predictive (A)Portfolio Comparison3High Risk (9)Low Risk (1)Financial DataAvailableTrade PaymentsAvailable: 3 TradeCompany SizeLargeYears in BusinessEstablishedD&B PAYDEX - 3 MONTHS 735132/printPdf3/23
9/25/2020DNBi68High Risk (1)Low Risk (100)Days Beyond Terms: 17D&B PAYDEX 68High Risk (1)Low Risk (100)Days Beyond Terms: 17Past 24 MonthsLow RiskHigh RiskPAYDEX TREND CHART This CompanyIndustry BenchmarkSBRI ORIGINATION No SBRI Origination Score data is currently available.D&B SBFE SCORE No D&B SBFE Score data is currently report/804735132/printPdf4/23
9/25/2020DNBiFRAUD RISK SCORE INFORMATION No Fraud Risk Score is AvailableDETAILED TRADE RISK INSIGHT Days Beyond Terms3 Months5 DaysFrom Jul-20 to Sep-205High Risk (120 )Low Risk (0)Days Beyond Terms Past 3 months : 5Low Risk:0 ; High Risk:120 Dollar-weighted average of 35 payment experiences reported from 3 companies.DETAILED TRADE RISK INSIGHT 13 MONTH TRENDTotal Amount Current and Past Due -D&B RATING Financial StrengthRisk Indicator3A : US 1,000,000 to US 9,999,999 in Net Worth or Equity4 : Higher than Average RiskCurrent Rating as of 11/22/2013FINANCIAL OVERVIEW - PROFIT AND LOSSPro t & Loss [1]Net IncomeSalesAmount [2]Last 3 YearsUS 3,189,738-US 32,698,577-1. Fiscal 2019-12-312. (In Single Units)Source: D&BFINANCIAL OVERVIEW - BALANCE t/804735132/printPdf5/23
9/25/2020DNBiBalance Sheet [1]Amount [2]Last 3 YearsTotal Current AssetsUS 17,159,208-Total Current LiabilitiesUS 10,793,087-other-assetUS 2,307,502-Long Term LiabilitiesUS 4,563,442-Net WorthUS 4,110,181-1. Fiscal 2019-12-312. (In Single Units)Source: D&BFINANCIAL OVERVIEW - KEY BUSINESS RATIOSKey Business RatiosBusiness RatioCurrent Ratio1.59Source: D&BOWNERSHIPSubsidiariesBranchesTotal Members115This company is a Global Ultimate, Domestic Ultimate, Headquarters, Parent.Global UltimateDomestic UltimateNameGORMAN MANUFACTURING COMPANY, INC.GORMAN MANUFACTURING COMPANY, INC.CountryUNITED STATESUNITED STATESD-U-N-S80-473-513280-473-5132Others--LEGAL EVENTSEventsOccurrencesLast ae-report/804735132/printPdf6/23
9/25/2020DNBiEventsOccurrencesUCC2Last Filed01/01/2014TRADE PAYMENTSHighest Past Due:US 5,000Total Trade Experiences19Highest NowOwingUS 15,000Largest HighCreditUS 25,000PEOPLECurrent Principals0New Appointments0ResignationsClosures00ALERTS There are no alerts for this D-U-N-S Number.STOCK PERFORMANCEHistoryPerformanceDaily HighP/E52-Week HighEPSDiv/YieldWEB & SOCIALPOWERED BY eport/804735132/printPdf7/23
9/25/2020DNBi No Data AvailableLATEST NOTES No notes is available for this D-U-N-S Number.COUNTRY/REGIONAL INSIGHTUnited States Of AmericaRisk CategoryDun & Bradstreet downgrades the US’s country risk rating as theimpact of the coronavirus pandemic spreads.LOWHigh RiskLow RiskAvailable ReportsCountry Insight Snapshot (CIS)High-level view of a single country’s cross-border risk exposure, withparticular focus on the current political, commercial, and macroeconomicenvironments.Country Insight Report (CIR)In-depth analysis of the current risks and opportunities within a singlecountry and its regional and global context.The scores and ratings included in this report are designed as a tool to assist the user in making their own credit relateddecisions, and should be used as part of a balanced and complete assessment relying on the knowledge and expertise of thereader, and where appropriate on other information sources. The score and rating models are developed using statisticalanalysis in order to generate a prediction of future events. Dun & Bradstreet monitors the performance of thousands ofbusinesses in order to identify characteristics common to speci c business events. These characteristics are weighted bysigni cance to form rules within its models that identify other businesses with similar characteristics in order to provide ascore or rating.Dun & Bradstreet's scores and ratings are not a statement of what will happen, but an indication of what is more likely tohappen based on previous experience. Though Dun & Bradstreet uses extensive procedures to maintain the quality of itsinformation, Dun & Bradstreet cannot guarantee that it is accurate, complete or timely, and this may a ect the includedscores and ratings. Your use of this report is subject to applicable law, and to the terms of your agreement with Dun &Bradstreet.Risk AssessmentD&B RISK ASSESSMENTOVERALL BUSINESS /804735132/printPdfMAXIMUM CREDIT RECOMMENDATION8/23
WUS 90,000Dun & Bradstreet thinks.Overall assessment of this organization over the next 12 months: SOME-The recommended limit is based on aPAYMENT-BEHAVIOR-CONCERNSmoderately high probability of severeBased on the predicted risk of business discontinuation: LIKELIHOOD-OF-delinquency or business failure.CONTINUED-OPERATIONSBased on the predicted risk of severely delinquent payments: HEIGHTENEDPOTENTIAL FOR SEVERELY DELINQUENT PAYMENTSD&B VIABILITY RATING SUMMARYThe D&B Viability Rating uses D&B's proprietary analytics to compare the most predictive businessrisk indicators and deliver a highly reliable assessment of the probability that a company will goout of business, become dormant/inactive, or le for bankruptcy/insolvency within the next 12months. The D&B Viability Rating is made up of 4 components:Viability ScorePortfolio ComparisonCompared to All US Businesses within theCompared to All US Businesses within theD&B Database:same MODEL SEGMENT:Level of Risk:Low RiskModel Segment :Available Financial DataBusinesses ranked 1 have a probability ofLevel of Risk:Low Riskbecoming no longer viable: 0.2 %Businesses ranked 3 within this modelPercentage of businesses ranked 1: 0.3 %segment have a probability of becomingAcross all US businesses, the averageno longer viable: 0.2 %probability of becoming no longerPercentage of businesses ranked 3 withviable:14 %this model segment: 15 %Within this model segment, the averageprobability of becoming no longerviable:0.6 %Data Depth IndicatorCompany Pro le:Data Depth Indicator:Company Pro le Details:Rich FirmographicsFinancial Data: TrueExtensive Commercial Trading ActivityTrade Payments: Available: 3 TradeComprehensive Financial AttributesCompany Size: Large: Employees:50 orSales: 500K Greater data depth can increase the precision ofYears in Business: Established: 5 the D&B Viability Rating assessment.To help improve the current data depth of thiscompany, you can ask D&B to make a personalizedrequest to this company on your behalf to obtainits latest nancial information. To make therequest, click the link below. Note, the companymust be saved to a folder before the request canAFinancialTradeCompanyYears lished3 Tradebe t/804735132/printPdf9/23
9/25/2020DNBiRequest Financial StatementsReference the FINANCIALS tab for this company tomonitor the status of your request.FAILURE SCORE FORMERLY FINANCIAL STRESS SCOREComposite credit appraisal is rated limited44High Risk (1)High proportion of past due balances to total amountLow Risk (100)owingLow proportion of satisfactory payment experiences tototal payment experiencesHigh proportion of slow payment experiences to totalnumber of payment experiencesUCC Filings reportedLevel of RiskRaw ScoreProbability of FailureAverage Probability of FailureModerate14700.27 %for Businesses in D&BDatabase0.48 %Business and Industry TrendsFAILURE SCOREIndustry Median QuartileBUSINESS AND INDUSTRY COMPARISONSelected Segments of Business AttributesNormsNational %This 52Employee range:(100-499)75Years in Business:(26 )77DELINQUENCY SCOREFORMERLY COMMERCIAL CREDIT SCORE13High Risk (1)Low Risk (100)Proportion of slow payments in recent monthsProportion of past due balances to total amount owingHigher risk industry based on delinquency rates for this industryEvidence of open suits and judgmentsLevel of RiskRaw ScoreProbability of DelinquencyCompared to Businesses inModerate-High46310.69 %D&B Database10.2 %Business and Industry rt/804735132/printPdf10/23
9/25/2020DNBiDELINQUENCY SCOREIndustry Median QuartileBUSINESS AND INDUSTRY COMPARISONSelected Segments of Business AttributesNormsNational %This 62Employee range:(100-499)89Years in Business:(26 )85D&B PAYDEX3 MONTHS - D&B PAYDEX68High Risk (1)68Low Risk (100)High Risk (1)Low Risk (100)When weighted by amount, Payments to suppliersBased on payments collected over last 3 months.average 17 Days Beyond TermsWhen weighted by amount, Payments to suppliersaverage 17 days beyond terms High risk of late payment (Average 30 to 120 days High risk of late payment (Average 30 to 120 daysbeyond terms) Medium risk of late payment (Average 30 days orbeyond terms) Medium risk of late payment (Average 30 days orless beyond terms) Low risk of late payment (Average prompt to 30 less beyond terms) Low risk of late payment (Average prompt to 30 days sooner)days sooner)Business and Industry Trends2752 - Lithographic commercial printingPAYDEXIndustry Lower QuartileIndustry Median QuartileIndustry Upper QuartileD&B RATINGCurrent Rating as of 11/22/2013Financial StrengthRisk Indicator3A : US 1,000,000 to US 4 : Higher than Average9,999,999 in Net Worth orRiskEquityTrade PaymentsTRADE PAYMENTS SUMMARY (Based on 24 months of t/804735132/printPdf11/23
9/25/2020DNBiOverall Payment Behaviour% of Trade Within TermsHighest Past DueHighest Now Owing:Total Trade Experiences:Total Unfavorable Comments :US 15,000190Largest High Credit:US 25,000Largest High Credit:US 0Average High Credit:US 10,277Total Placed in Collections:1778%Days Beyond TermsUS 5,0000Largest High Credit:US 0D&B PAYDEX3 MONTHS - D&B PAYDEX68High Risk (1)68Low Risk (100)High Risk (1)Low Risk (100)When weighted by amount, Payments to suppliers averageBased on payments collected over last 3 months.17 Days Beyond TermsWhen weighted by amount, Payments to suppliers average17 days beyond terms High risk of late payment (Average 30 to 120 days High risk of late payment (Average 30 to 120 daysbeyond terms) Medium risk of late payment (Average 30 days or lessbeyond terms) Medium risk of late payment (Average 30 days or lessbeyond terms) Low risk of late payment (Average prompt to 30 daysbeyond terms) Low risk of late payment (Average prompt to 30 dayssooner)sooner)BUSINESS AND INDUSTRY TRENDSBased on 24 months of data2752 - Lithographic commercial printingPAYDEXIndustry Lower QuartileIndustry Median QuartileIndustry Upper QuartileTRADE PAYMENTS BY CREDIT EXTENDED (Based on 12 months of data)Range of CreditExtended (US )Number of PaymentExperiencesTotalValue% Within Terms100,000 & over0US 0050,000 - 99,9990US 0015,000 - 49,99955,000 - 14,999131,000 - 4,9990US 00Less than 1,0000US 04735132/printPdfUS 85,000US 100,000509012/23
9/25/2020DNBiTRADE PAYMENTS BY INDUSTRY (BASED ON 24 MONTHS OF DATA)Collapse All Expand AllIndustry Category Number of Payment ExperiencesLargest High Credit (US )% Within Terms (Expand to View)1 - 30 Days Late (%)31 - 60 Days Late (%)61 - 90 Days Late (%)91 Days Late (%) 55 - Automotive Dealers and Gasoline Service Stations515,0005599 - Ret misc vehicles515,00075100150 65 - Real Estate515,0006531 - Real estate agent/mgr515,00073011160 75 - Automotive Repair, Services and Parking515,0007532 - Car body repair/paint515,00072014140 99 - Nonclassi able Establishments325,0009999 - Nonclassi ed325,0006436000TRADE LINESHighCredit(US )Now Owes(US )Past Due(US )5000-10,0002,50001Pays Promptly-10,00010,0002,500106/20Pays Promptly-10,00010,0002,500106/20Pays Promptly-7,5001,0000106/20Pays Promptly-7,5005,0000106/20Pays Promptly-7,5005,0000106/20Pays Promptly-7,5005,00001Date ofExperiencePaymentStatus07/20-06/20Pays tMonths SinceLast SaleBetween 6 and 12Months13/23
9/25/2020DNBiHighCredit(US )Now Owes(US )Past Due(US )Months SinceLast 1-15,0005,0005,0001-15,00015,0005,0001Date ofExperiencePaymentStatusSellingTerms06/20Pays Promptly06/20Pays Promptly06/2006/2006/2006/2006/2006/20Pays Prompt toSlow 30 Pays Prompt toSlow 60 Pays Prompt toSlow 60 Pays Prompt toSlow 90 Pays Prompt toSlow 90 Pays Prompt toSlow 90 09/19Pays Promptly-5,0001,0000-09/19Pays Promptly-5,0001,0000--25,00015,0005,000-01/19Pays Prompt toSlow 30 Corporate LinkageIncrease your understanding of the links and risks between your customers and suppliers withD&B's Interactive Global Family TreeDOMESTIC ULTIMATECompanyCity , StateD-U-N-S NUMBERGORMAN MANUFACTURINGSAN FRANCISCO , California80-473-5132CompanyCity , Country or RegionD-U-N-S NUMBERKENTMORE CLOTHINGMELBOURNE , AUSTRALIA75-468-3795COMPANY, INC.SUBSIDIARIES (INTERNATIONAL)(MANUFACTURING) PTY LTDBRANCHES report/804735132/printPdf14/23
9/25/2020DNBiCompanyCity , StateD-U-N-S NUMBERGORMAN MANUFACTURINGSAN FRANCISCO , California11-760-5252COMPANY, INC.This information may not be reproduced in whole or in part by any means of reproduction.Legal EventsThe following Public Filing data is for information purposes only and is not the o cial record.Certi ed copies can only be obtained from the o cial source.BankruptciesJudgementsLiensSuitsNo101Latest Filing: 01/01/2014Latest Filing: -Latest Filing: 02/01/2014UCCs2Latest Filing: 01/01/2014EVENTSJudgement - Court JudgementFiling Date01/01/2014Filing Number123456StatusUnsatis edDate Status Attained01/01/2014Received Date04/07/2014AwardUS 700DebtorsGORMAN MANUFACTURING COMPANY INC - TEST CASECreditorsABC MANUFACTURING - TEST CASECourtLos Angeles, County Of, Norwalk, CASuitFiling /804735132/printPdf02/01/201415/23
9/25/2020DNBiFiling Number99999StatusPendingDate Status Attained02/01/2014Received Date04/07/2014AmountUS 750PlaintiffsTEST CASEDefendantGORMAN MANUFACTURING INC - TEST CASECourtSupreme Court Of The State Of Tennessee, Knoxville, TNUCC Filing - OriginalFiling Date01/01/2014Filing Number77777Received Date05/03/2014Secured PartyVAL MAGEE - TEST, ALLENTOWN, PADebtorsGORMAN MANUFACTURING COMPANY INC - TEST CASEFiling OfficeSECRETARY OF STATE/UCC DIVISION, HARRISBURG, PAUCC Filing - OriginalFiling Date01/01/2014Filing Number55555Received Date01/03/2014Secured PartyTEST CASE BUSINESS 1DebtorsGORMAN MANUFACTURING COMPANYDebtorsand OTHERSFiling OfficeSECRETARY OF STATE/UCC DIVISION, HARRISBURG, PAThe public record items contained in this report may have been paid, terminated, vacated or released prior to the date thisreport was printed. This information may not be reproduced in whole or in part by any means of reproduction.There are additional UCC's in D&B's le on this company available by contacting 1-800-234-3867.There may be additional suits, liens, or judgments in D&B's le on this company available in the U.S. Public Records Database,also covered under your PPP for D&Bi contract. If you would like more information on this database, please contact theCustomer Resource Center at /vae-report/804735132/printPdf16/23
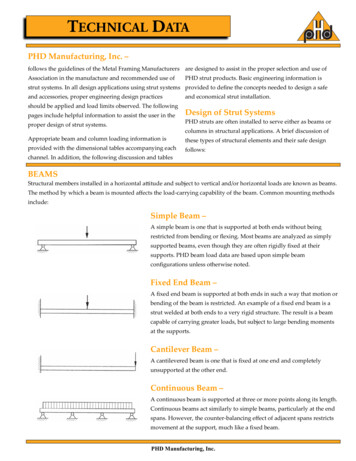
9/25/2020DNBiIf it is indicated that there are defendants other than the report subject, the lawsuit may be an action to clear title to propertyand does not necessarily imply a claim for money against the subject.Special EventsThere are no Special Events recorded for this business.Financials - D&BFinancialsSource: D&B Currency: All gures shown in USD unless otherwise statedFINANCIAL STATEMENT COMPARISON32.7Value (In Millions)26.219.613.1Fiscal ConsolidatedFiscal ConsolidatedFiscal Consolidated2019-12-312018-12-312017-12-31Current Assets17,159,20812,893,37411,264,427Total 81,397,498286,148211Working Capital6,366,1213,724,8951,368,633Other Assets2,307,5022,004,1112,689,091Last 3 yearsLiabilitiesTangible NetWorthSalesNet IncomeCurrent t/804735132/printPdf17/23
9/25/2020DNBiLong Term4,563,4422,210,059559,879Liabilities* In Single UnitsSTATEMENT INFORMATIONPro t And LossFrom JAN 01 2019 to DEC 31 2019 annual sales 32,698,577; cost of goods sold 19,912,578.InformationGross pro t 12,785,999; operating expenses 9,987,431. Operating income 2,798,568; otherincome 895,329; net income before taxes 3,693,897; Federal income tax 504,159. Netincome 3,189,738.Source InformationPrepared from statement(s) by Accountant: Johnson, Jordan & Jones CPAs.Statement ExplanationFixed assets shown net less 500,763 depreciation.Reporter CommentsOn June 16, 2020 the nancial information was updated.FinancialsSource: D&B Currency: All gures shown in USD unless otherwise st
The scores and ratings included in this report are designed as a tool to assist the user in making their own credit related decisions, and should be used as part of a balanced and complete
![Shareholders’ Agreement of [Company name] company. 1 .](/img/1/startup-founders-sha-sample.jpg)