Transcription
Magic Quadrant for Analytics andBusiness Intelligence PlatformsPublished 11 February 2019 - ID G00354763 - 109 min readModern analytics and BI platforms are now mainstream purchases for which keydifferentiators are augmented analytics and support for Mode 1 reporting in a singleplatform. This Magic Quadrant will help data and analytics leaders complement theirexisting solutions or move to an entirely new vendor.Strategic Planning AssumptionsBy 2020, augmented analytics will be a dominant driver of new purchases of analyticsand business intelligence, data science and machine learning platforms, and embeddedanalytics.By 2020, 50% of analytical queries either will be generated via search, natural languageprocessing or voice, or will be automatically generated.By 2020, organizations that offer users access to a curated catalog of internal andexternal data will derive twice as much business value from analytics investments asthose that do not.By 2020, the number of data and analytics experts in business units will grow at threetimes the rate of experts in IT departments, which will force companies to rethink theirorganizational models and skill sets.By 2021, natural language processing and conversational analytics will boost analyticsand business intelligence adoption from 35% of employees to over 50%, including newclasses of users, particularly front-office workers.Market Definition/DescriptionModern analytics and business intelligence (BI) platforms are characterized by easy-touse tools that support the full analytic workflow — from data preparation and ingestionto visual exploration and insight generation. They are most differentiated from traditionalBI platforms by not requiring significant involvement from IT staff to predefine datamodels or store data in traditional data warehouses (see “Technology Insight forModern Analytics and Business Intelligence Platforms”). The emphasis is on selfservice and agility. Most modern analytics and BI platforms also have their own selfcontained in-memory columnar engine to ensure fast performance and support rapidprototyping, but many can optionally use existing modeled data sources. The growinguse of data lakes and logical data warehouses dovetails with the capabilities of modernanalytics and BI platforms that can ingest data from these less-modeled data sources
(see “The Practical Logical Data Warehouse: A Strategic Plan for a Modern DataManagement Solution for Analytics”).The crowded analytics and BI market includes everything from long-standing and largetechnology players to startups backed by venture capital and smaller, privately fundedsoftware vendors. Vendors of traditional BI platforms have evolved their capabilities toinclude modern, visual-based data discovery that also includes governance, and morerecently, augmented analytics. Newer vendors continue to evolve the capabilities thatonce focused primarily on agility, by extending them to enable greater governance andscalability, as well as publishing and sharing. The holy grail is for customers to haveboth Mode 1 and Mode 2 capabilities (see Note 1) in a single, seamless platform thatdraws on existing assets but also has emerging best-of-breed capabilities.As disruptive as visual-based data discovery has been to traditional BI, a third wave ofdisruption has emerged in the form of augmented analytics, with machine learning (ML)generating insights on increasingly vast amounts of data. Augmented analytics alsoincludes natural language processing (NLP) as a way of querying data and ofgenerating narratives to explain drivers and graphics. Vendors that have augmentedanalytics as a differentiator are better able to command premium prices for theirproducts (see “Augmented Analytics Is the Future of Data and Analytics”).This Magic Quadrant focuses on products that meet Gartner’s criteria for a modernanalytics and BI platform (see “Technology Insight for Modern Analytics and BusinessIntelligence Platforms”). It is this type of platform that accounts for the majority of netnew mainstream purchases in the analytics and BI platform market. Products that donot meet our criteria for a modern platform — either because of the upfrontrequirements for IT to predefine data models, or because they are reporting-centric —are covered in our “Market Guide for Traditional Enterprise Reporting Platforms.”This Magic Quadrant refers throughout to composite measures of success based on asurvey of vendors’ reference customers. Reference customers scored vendors on eachof the metrics defined in Note 2 (see also the Evidence section). Opinions from GartnerPeer Insights contributors are also factored into our assessments; these contributorsare referred to as Gartner Peer Insights reviewers.The Five Use Cases and 15 Critical Capabilities of anAnalytics and BI PlatformWe define and assess product capabilities across the following five use cases: Agile, centralized BI provisioning: Supports an agile IT-enabled workflow, from data tocentrally delivered and managed analytic content, using the platform’s self-containeddata management capabilities. Decentralized analytics: Supports a workflow from data to self-service analytics, andincludes analytics for individual business units and users. Governed data discovery: Supports a workflow from data to self-service analytics tosystem of record (SOR), IT-managed content with governance, reusability andpromotability of user-generated content to certified data and analytics content.
OEM or embedded analytics: Supports a workflow from data to embedded BI content ina process or application. Extranet deployment: Supports a workflow similar to agile, centralized BI provisioningfor the external customer or, in the public sector, citizen access to analytic content.We assess vendors on the 15 critical capabilities listed below. (Any changes to theprevious year’s critical capabilities are listed in Note 3. Subcriteria for each capabilityare published in “Toolkit: Analytics and BI Platform RFP.” How well vendors’ platformssupport these critical capabilities is explored in greater detail in “Critical Capabilities forAnalytics and Business Intelligence Platforms.”)Infrastructure1. BI platform administration, security and architecture: Capabilities that enable platformsecurity, administering of users, auditing of platform access and utilization, and highavailability and disaster recovery.2. Cloud BI: Platform-as-a-service and analytic-application-as-a-service capabilities forbuilding, deploying and managing analytics and analytic applications in the cloud,based on data both in the cloud and on-premises.3. Data source connectivity and ingestion: Capabilities that enable users to connect tostructured and unstructured data contained within various types of storage platform(relational and nonrelational), both on-premises and in the cloud.Data Management4.Metadata management: Tools enabling users to leverage a common semanticmodel and metadata. These should provide a robust and centralized way foradministrators to search, capture, store, reuse and publish metadata objects such asdimensions, hierarchies, measures, performance metrics/key performance indicators(KPIs), and to report layout objects, parameters and so on. Administrators should havethe ability to promote a business-user-defined data mashup and metadata to the SORmetadata.5. Data storage and loading options: Platform capabilities for accessing, integrating,transforming and loading data into a self-contained performance engine, with theability to index data, manage data loads and refresh scheduling.6. Data preparation: “Drag and drop” user-driven data combination of different sources,and the creation of analytic models such as user-defined measures, sets, groups andhierarchies. Advanced capabilities include machine learning-enabled semanticautodiscovery, intelligent joins, intelligent profiling, hierarchy generation, data lineageand data blending on varied data sources, including multistructured data.7. Scalability and data model complexity: The degree to which the in-memory engine orin-database architecture handles high volumes of data, complex data models,performance optimization and large user deployments.Analysis and Content Creation8.Advanced analytics for citizen data scientists: Enables users to easily accessadvanced analytics capabilities that are self-contained within the platform, through
menu-driven options or through the import and integration of externally developedmodels.9. Analytic dashboards: The ability to create highly interactive dashboards and contentwith visual exploration and embedded advanced and geospatial analytics forconsumption by others.10. Interactive visual exploration: Enables the exploration of data via an array ofvisualization options that go beyond those of basic pie, bar and line charts to includeheat and tree maps, geographic maps, scatter plots and other special-purposevisuals. These features enable users to analyze and manipulate data by interactingdirectly with a visual representation of it, to display it as percentages, bins andgroups.11. Augmented data discovery: Automatically finds, visualizes and narrates importantfindings such as correlations, exceptions, clusters, links and predictions in data thatare relevant to users without requiring them to build models or write algorithms.Users explore data via visualizations, natural-language-generated narration, searchand natural language query (NLQ) technologies.12. Mobile exploration and authoring: Enables organizations to develop and delivercontent to mobile devices in a publishing and/or interactive mode, and takesadvantage of mobile devices’ native capabilities, such as touchscreen, camera andlocation awareness.Sharing of Findings13. Embedding of analytic content: Capabilities including a software developer kitwith APIs and support for open standards for creating and modifying analytic content,visualizations and applications, embedding them in a business process and/or anapplication or portal. These capabilities can reside outside the application, reusingthe analytic infrastructure, but must be easily and seamlessly accessible from insidethe application without forcing users to switch between systems. The capabilities forintegrating analytics and BI with the application architecture will enable users tochoose where in the business process the analytics should be embedded.14. Publish, share and collaborate on analytic content: Capabilities that enable users topublish, deploy and operationalize analytic content through various output types anddistribution methods, with support for content search, scheduling and alerts. Thesecapabilities enable users to share, discuss and track information, analysis, analyticcontent and decisions via discussion threads, chat and annotations.Overall Platform15. Ease of use, visual appeal and workflow integration: The ease of administeringand deploying the platform, creating content, and consuming and interacting withcontent, as well as the degree to which the product is visually appealing. Thiscapability also considers the degree to which capabilities are offered in a single,seamless product and workflow, or across multiple products with little integration.
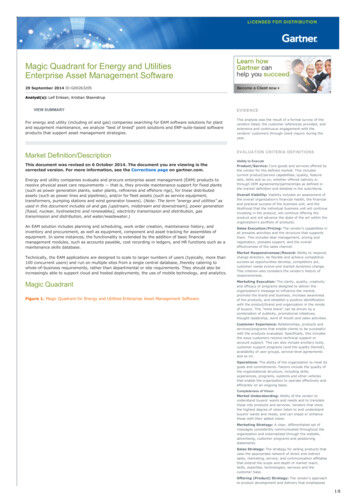
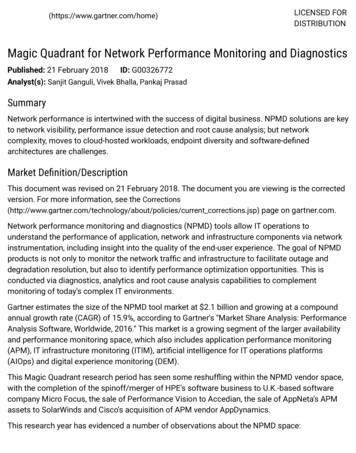
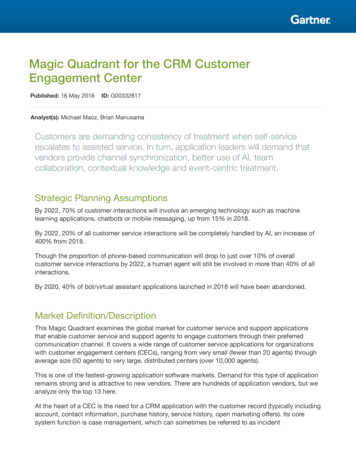
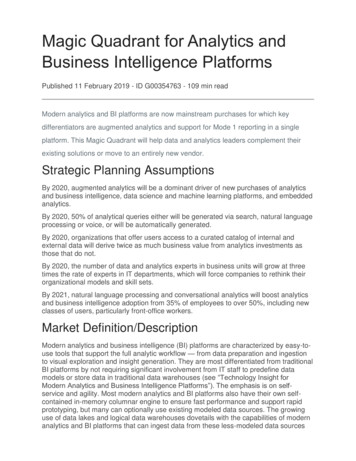
Magic QuadrantFigure 1. Magic Quadrant for Analytics and Business Intelligence PlatformsSource: Gartner (February 2019)
Vendor Strengths and CautionsBirstBirst provides an end-to-end data warehouse, reporting and visualization platform builtfor the cloud. Birst was an early cloud-native vendor, but also offers its product as anon-premises appliance running on commodity hardware.In 2017, Birst was acquired by Infor. It now operates as a stand-alone subdivision withinInfor. Infor has been gradually replacing its packaged analytic applications for Infor’sbusiness application solutions (previously built with IBM Cognos) with Birst, dubbing thenew applications Birst for CloudSuite. The Birst analytics and BI team, meanwhile, hasgained a global footprint, additional sales representatives and data science talent.Birst’s new Smart Analytics capabilities, powered by Coleman AI, were on limitedrelease in 4Q18.Birst is a Niche Player in this Magic Quadrant. Birst’s reference customers primarily useits platform for agile, centralized BI provisioning (58%). The next most common use isfor decentralized analytics (45%).Strengths Cloud-native support for Mode 1 and Mode 2: Birst provides data preparation,dashboards, visual exploration and formatted, scheduled reports on a single platform.Few other vendors support both usage styles in this way. The networked semantic layerenables business units to create data models that can then be promoted to theenterprise. A new orchestration capability enables this content to be replicated tomultiple instances. Birst supports live connectivity to on-premises data sources.However, its rapid creation of a data model and all-in-one data warehouse that candraw on a range of storage options (Microsoft SQL Server Analysis Services, SAPHANA, Amazon Redshift) is a unique selling point. Sixty-one percent of Birst’s surveyedreference customers use Birst as their only analytics and BI standard. Vertical applications: Birst for CloudSuite now gives Infor ERP customers prebuiltextraction, transformation and loading (ETL), data models, and dashboards that are fullyintegrated into Infor business applications. For non-Infor data sources, Birst providessolution accelerators for specific domains, such as wealth management, insurance,sales and marketing. Global presence: With the acquisition by Infor, Birst has gained access to a globalsalesforce and additional R&D talent, particularly in the field of data science. It now alsohas a physical presence in 44 countries, an increase from three in 2016 when Birst wasa stand-alone vendor.Cautions Workflow and performance: Although Birst offers a single platform, workflow across theauthoring interfaces is not seamless. A large percentage of Birst’s reference customers(42%) highlighted poor performance (the highest figure for any vendor in this regard)and 26% complained about absent or weak functionality. Although Coleman AI marks
some innovation from Birst, initial tests of the limited release software show acumbersome workflow, and it rarely finds drivers for key metrics. Poor operations: Quality and timeliness of support have been perennial problems forBirst, and this has not improved in the past year or under Infor’s ownership. Birst’sreference customers’ scores for support and product quality place it bottom, with 10%considering its operations poor or limited. Gartner Peer Insights reviewers were lessnegative, however, with Birst being only slightly below average for service and support. Reduced relevance in analytics and BI market: There has been a decline in Gartnersearches and inquiries related to Birst, in comparison with 2017. Reference customers’responses indicate a decline in the product’s viability in this market (Birst was the onlyvendor for which there was negative sentiment in this regard, which suggests thatcustomers do not see Infor’s ownership as a net positive). Birst points to double-digitgrowth in revenue, but it is unclear how much of this growth derives from only the Inforinstalled base. Birst also had the highest percentage of reference customersconsidering discontinuing use of its product.BOARD InternationalBOARD International delivers a single, integrated system that provides BI, analytics andfinancial planning capabilities. The company’s stated aim is to provide an “end-to-enddecision-making platform.” BOARD continues to report strong revenue growth in excessof 50% year over year, with almost 20% of its revenue now coming from outsideEurope, where the company originated.In January 2019, Board announced that private equity firm Nordic Capital will become amajority shareholder. The deal is expected to close in 1Q19.BOARD is a Niche Player in this Magic Quadrant. It successfully serves a submarket forcentralized, single-instance analytics, BI and financial planning and analysis (FP&A)solutions. BOARD has a narrow focus and the market’s awareness of this vendor islimited, although its regional adoption is growing. BOARD has successfully transitionedto a cloud/subscription-based model. Its reference customers reported that the mostcommon use cases for BOARD’s system are agile, centralized BI provisioning (61%)and decentralized analytics (57%).Strengths Unified analytics, BI and FP&A: BOARD is one of only two vendors offering a modernanalytics and BI platform with integrated financial planning and reporting functionality(the other being SAP, with SAP Analytics Cloud). As such, it is highly differentiated forthe relatively small number of buyers looking to close the gap between BI and financialprocesses. BOARD is also used for read-only analytics and BI deployments, although,in Gartner’s view, this is less commonly the case. BOARD’s new self-service reportingcapabilities strengthen its Mode 1 support. Breadth of usage: BOARD ranks in the top third of vendors in this Magic Quadrant forcomplexity of analysis. Reference customers use BOARD for a wide range of BI tasks— from viewing reports, creating personalized dashboards and doing simple ad hocanalysis, to performing complex queries, undertaking data preparation and usingpredictive models.
System integrator ecosystem: For a relatively small vendor, BOARD has a wellestablished and growing network of system integrator (SI) partners, which are helping todrive its growth, whether as influencers or resellers. BOARD offers them a reliablesolution for the niche it operates in. Reference customers identify the main businessbenefit of using BOARD’s platform as the ability to make better decisions faster. Veryfew indicate that they plan to discontinue use of the product.Cautions Cube dependency: BOARD’s core cube architecture — based on multidimensionalonline analytical processing (MOLAP) — can become a limiting factor. This is especiallytrue for clients that need to access and analyze diverse data sources, and for those whowish to perform complex types of analysis on diverse data sources. Product delivery and vision: BOARD’s main software release in 2018, BOARD version10.3, was minor, adding self-service reporting and exporting to Microsoft Excel — itincluded little new functionality. The key BOARD 11 release, which will evolve theproduct beyond its MOLAP legacy, has been delayed by at least nine months. Itsroadmap is focused on re-engineering the core calculation and storage engine to takeadvantage of parallelization and concurrency and to be more flexible in how data ismodeled. Market awareness: BOARD is less well-known in this market than many of itscompetitors. Judging from Gartner’s interactions with organizations, very few longlistBOARD. It remains a little-known brand and needs to invest in raising its profile in theminds of potential buyers.DomoDomo offers a cloud-based analytics and BI platform aimed at senior executives andline-of-business users who need intuitive business-facing dashboards. Nearly two-thirds(65%) of its reference customers use Domo for decentralized analytics, and nearly half(48%) for governed data discovery.Domo went public in 2018, in the process gaining access to equity markets andbecoming more transparent about its financial performance. It added new functionalityfor R and Python integration.Domo remains a Niche Player. It executes strongly against many measures related tothe customer experience, and offers great ease of use. However, it has a narrow salesstrategy and a product vision that lags behind those of the Leaders. On the other hand,its roadmap includes new augmented analytics capabilities and automated alerting.Strengths Rapid deployment of management-style dashboards: Domo offers rapid deployment ofintuitive dashboards. Its cloud-native approach, aided by an extensive range of prebuiltconnectors to cloud-based data sour
Feb 11, 2019 · and business intelligence adoption from 35% of employees to over 50%, including new classes of users, particularly front-office workers. Market Definition/Description Modern analytics and business intelligence (BI) platforms are characterized by easy-to-use tools that support the ful