Transcription
Magic Quadrant for Business Intelligenceand Analytics PlatformsPublished: 16 February 2017ID: G00301340Analyst(s): Rita L. Sallam, Cindi Howson, Carlie J. Idoine, Thomas W. Oestreich,James Laurence Richardson, Joao Tapadinhasgartner.com
SummaryThe business intelligence and analytics platform market's shift from IT-led reporting to modern business-ledanalytics is now mainstream. Data and analytics leaders face countless choices: from traditional BI vendorsthat have closed feature gaps and innovated, to disrupters continuing to execute.Strategic Planning AssumptionsBy 2020, smart, governed, Hadoop/Spark-, search- and visual-based data discovery capabilities will converge into a singleset of next-generation data discovery capabilities as components of modern BI and analytics platforms.By 2021, the number of users of modern BI and analytics platforms that are differentiated by smart data discoverycapabilities will grow at twice the rate of those that are not, and will deliver twice the business value.By 2020, natural-language generation and artificial intelligence will be a standard feature of 90% of modern BI platforms.By 2020, 50% of analytic queries will be generated using search, natural-language processing or voice, or will beautogenerated.By 2020, organizations that offer users access to a curated catalog of internal and external data will realize twice thebusiness value from analytics investments than those that do not.Through 2020, the number of citizen data scientists will grow five times faster than the number of data scientists.Market Definition/DescriptionThis document was revised on 3 March 2017. The document you are viewing is the corrected version. Formore information, see the Corrections page on gartner.com.Visual-based data discovery, a defining feature of the modern business intelligence (BI) platform, began inaround 2004 and has since transformed the market and new buying trends away from IT-centric system ofrecord (SOR) reporting to business-centric agile analytics. Modern BI and analytics platforms are characterizedby easy-to-use tools that support a full range of analytic workflow capabilities and do not require significantinvolvement from IT in order to predefine data models upfront as a prerequisite to analysis (including atenterprise-scale deployment).Gartner redesigned the Magic Quadrant for BI and analytics platforms in 2016, to reflect this more thandecade-long shift. A year later, in 2017, there is significant evidence to suggest that the BI and analyticsplatform market's multiyear transition to modern agile business-led analytics is now mainstream. Reducedfeature differentiation among a crowded market of players, buyer requirements for larger enterprisedeployments, and the emergence pricing pressure are evidence of the maturity of the current market. Fortheir part, buyers want to expand modern BI usage, including for self-service to everyone in the enterprise andbeyond. They want users to analyze a more diverse range and more complex combinations of data sources(beyond the data warehouse or data lake) than ever before — without distinct data preparation tools. Whereasgartner.com
the initial modern BI disruption shifted purchasing from IT to the lines of business — where new tools initiallylanded as point purchases — as these tools have demonstrated value, enterprise buying of these platforms hasgrown to the point where the purchasing influence is tipping back to include IT and central purchasing groups.This is further evidence of market mainstreaming and has caused buyers to place greater emphasis onenterprise readiness, governance and price/value, in addition to the agility and ease of use demanded bybusiness users. Land-and-expand buying models are still important to demonstrate value and drive expansion,but mechanisms to economically scale deployments across the enterprise have gained in importance.The crowded BI and analytics market includes everything from longtime, large technology players to startupsbacked by enormous amounts of venture capital. What is new this year, is that traditional BI vendors that wereslow to adjust to the "modern wave of disruption" (such as IBM, SAP, Oracle and MicroStrategy) and struggledto remain relevant during the market transition, have finally matured their modern offerings enough to appealto many in their installed bases already using these platforms as the standard for enterprise reporting, andthat value their enterprise features and the potential to leverage years of investment in data models andanalytic content.Moreover, as the visual-based exploration paradigm has become mainstream, a new innovation wave isemerging that has the potential to be as disruptive as (or more than) visual-based data discovery has been tothe previous semantic-layer-based development approach of traditional BI and analytics platforms. While thecurrent visual-based data discovery approach has accelerated data harmonization and the visual identificationof patterns in data, as opposed to the previous IT-centric semantic-layer-based approach, the tasks for creatinginsights are still largely manual and prone to bias. Smart data discovery — introduced by IBM Watson Analyticsand BeyondCore (acquired by Salesforce as of September 2016) — leverages machine learning to automatethe analytics workflow (from preparing and exploring data to sharing insights and explaining findings). Naturallanguage processing (NLP), natural-language query (NLQ) and natural-language generation (NLG) for text- andvoice-based interaction and narration of the most statistically important findings in the user context are keycapabilities of smart data discovery. Consistent with the classic innovator's dilemma, many of the traditional BIvendors (such as IBM and SAP, which were innovators of the semantic-layer-based platform) were slow toadjust to the shift to modern BI. However, they have been ahead of the current modern BI disrupters —Tableau, Qlik and TIBCO Spotfire — now facing their own innovator's dilemma regarding investment in thenext smart data discovery market wave.Views on deployment options are also shifting and having an impact on the market. For the past three years,interest in deploying BI and analytics platforms in the cloud had been hovering around 45% of customerreference survey respondents for this Magic Quadrant — with the greatest interest coming from lines ofbusiness. In this year's survey, active and planned cloud BI deployments jumped to more than 51%, with muchof this shift in interest coming from IT respondents. Most BI and analytics platform vendors are nowresponding in a significant way: with a range of cloud deployment and subscription pricing model options, anddifferent degrees of support for leveraging the on-premises investments that buyers have already made.gartner.com
This Magic Quadrant focuses on products that meet the criteria of a modern BI and analytics platform(see "Technology Insight for Modern Business Intelligence and Analytics Platforms" ), which are driving themajority of net new mainstream purchases in the market today. Products that do not meet the modern criteriarequired for inclusion in the Magic Quadrant (because of the upfront requirements for IT to predefine datamodels, or because they are enterprise-reporting-centric) will be covered in our Market Guide for traditionalenterprise reporting platforms (to be published later in 2017). Emerging and next-generation innovativemodern BI and analytics platforms that do not yet meet the inclusion criteria for the Magic Quadrant arementioned in the Appendix to this Magic Quadrant.Magic Quadrant customer reference survey composite success measures are cited throughout the report.Reference customer survey participants scored vendors on each metric; these are defined in Note 1.The Five Use Cases and 15 Critical Capabilities of a BI and Analytics PlatformWe assess and define 15 product capabilities across five use cases as outlined below.Vendors are assessed for their support of five main use cases:Agile Centralized BI Provisioning. Supports an agile IT-enabled workflow, from data to centrally deliveredand managed analytic content, using the self-contained data management capabilities of the platform.Decentralized Analytics. Supports a workflow from data to self-service analytics. Includes analytics forindividual business units and users.Governed Data Discovery. Supports a workflow from data to self-service analytics to SOR, IT-managedcontent with governance, reusability and promotability of user-generated content to certified SOR dataand analytics content.OEM or Embedded BI. Supports a workflow from data to embedded BI content in a process or application.Extranet Deployment. Supports a workflow similar to agile centralized BI provisioning for the externalcustomer or, in the public sector, citizen access to analytic content.Vendors are assessed according to the following 15 critical capabilities. Changes, additions and deletions fromlast year's critical capabilities are listed in Note 2. Subcriteria for each capability are listed in Note 3, anddetailed functionality requirements are included in a published RFP document (see"Toolkit: BI and AnalyticsPlatform RFP" ). How well the platforms of our Magic Quadrant vendors support these critical capabilities isexplored in greater detail in "Critical Capabilities for Business Intelligence and Analytics Platforms."gartner.com
Infrastructure1. BI Platform Administration, Security and Architecture. Capabilities that enable platform security,administering users, auditing platform access and utilization, optimizing performance and ensuring highavailability and disaster recovery.2. Cloud BI. Platform-as-a-service and analytic-application-as-a-service capabilities for building, deploying andmanaging analytics and analytic applications in the cloud, based on data both in the cloud and on-premises.3. Data Source Connectivity and Ingestion. Capabilities that allow users to connect to structured andunstructured data contained within various types of storage platforms, both on-premises and in the cloud.Data Management4. Metadata Management. Tools for enabling users to leverage a common SOR semantic model and metadata.These should provide a robust and centralized way for administrators to search, capture, store, reuse andpublish metadata objects such as dimensions, hierarchies, measures, performance metrics/key performanceindicators (KPIs), and report layout objects, parameters and so on. Administrators should have the ability topromote a business-user-defined data mashup and metadata to the SOR metadata.5. Self-Contained Extraction, Transformation and Loading (ETL) and Data Storage. Platform capabilities foraccessing, integrating, transforming and loading data into a self-contained performance engine, with theability to index data and manage data loads and refresh scheduling.6. Self-Service Data Preparation. "Drag and drop" user-driven data combination of different sources, and thecreation of analytic models such as user-defined measures, sets, groups and hierarchies. Advanced capabilitiesinclude machine-learning-enabled semantic autodiscovery, intelligent joins, intelligent profiling, hierarchygeneration, data lineage and data blending on varied data sources, including multistructured data.Analysis and Content Creation7. Embedded Advanced Analytics. Enables users to easily access advanced analytics capabilities that are selfcontained within the platform itself or through the import and integration of externally developed models.8. Analytic Dashboards. The ability to create highly interactive dashboards and content with visual explorationand embedded advanced and geospatial analytics to be consumed by others.9. Interactive Visual Exploration. Enables the exploration of data via an array of visualization options that gobeyond those of basic pie, bar and line charts to include heat and tree maps, geographic maps, scatter plotsand other special-purpose visuals. These tools enable users to analyze and manipulate the data by interactingdirectly with a visual representation of it to display as percentages, bins and groups.gartner.com
10. Smart Data Discovery: Automatically finds, visualizes and narrates important findings such as correlations,exceptions, clusters, links and predictions in data that are relevant to users without requiring them to buildmodels or write algorithms. Users explore data via visualizations, natural-language-generated narration,search and NLQ technologies.11. Mobile Exploration and Authoring. Enables organizations to develop and deliver content to mobile devicesin a publishing and/or interactive mode, and takes advantage of mobile devices' native capabilities, such astouchscreen, camera and location awareness.Sharing of Findings12. Embedding Analytic Content. Capabilities including a software developer's kit with APIs and support foropen standards for creating and modifying analytic content, visualizations and applications, embedding theminto a business process and/or an application or portal. These capabilities can reside outside the application,reusing the analytic infrastructure, but must be easily and seamlessly accessible from inside the applicationwithout forcing users to switch between systems. The capabilities for integrating BI and analytics with theapplication architecture will enable users to choose where in the business process the analytics should beembedded.13. Publish, Share and Collaborate on Analytic Content. Capabilities that allow users to publish, deploy andoperationalize analytic content through various output types and distribution methods, with support forcontent search, scheduling and alerts. Enables users to share, discuss and track information, analysis, analyticcontent and decisions via discussion threads, chat and annotations.Overall platform capabilities were also assessed:14. Platform Capabilities and Workflow. This capability considers the degree to which capabilities are offeredin a single, seamless product or across multiple products with little integration.15. Ease of Use and Visual Appeal. Ease of use to administer and deploy the platform, create content, consumeand interact with content, as well as the visual appeal.gartner.com
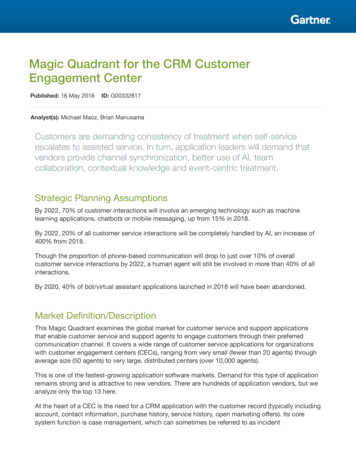
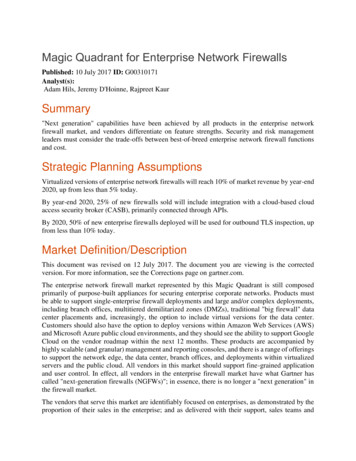
Magic QuadrantFigure 1. Magic Quadrant for Business Intelligence and Analytics PlatformsSource: Gartner (February 2017)gartner.com
Inclusion and Exclusion CriteriaThis year's Magic Quadrant includes 24 vendors that met all our inclusion criteria, as listed below.Modern BI and Analytics Platform AssessmentThis was evaluated by Gartner analysts and was determined by the extent of IT involvement that is consideredto be mandatory before the platform can be used by a business analyst/information worker to analyze data,without IT assistance. Products that require significant IT involvement, either internal or external to theplatform, in order to load and model data, create a semantic layer, build data structures as a prerequisite tousing the BI platform or are IT developer-centric platforms focused on building analytic applications, do notmeet the criteria of a modern BI and analytics platform and were not evaluated further for inclusion. Productsthat met the modern criteria were evaluated for inclusion in the Magic Quadrant based on a funnelmethodology where requirements for each tier must be met in order to progress to the next tier. Tiers 1 to 3 areevaluated at the vendor level; Tiers 4 and 5 are evaluated at the product level.Vendor-Level CriteriaTier 1. Market Presence — A composite metric assessing both the interest of Gartner's client base and thatof the broader market, through internet search volume, job postings and trend analysis, was conducted foreach vendor.Tier 2. Revenue* — For those vendors meeting the market presence criteria (Tier 1), BI and analyticsrevenue for each vendor was assessed and evaluated. For this assessment, two common license modelswere assessed and revenue from each was combined (if applicable) and evaluated against the three revenueinclusion levels (shown below) for qualification:Perpetual License Model — Software license, maintenance and upgrade revenue (excludinghardware and services) for calendar years 2014, 2015 and 2016 (estimated).SaaS Subscription Model — Annual contract value (ACV) for year-ends 2014, 2015 and projected ACVfor year-end 2016, excluding any services included in annual contract. For multiyear contracts, onlythe contract value for the first 12 months should be used for this calculation.Revenue inclusion levels are as follows: 25 million 2016 (estimated) combined perpetual license revenue 2016 (estimated) ACV, or 15 million 2016 (estimated) combined perpetual license revenue 2016 (estimated) ACV with 50%year-over-year growth, or 10 million 2016 (estimated) combined perpetual license revenue 2016 (estimated) ACV with 100%year-over-year growthgartner.com
* Gartner defines total software revenue as revenue that is generated from appliances, new licenses,updates, subscriptions and hosting, technical support and maintenance. Professional services revenue andhardware revenue are not included in total software revenue (see "Market Share Analysis: BusinessIntelligence and Analytics Software, 2015" ).Tier 3. Magic Quadrant Process Participation — Participation in the Magic Quadrant process requires thefollowing input:Completing and providing documentation for an RFP-style questionnaire of detailed criticalcapabilities.Completing an online questionnaire around market presence, growth, go-to-market strategy anddifferentiation.Submission of a video up to one-hour long that demonstrates how included products deliver on thepredefined analytic scenarios defined by Gartner (we only look at the first hour; anything beyondthat is not considered).Verification of final BI and analytics revenue for 2014, 2015 and 2016 (estimated).Providing references for an online customer and OEM survey.Providing a vendor briefing to the Magic Quadrant authors.Providing access to evaluation software.Providing factual review of sections in the Magic Quadrant research.Product-Level CriteriaTier 4. Breadth of Coverage — The vendor must demonstrate breadth across vertical industries andgeographic regions, as specified by Gartner.Tier 5. Product Assessment — Products that progressed to this final tier were assessed by Gartner analystsusing the information provided by each vendor in the data collection exercise outlined above. The finalstep involved narrowing down the field to 24 vendors for inclusion in the Magic Quadrant.Gartner has full discretion to include a vendor on the Magic Quadrant regardless of their level ofparticipation in the Magic Quadrant process, if the vendor is deemed important to the market. Thisdiscretion was not applied this year as all vendors fully participated in the process.Evaluation CriteriaAbility to Executegartner.com
Vendors are judged on Gartner's view of their ability and success in making their vision a market reality thatcustomers believe is differentiated and that they buy into. Delivering a positive customer experience, includingsales experience, support, product quality, user enablement, availability of skills, ease of upgrade/migration,also determines a vendor's Ability to Execute. In addition to the opinions of Gartner's analysts, the ratings andcommentary in this report are based on a number of sources: customers' perceptions of each vendor'sstrengths and challenges, as gleaned from their BI and analytics-related inquiries with Gartner; an onlinesurvey of vendors' customers conducted during October 2016 (which yielded 1,931 responses); aquestionnaire completed by the vendors; vendors' briefings, including product demonstrations, strategy andoperations; an extensive RFP questionnaire inquiring how each vendor delivers the specific features that makeup our 15 critical capabilities for this market (see "Toolkit: BI and A
Governed Data Discovery. Supports a workflow from data to self-service analytics to SOR, IT-managed content with governance, reusability and promotability of user-generated content to certified SOR data and analytics content. OEM or Embedded I. Supports a workflow from data to embedded I