Transcription
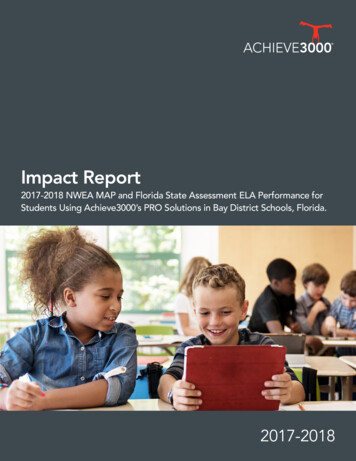
Impact Report2017-2018 NWEA MAP and Florida State Assessment ELA Performance forStudents Using Achieve3000’s PRO Solutions in Bay District Schools, Florida.2017-20182 0 1 7 - 2 0 1 8 I M PA C T R E P O R T21
INTRODUCTIONDuring the fall of the 2017-2018 school year, Bay DistrictSchools launched its use of Achieve3000’s literacysolutions with all of its elementary school students aswell as for students in sixth through tenth grades whoneed intervention based on the district’s Response toIntervention (RTI) model. Since Bay District Schools usesNWEA MAP as a diagnostic and benchmarking test, thedistrict leadership thought Achieve3000 was a great fitbecause of the platform’s ability to provide small-grouplesson plans targeting the skills each student needs to workon most, according to MAP performance data that can beimported into the PRO system. Known for its strong districtleadership, Bay District Schools advocated for providing onsite professional development to every single one of their3,000 teachers in one day! Bay District Schools is locatedin the Florida Panhandle, popular for its beaches, and servesthe students of Bay County, including Panama City.In 2017-2018, there were 28,076 ethnically diverse studentsenrolled in preschool through 12th grades with 86 percentof students identified as white, 15 percent as black, eightpercent as Hispanic, seven percent of students identifiedas one or more races, two percent as Asian, and about halfof a percent as American Indian or Pacific Islander. Acrossthe district, 18 percent of students had disabilities, threepercent were English language learners, and 53 percentqualified for free and reduced lunch.1(https://edstats.fldoe.org).Following the 2017-2018 school year, Achieve3000conducted an analysis of Bay District Schools students’performance on the NWEA MAP (Grades K-2) and theFlorida State Assessment for English language arts (FSAELA) (Grades 4-10) tests in relation to students’ usageof Achieve3000’s literacy solutions during the 2017-2018school year. The solutions examined in this document– Smarty Ants (grades K-2), KidBiz3000 (grades 2-5),TeenBiz3000 (grades 6-8), and Empower3000 (grades9-12) – are powered by a patented methodology thatdelivers grade-appropriate lessons to the entire class, andsimultaneously tailors them according to each student’sLexile reading level. Achieve3000’s solutions have beenproven to accelerate reading comprehension, fluency,writing proficiency, and vocabulary development.METHODOLOGYThis report relies on internal Achieve3000 usage and Lexile data as well as NWEA MAP data for grades K-2 and FSA ELAdata for grades 4-10 from Fall 2017 and Spring 2018. To examine the impact of Achieve3000 usage on Lexile growth, twosample groups of 4,162 students in kindergarten through second grade and 4,061 students in fourth through tenth gradeswho met the following inclusion criteria were identified:Had valid pre-test and end-of-year Lexile scores during the 2017-2018 school yearHad at least 60 days between the date of their most recent Lexile assessment and their pre-testCompleted at least 10 multiple-choice activity sets following an article in Smarty Ants, KidBiz3000, TeenBiz3000or Empower30001“Enrollment for Bay County Public Schools.” Florida’s PK-20 Education Information Portal. Accessed May 16, 2019.2 0 1 7 - 2 0 1 8 I M PA C T R E P O R T1
MEASURESLevelSetNWEA MAPDeveloped by Achieve3000 in partnership with MetaMetrics ,the LevelSet assessment identifies each student’s Lexilereading measure and is a reliable means of matching studentreading levels to informational text. The LevelSet assessmentcan be administered up to three times per year—a pre-testat the beginning of the school year, an interim test in themiddle of the school year, and a post-test at the end of theschool year—to measure student progress and provide asummative measurement of student growth in English orSpanish. Achieve3000 and MetaMetrics developed 4 gradespecific achievement level descriptors for college and careerreadiness: falls far below, approaches, meets, and exceeds.Achieve3000 considers students performing in the higher twoachievement levels (meets and exceeds) to be “on track” forcollege and career readiness, whereas students performingin the lower two achievement levels (falls far below andapproaches) are considered to be “not-on-track.”Students enrolled in kindergarten through second gradeparticipate in the NWEA MAP Growth, which measuresstudent achievement in reading, language usage, math,and science. Students take the test three times per year:fall, winter, and spring. NWEA MAP Growth provides RITscores, based on a stable scale that measures performanceregardless of age, grades, or grade level. Students alsoreceive a projected growth value which represents how mucha student is expected to grow in RIT from one administrationof the test (e.g. fall) to another (e.g. spring). These projectionsare based on norms given each student’s starting score,grade level, and when each test is administered.Achieve3000 uses a Bayesian scoring algorithm, alsodeveloped by MetaMetrics, to provide continually updatedmeasures that reflect the students’ progress in readingdevelopment. As the student reads and responds tononfiction text during their reading lessons, the Bayesianapproach continually refines each student’s Lexile measure.By using multiple measures over time, the Bayesian scoringalgorithm improves the accuracy of measurement asstudents learn. With this approach, Achieve3000’s proprietaryengine is able to improve its ability to match students withappropriate texts and to forecast student readiness forcollege and career benchmarks.FSA ELAStudents enrolled in 4th through 10th grades participate inthe FSA which measures student achievement in Englishlanguage arts and math. Students take the test once, at theend of the school year. Raw scores on the FSA are convertedto scale scores using an Item Response Theory (IRT) model,which considers statistical characteristics (i.e. whether an item iseasier to guess) of an item and whether the student answeredthe item correctly. These scores are also associated withperformance levels (1 Inadequate, 2 Below Satisfactory, 3 Satisfactory, 4 Proficient, and 5 Mastery), that representdifferent ranges of scores for each grade level. Level 1 is furtherbroken down into 3 sublevels and Level 2 is broken down into 2sublevels. Learning gains on the FSA are defined as an increasein performance level, an increase in performance sublevel withLevels 1 and 2, maintenance of levels 3 or 4 with a scale scoregrowth, or maintenance of level 5.2 0 1 7 - 2 0 1 8 I M PA C T R E P O R T2
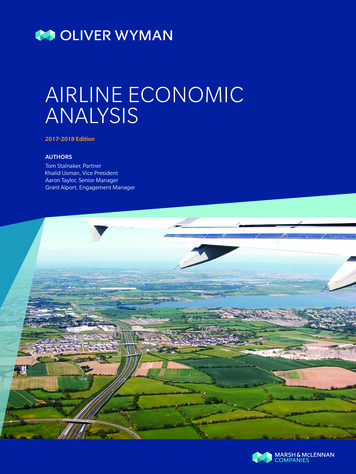
RESULTS FOR GRADES K-2Smarty Ants UsageOver the course of the 2017-2018 school year, participating students in kindergarten through second grade logged in anaverage of 121 times, and completed 22 lessons. Kindergarten students completed more lessons than the other grades (23lessons). Overall, students made 50 percent progress toward their end-of-year goal, with kindergarteners making the mostprogress (59%). See Table 1 for detailed usage data.Table 1: Program Usage Summary Overall and by Grade, 2017-2018 School YearGradeStudentsLog-ins(Avg.)Initial Lesson(Median)Initial 1174387012223All Grades4,162121215458223*Lessons completed does not include skipped lessons.Impact of Smarty Ants on NWEA MAP for Primary Grades (MPS) PerformanceOn average, Smarty Ants students demonstrated RIT growth of 20 points, compared to a typical RIT growth as reported byNWEA of 16 points, on average. Kindergarteners showed the most growth (23 points), compared to typical growth for theirgrade level of 17 points. Students who completed more lessons in Smarty Ants had greater RIT growth. Notably, students whocompleted 60 Smarty Ants lessons or more saw RIT growth of 27 points compared to typical growth of 17 points (see Graph1). A strong and positive relationship was found between both the Initial Lesson in Smarty Ants and fall RIT score (r 0.8, p 0.0001) as well as between the Current Lesson in Smarty Ants and Spring RIT score (r 0.7, p 0.0001).Graph 1: RIT Growth on NWEA MAP, by Usage302527%RIT Growth20151020%16%20%16%17%22%17%505-19 LessonsFall to Spring Typical Growth20-39 Lessons40-59 Lessons60 LessonsFall to Spring Actual Growth2 0 1 7 - 2 0 1 8 I M PA C T R E P O R T3
RESULTS FOR GRADES 4-10Program UsageOver the course of the 2017-2018 school year, participating students in 4th-8th grades logged in an average of 100 times,completed 47 lessons (i.e. multiple-choice activity sets), and demonstrated an average first-try score of 65 percent onembedded assessments. Students in Grade 4 completed more lessons than the other grades (50), and tenth graders had thehighest average first-try score (AFTS) of 71 percent. See Table 2 for detailed usage data.Table 2: Program Usage Summary Overall and by Grade, 2017-2018 School YearGradeStudentsLog-ins(Avg.)Program Hours(Avg.)Activities(Avg.)AFTS% with 40 Activities 75% 4%102518274471%20%All Grades4,061100284765%9%2 0 1 7 - 2 0 1 8 I M PA C T R E P O R T4
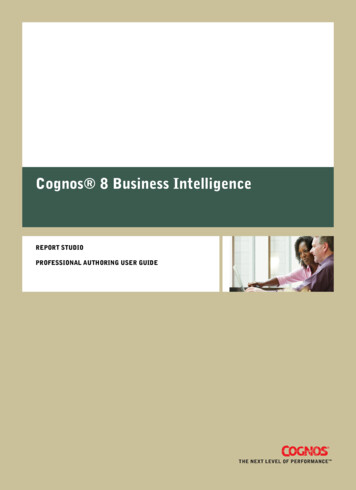
RESULTS FOR GRADES 4-10 (cont.)LevelSetImpactofPerformanceAchieve3000 on LevelSetOverall, students demonstrated an average Lexile growth of 98L, which exceeded their average expected growth of 83L.Students with greater quantity and quality of practice saw greater Lexile gains. Specifically, students who completed 80 ormore lessons and had an average first-try score of at least 75 percent on the embedded assessment achieved gains of 281L onaverage, which was three and half times their expected growth of 81L (see Graph 2). In addition, the percentage of Bay DistrictSchools students in this sample who were on track for college & career readiness increased from seven percent to twelvepercent over the course of the 2017-2018 school year.Graph 2: Fall 2017-Spring 2018 Actual vs. Expected Lexile Growth for Students Using Achieve3000 with DifferentQuantity and Quality of PracticeHigh Fidelity UsageMC 10-39MC 40-79300Average Lexile68L100281L199L167L200MC 80 75%Avg. FirstTry Score81L68L30020083L100Avg. ExpectedLexile Growth61L87L77L102L126L 75%Avg. FirstTry ScoreAvg. ActualLexile GrowthStudents in Usage GroupsMC 10-39MC 40-79MC 80 TOTAL 75%406(10%)267(7%)551(3%)780(19%) 8(54%)1,302(32%)551(14%)4,061(100%)2 0 1 7 - 2 0 1 8 I M PA C T R E P O R T5
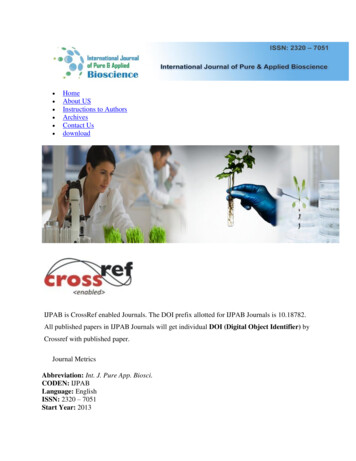
RESULTS FOR GRADES 4-10 (cont.)FSA ELA PerformanceGraph 3: Bay District Schools ElementaryAchieve3000 Students, % Scoring in Level 3 or Above onFSA ELA, by Quantity and Quality of Use.High 5 75% AFTSPercentage with Learning Gains60%78% 75% AFTS100%On average, students saw a scale score increase of 8 pointsfrom 2017 to 2018. Students who completed 80 or morelessons and maintained an average first-try score of 75percent or above on the embedded assessments gainedan average of 16 points (elementary school) and 14 points(middle and high school). Overall, 45 percent of students whoused Achieve3000’s PRO solutions showed learning gains onNWEA MAP and FSA for English language arts from 2017 to2018. Eighty-five percent of students in elementary schooland 57 percent of students in middle and high school whocompleted 80 lessons and maintained an average first-tryscore of 75 percent or above on the embedded assessmentsmade learning gains. See Graph 3 for the elementary studentresults. The correlation between students’ spring Lexilemeasure and 2018 FSA scale score was strong and positive(r .76, p .0001). See Graph 3 for the elementary studentresults. The correlation between students’ spring Lexilemeasure and 2018 FSA scale score was strong and positive(r .76, p .0001).OF ELEMENTARYSTUDENTS0MC 10-39MC 40-79MC 80 Who completed 80 multiple-choice activitieswith a 75% AFTS madelearning gains on the FSA.Total # of Activities CompletedStudents in Usage GroupsMC 10-39MC 40-79MC 80 TOTAL 75%184(9%)89(4%)53(3%)780(16%) %)578(28%)332(16%)2,048(100%)2 0 1 7 - 2 0 1 8 I M PA C T R E P O R T6
CONCLUSIONThe vision of Bay District Schools is to “develop all studentsto their highest potential to produce successful, innovativecitizens and leaders for tomorrow’s world.” We commendBay District Schools for including a strong focus on literacythroughout their schools and curriculum as a central partof their strategic approach to achieving their mission. Theirstudents’ improvement on both the LevelSet and on theNWEA MAP as well as FSA ELA after using Achieve3000’sliteracy solutions during the 2017-2018 school year validatesthe dedication and expertise of their educators and leaders.2 0 1 7 - 2 0 1 8 I M PA C T R E P O R T7
Impact Report2017-2018 NWEA MAP and Florida State Assessment ELA Performance for Students Using Achieve3000’sPRO Solutions in Bay District Schools, Florida.Published by Achieve3000, Inc.,1985 Cedar Bridge Avenue, Suite 3, Lakewood, NJ 08701www.Achieve3000.com 2019 Achieve3000All rights reserved.No portion of this paper may be reproduced in any form without permission from the publisher, except as permitted by U.S.copyright law.For permissions contact: marketing@achieve3000.comContent by Achieve3000.Design by Kenny Price.Learn more about Achieve3000’sproven solutions today.ACHIEVE3000.COMPhone: 800.838.8771Email: info@achieve3000.com2 0 1 7 - 2 0 1 8 I M PA C T R E P O R T8
3,000 teachers in one day! Bay District Schools is located in the Florida Panhandle, popular for its beaches, and serves the students of Bay County, including Panama City. In 2017-2018, there were