Transcription
The EconomicImpact of theAchievementGap in America’sSchools
2AcknowledgmentsRecent national and international tests show significant differences instudent achievement. Students in the United States perform behind theirOECD peers. Within the United States, white students generally performbetter on tests than black students; rich students generally performbetter than poor students; and students of similar backgrounds performdramatically differently across school systems and classrooms.The aim of this paper is to provide a common, neutral fact base on eachof these achievement gaps and to illustrate their relative magnitude. Inaddition, we highlight the impact of the United States achievement gapon the overall economy and on individual life outcomes. This work is notintended to provide a detailed assessment of the causes and potentialcures of the achievement gap. Instead, we hope to provide a common factbase from which such discussions may proceed.Our Steering Committee provided significant input and included membersfrom the Education Equality Project, the National Action Network,the United States Chamber of Commerce, the Bill and Melinda GatesFoundation, and the Center for American Progress. We owe a specialdebt of gratitude to Cindy Brown, Chris Cerf, Lisa Graham Keegan,Charlie King, Joel Klein, Arthur Rothkopf, Reverend Al Sharpton and EllenWinn. Their collective guidance and diverse perspectives on educationalachievement were critical throughout the project. In addition, numerousexperts on education, labor markets, and economic growth - includingMartin Bailey, Anthony Carnevale, Michael Casserly, Michael Cohen, LindaDarling-Hammond, Brian Ellner, Karen Elzey, Benjamin Friedman, JewellGould, Eric Hanushek, Kati Haycock, Ronald Henderson, Frederick Hess,Lawrence Katz, Ron Krouse, Lydia Logan, Michael Lomax, Reagan Miller,John Mitchell, Andrew Rotherham, Andreas Schleicher, Sheila Simmons,Margaret Spellings and Michael Wotorson - provided their time andinvaluable insights to the team.This work is part of the fulfillment of McKinsey’s social sector mission tohelp leaders and leading institutions to understand and address importantand complex societal challenges. As with all McKinsey research, resultsand conclusions are based on the unique outlook and experience basethat McKinsey experts brings to bear. This perspective is independent andthis report has not been commissioned or financially supported by anybusiness, government, or other institution
McKinsey & Company, Social Sector OfficeThe Economic Impact of the Achievement Gap in America’s SchoolsThe Economic Impact of the AchievementGap in America’s SchoolsSummary of FindingsApril 20093
4
McKinsey & Company, Social Sector OfficeThe Economic Impact of the Achievement Gap in America’s Schools5“ These educational gapsimpose on the United Statesthe economic equivalent ofa permanent nationalrecession.”IntroductionThe extent to which a society utilizes its human potentialis among the chief determinants of its prosperity. In theUnited States, one focus of concern in this regard has beenthe existence of a so-called achievement gap in educationbetween certain groups of students and others.1 Whilemuch controversy exists on the causes of the achievementgap, and on what the nation should do to address it,the full range of the achievement gap’s character andconsequences has been poorly understood. For one thing,important dimensions of four distinct achievement gaps—(1) between the United States and other nations; (2)between black and Latino2 students and white students;3(3) between students of different income levels; and (4)between similar students schooled in different systems orregions—have not always been clarified and documented.In addition, while great emphasis has been placed onthe moral challenges raised by the achievement gap, itseconomic impact has received less attention.Given our longstanding work on the factors that influencenational productivity, and the perceived urgency ofunderstanding opportunities to improve the US economy’sperformance, McKinsey & Company believes it is timely tobring together, in one place, a set of analyses that shed lighton the price of current educational practices. This studybuilds on excellent work done by many researchers in thefield, while also reflecting the angle of vision and expertiseof McKinsey’s Social Sector Office, which serves schoolsystems in the United States and around the world.This report finds that the underutilization of human potentialin the United States is extremely costly. For individuals, ourresults show that:r Avoidable shortfalls in academic achievement imposeheavy and often tragic consequences, via lower earnings,poorer health, and higher rates of incarceration.r For many students (but by no means all), laggingachievement evidenced as early as fourth grade appearsto be a powerful predictor of rates of high school andcollege graduation, as well as lifetime earnings.For the economy as a whole, our results show that:r If the United States had in recent years closed the gapbetween its educational achievement levels and thoseof better-performing nations such as Finland and Korea,GDP in 2008 could have been 1.3 trillion to 2.3 trillionhigher. This represents 9 to 16 percent of GDP.r If the gap between black and Latino student performanceand white student performance had been similarlynarrowed, GDP in 2008 would have been between1. In this analysis, we focus mainly on “achievement,” which reflects the mastery of particular cognitive skills or concepts as measured through standardized tests, rather than“attainment,” which measures educational milestones such as graduation rates.2. Latino is used to describe either Latino or Hispanic classifications within data analyzed for this report. Categories were developed in 1997 by the Office of Management and Budget(OMB) that are used to describe groups to which individuals belong, identify with, or belong in the eyes of the community. The categories do not denote scientific definitions ofanthropological origins.3. This analysis focuses on achievement differentials between black and Latino students and white students. This is primarily because blacks and Latinos are the two largest minoritygroups in the United States and are represented in many of the regions and school districts across the country. While achievement differentials certainly exist among other minoritygroups (Native Americans, Asians, students of more than one race), data limitations and small sample sizes often make it difficult to make national and state-level comparisons. Webelieve this is an area for future research, especially as data collection improves.
6“ The wide variation inperformance among schoolsserving similar studentssuggests that these gapscan be closed. Race andpoverty are not destiny.” 310 billion and 525 billion higher, or 2 to 4 percent ofGDP. The magnitude of this impact will rise in the yearsahead as demographic shifts result in blacks and Latinosbecoming a larger proportion of the population andworkforce.r If the gap between low-income students and the rest hadbeen similarly narrowed, GDP in 2008 would have been 400 billion to 670 billion higher, or 3 to 5 percent of GDP.r If the gap between America’s low-performing states andthe rest had been similarly narrowed, GDP in 2008 wouldhave been 425 billion to 700 billion higher, or 3 to 5percent of GDP.Put differently, the persistence of these educationalachievement gaps imposes on the United States theeconomic equivalent of a permanent national recession.The recurring annual economic cost of the internationalachievement gap is substantially larger than the deeprecession the United States is currently experiencing.4 Theannual output cost of the racial, income, and regional orsystems achievement gap is larger than the US recession of1981–82.compelling. In particular, the wide variation in performanceamong schools and school systems serving similarstudents suggests that the opportunity and output gapsrelated to today’s achievement gap can be substantiallyclosed. Many teachers and schools across the countryare proving that race and poverty are not destiny; manymore are demonstrating that middle-class children can beeducated to world-class levels of performance. America’shistory of bringing disadvantaged groups into the economicmainstream over time, and the progress of other nations ineducation, suggest that large steps forward are possible.The balance of this summary report is organized intothree sections. First, the report shares key findings on theinternational, racial, income, and systems-based gapsfacing the United States. Next, the report assesses theeconomic impact of these gaps for the economy as awhole and for individuals. Finally, the report notes potentialimplications of the work and suggests areas for furtherstudy. A companion document containing McKinsey’s fullanalysis, “Detailed Findings on The Economic Impact ofthe Achievement Gap in America’s Schools,” is availablefor download on the Web at http://www.mckinsey.com/achievementgap.5While the price of the status quo in educational outcomesis remarkably high, the promise implicit in these findings is4. Based on GDP decline in the fourth quarter of 2008 of minus 6.3 percent.5. This expanded document includes sources for facts and analyses cited in this summary as well as explanations of methodologies.
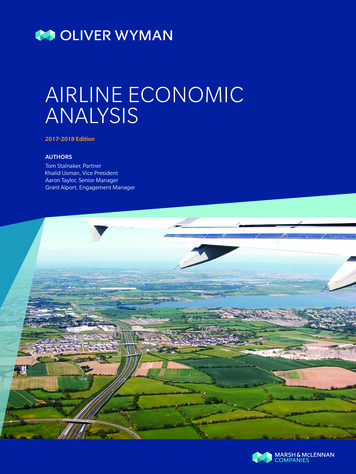
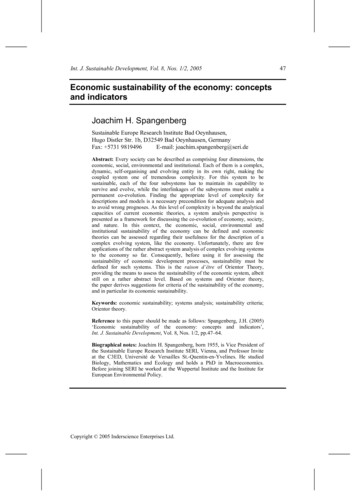
McKinsey & Company, Social Sector OfficeThe Economic Impact of the Achievement Gap in America’s Schools7Findings On The Achievement GapTo document the dimensions of the four identifiedachievement gaps, we conducted a thorough literaturereview, interviewed a number of the leading researchers inthe field, and performed new independent analyses. Ourkey findings follow.The international achievement gapThe United States lags significantly behind other advancednations in educational performance and is slipping furtherbehind on some important measures. In addition, the gapbetween ours and others’ performance widens the longerchildren are in school. The facts here demonstrate thatlagging achievement in the United States is not merelyan issue for poor children attending schools in poorneighborhoods; instead, it affects most children in mostschools.The Program for International Student Assessment (PISA)is a respected international comparison of 15-year-olds bythe OECD that measures “real-world” (applied) learning andproblem-solving ability. In 2006 the United States ranked25th of 30 nations in math and 24th of 30 in science (Exhibit1). American 15-year-olds are on par with students inPortugal and the Slovak Republic, rather than with studentsin countries that are more relevant competitors for servicesector and high-value jobs like Canada, the Netherlands,Korea, and Australia.This ranking signals the striking erosion of America’sonetime leadership in education. Forty years ago the UnitedExhibit 1PISA rankings show United States trailing other OECD countries A0 ,20 ' 8,?308,?4. .: 0 4230 @,74?D ?3:B0 @,74?D @ 4@7 AD84'8F;8D 4@7E I FL8D 4@74@474#4B4@'8I 284 4@7 8 : G? GEFD4 48@?4D L86; *8BG5 6"68 4@7 GEFD 48D?4@K I878@"D8 4@7D4@68-@ F87 @:7A?)A 4@7 AH4 *8BG5 6!G@:4DK%GJ8?5AGD:'ADI4K B4 @)94?0/ '?,?0 )ADFG:4 "F4 KD8868,GD 8K&8J 6A A0 ,20 ' .409.0 .: 0 6495495492491490490480474466462459424406 AD84 @ 4@74@474'8I 284 4@7'8F;8D 4@7E GEFD4 4 I FL8D 4@7 8 : G?#4B4@"D8 4@7 I878@8@?4D )A 4@78D?4@K GEFD 4L86; *8BG5 6-@ F87 @:7A?"68 4@7D4@68'ADI4K!G@:4DK%GJ8?5AGD: AH4 *8BG5 6 ?3 )94?0/ '?,?0 B4 @)ADFG:4 "F4 KD8868,GD 8K&8J 6A H8D4:8 'AF8 *8EG FE 4D8 9AD ( 6AG@FD 8E ( B4DF@8D 6AG@FD 8E @AF @6 G787 998D8@68E ?4K @AF 58 EF4F EF 64 K E :@ 9 64@F (-* ( 5495492487487485479474470469465459436408 H8D4:8
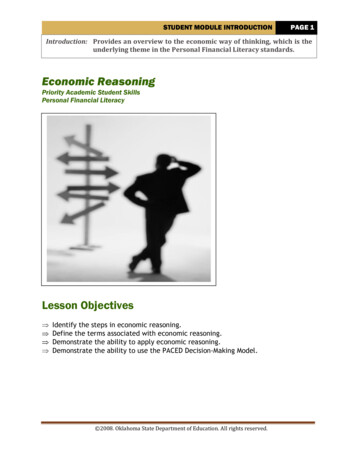
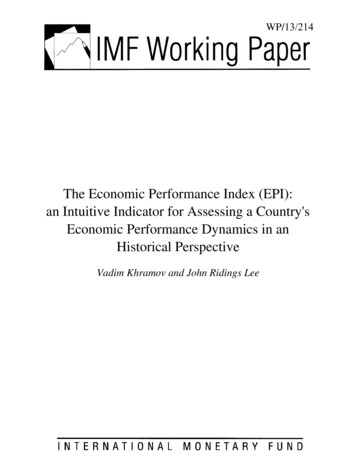
8Exhibit 217 countries have higher average test scores and lower income-basedinequality than the United States%@,74?D H8D4:8 )" ?4F;8?4F 6E E6AD8 4230 @ 4@7 @,74?D #4B4@4@474 "68 4@7 AD84'8F;8D 4@7E I FL8D 4@7 8 : G?'8I 284 4@7 GEFD4 48@?4D L86; *8BG5 6 GEFD 4 D4@68 I878@8D?4@K AH4 *8BG5 6"D8 4@7'ADI4K %GJ8?5AGD: B4 @ )A 4@7 "F4 K!G@:4DK-@ F87 F4F8E)ADFG:4 D8868,GD 8K&8J 6A 51015:B0 @,74?D202530 @4?D A9 H4D 4@68 @ EFG78@F B8D9AD?4@68 7G8 FA EA6 A86A@A? 6 EF4FGE !: 0 0 @,70 0 @,7 A6 A86A@A? 6 EF4FGE 4E ?84EGD87 5K )" OE @78J A9 86A@A? 6 EA6 4 4@7 6G FGD4 EF4FGE (-* %84D@ @: 9AD ,A?ADDAI E /AD 7 Q DEF *8EG FE 9DA? )" &6 @E8K 4@4 KE E States was a leader in high school graduation rates; todayit ranks 18th out of 24 industrialized nations. As recently as1995 America was tied for first in college graduation rates;by 2006 this ranking had dropped to 14th.6 In part the trendcan be explained by what author Fareed Zakaria has called“the rise of the rest.” Economist Eric Hanushek and othersrecently studied all international tests in reading, math,and science administered between 1964 and 2003 andplaced them on a common scale.7 They found that studentsin the United States did not register gains over the pastfour decades, while students in currently top-performingsystems like the Netherlands and Finland improved.Several other facts paint a worrisome picture. First, thelonger American children are in school, the worse theyperform compared to their international peers. In recentcross-country comparisons of fourth grade reading, math,and science, US students scored in the top quarter or tophalf of advanced nations. By age 15 these rankings dropto the bottom half. In other words, American studentsare farthest behind just as they are about to enter highereducation or the workforce.Next, there is a striking gap between the performance ofAmerica’s top students and that of top students elsewhere.The United States has among the smallest proportion of15-year-olds performing at the highest levels of proficiencyin math. Korea, Switzerland, Belgium, Finland, and theCzech Republic have at least five times the proportion oftop performers as the United States.Furthermore, the gap between students from rich and poor6. National Governors Association, Benchmarking for Success: Ensuring US Students Receive a World-Class Education, (2008).7. E. Hanushek, et al., “Education and economic growth,” Education Next (Spring 2008), 65.
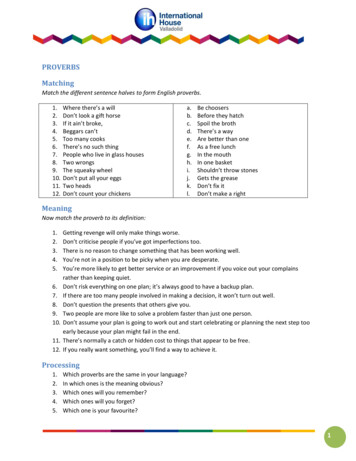
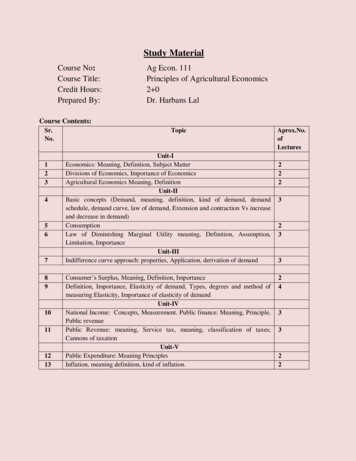
McKinsey & Company, Social Sector OfficeThe Economic Impact of the Achievement Gap in America’s Schools9expenditures, school spending in the United Statesis among the least cost-effective in the world. By onemeasure we get 60 percent less for our education dollars interms of average test-score results than do other wealthynations (Exhibit 3).families is much more pronounced in the United Statesthan in other OECD nations (Exhibit 2). In a world-classsystem like Finland’s, socioeconomic standing is far lesspredictive of student achievement. All things being equal,a low-income student in the United States is far less likelyto do well in school than a low-income student in Finland.Given the enormous economic impact of educationalachievement, this is one of the best indicators of equalopportunity in a society, and one on which the UnitedStates fares poorly.The racial achievement gapOn average, black and Latino students are roughly twoto three years of learning behind white students of thesame age. This racial gap exists regardless of how it ismeasured, including both achievement (e.g., test score)and attainment (e.g., graduation rate) measures. Takingthe average National Assessment of Educational ProgressIn one sense this poor performance is surprising,considering the high per capita income in the UnitedStates, which is generally correlated with higher levels ofeducational achievement. And despite large educationalExhibit 3The United States spends more than any other country per point on PISAmathematics test'.3::7 ;09/492 .: ? 0110.?4A090 @ 6G?G 4F H8 EB8@7 @: B8D EFG78@F B8D BA @F A@ )" ?4F;8?4F 6E )94?0/ '?,?0 "F4 K GEFD 4 I FL8D 4@7'ADI4K8@?4D "68 4@7D4@68 8 : G? I878@4@474#4B4@ GEFD4 4)ADFG:4 '8F;8D 4@7E @ 4@78D?4@K B4 @"D8 4@7 AD84D8868!G@:4DKL86; *8BG5 6)A 4@7&8J 6A AH4 *8BG5 6 (-* ( &6 @E8K 4@4 KE E 2The US spends 165 to get apoint on PISAmath, about60% more thanthe OECDaverage77745250483040 H8D4:8 8. The National Assessment of Educational Progress (NAEP) is the largest and most consistently administered nationally representative assessment of US students. Headed by theNational Center for Education Statistics in the US Department of Education, these assessments are conducted periodically in a number of subjects for students in grades 4, 8, and 12.NAEP uses criterion-based achievement levels, which are performance standards set based on recommendations from educators and members of the public. Achievement levels include Basic (denotes partial mastery of prerequisite knowledge and skills that are fundamental for proficient work at each grade), Proficient (represents solid academic performance for eachgrade assessed, with students demonstrating competency over challenging subject matter), and Advanced (signifies superior performance). Interpretation of raw scores is based on theunderstanding that ten points is roughly equivalent to one year’s worth of learning. For example, using NAEP’s criteria for achievement levels by grade, the difference between “basic”and “proficient” as a fourth and eighth grader is 48 and 50 points, respectively, in math, and 35 and 43 points, respectively, in reading—meaning that in order to remain at the sameachievement level over four years they must gain an average of about 10 points per grade.
10(NAEP) scores for math and reading across the fourth andeighth grades, for example, 48 percent of blacks and 43percent of Latinos are “below basic,” while only 17 percentof whites are, and this gap exists in every state.8 A morepronounced racial achievement gap exists in most largeurban school districts.Comparing US black and Latino student performance tothe performance of students in other countries adds furtherperspective. 9 In eighth grade math, US Latino studentsperform below students in Malta and Serbia and aboutas well as students in Malaysia; US black students lagbehind Romania and Bulgaria and roughly match studentsin Bosnia and Herzegovina. Similar results are seen for15-year-olds in science, with US Latinos scoring at thelevel of students in Chile and Serbia, and US blacks on parwith students in Mexico and Indonesia. Just as with theinternational achievement gap described above, America’sracial achievement gap worsens the longer children arein school. Between the fourth and twelfth grades, forexample, the gap versus white student math scores grows41 percent for Latinos and 22 percent for blacks.Notably, in some areas, the racial gap has been overcome.For example, Latino students in Ohio outperform whitestudents in 13 other states on the eighth grade NAEPreading test and are seven points ahead of the nationalaverage. In Texas, low-income black students have thesame average score on the fourth grade NAEP as lowincome white students in Alabama.10Interestingly, the size of the racial achievement gap is notcorrelated with overall state performance. Massachusetts,for example, has among the highest overall scores onNAEP, but blacks and Latinos there are eight times morelikely to underperform in fourth grade math than are whites.By comparing several neighboring-state pairs with similardemographics, we can see how dramatic this disconnectcan be between overall achievement and the racial gap.New Hampshire and Connecticut, for example, have similarExhibit 4Neighboring states with similar overall scores can have large achievementgap differences" 2 ,/0 0,/492 7,.6 B34?0 2,; 998D8@68 @ 4H8D4:8 E6AD8E40/ E6A@E @'85D4E 435& @@8EAF4,8@@8EE8830 :990.?4.@?)8@@EK H4@ 4&4EE46;GE8FFE& 6; :4@!, D7,9/" @A E(; A'ADF; 4DA @4& EEAGD AGF; 4DA @4"@7 4@4 '8I 1AD 454?4 AD 74 /4E; @:FA@(D8:A@8AD: 4,8J4E A AD47A 4@E4E"AI4'8H474 8@FG6 K 4E 4 07,B, 0'8I &8J 6A#67,3:8,. D: @ 4*;A78 "E 4@7& EE EE BB 25 6,9 , 4 9AD@ 4%AG E 4@420'8I #8DE8K D LA@4!4I4 15"0B ,8; 34 0/8EF . D: @ 410206208210212214216218220222224226228 (@ K EF4F8E I F; EF4F EF 64 K E :@ 9 64@F 5 46 BABG 4F A@E @6 G787 (-* - ( ' '4F A@4 EE8EE?8@F A9 7G64F A@4 )DA:D8EE ' ) G?4DK 4F4 ,45 8E230232234236238&0,/492 ,.340A0809? H8D4:8 E6AD89. Insufficient data exists today to document gaps related to other underserved communities, such as Native Americans.10. While this research focuses on the achievement gap measured starting in fourth grade there is extensive evidence of the importance of early childhood education in building the necessary cognitive abilitiesbefore kindergarten and how many young children are entering kindergarten unprepared.
McKinsey & Company, Social Sector OfficeThe Economic Impact of the Achievement Gap in America’s Schools11overall fourth grade reading scores; yet the gap betweenwhite and black scores in Connecticut is more than twicewhat it is in New Hampshire. A similar disconnect can befound between Arkansas and Oklahoma, or Marylandand Delaware (Exhibit 4). State variations in the racialachievement gap cannot be explained by the proportionof blacks and Latinos in a state’s educational system,furthermore, although school-level segregation may play arole in influencing outcomes.involved black and Latino students. Moreover, very fewblacks have access to challenging programs like AdvancedPlacement, and those who do have not fared well. Lessthan 4 percent of black students score a 3 or higher onan AP test at some point in high school, compared to 15percent nationwide. This lagging representation among topperformers matters to economic outcomes, because highachievers tend to be those who attend the top colleges andreap the highest earnings over their lives.Just as with the international context, there is a notable gapwithin the overall racial achievement gap having to do withtop performers. We term this gap the “top gap.” Blacks andLatinos are overrepresented among low-scoring studentsand underrepresented at the top. Across reading and math,less than 3 percent of black and Latino children are at theadvanced level; by twelfth grade it is less than 1 percent(Exhibit 5). And despite a modest increase in the proportionof American students at the top level as defined by NAEPover the past 15 years, less than 10 percent of this increaseAs a greater proportion of blacks and Latinos enterthe student population in the United States, the racialachievement gap, if not addressed, will almost certainlyact as a drag on overall US educational and economicperformance in the years ahead. The two most populousstates, California and Texas, are already “minority-majority”states: along with New Mexico and Hawaii, the populationin these states is less than 50 percent European ancestry.The student population of the United States as a whole willreach this status by 2023.11Exhibit 5Few black and Latino students score at the “advanced” level, and thepercentage declines over time" ?0 ? .: 0 ,A0 ,20 1: 0,/492 ,9/ 8,?3 A9 EFG78@FE 4F F;8 47H4@687 8H8 D478 D478 D478 /; F8%4F @A 46 'AF8 "@ EA?8 64E8E F;8 @G?58D A9 5 46 4@7 %4F @A EFG78@FE 4F F;8 P47H4@687R 8H8 I4E EF4F EF 64 K @E :@ 9 64@F (-* - ( ' '4F A@4 EE8EE?8@F A9 7G64F A@4 )DA:D8EE ' ) G?4DK 4F4 ,45 8E11. US Census Bureau, “An Older and More Diverse Nation by Midcentury,” press release (August 14, 2008)
12The income achievement gapstudents eligible for free lunch are six times more likely to bebelow “basic” in fourth grade math than ineligible students.The achievement gap among students of different incomelevels is equally severe. Impoverished students (a grouphere defined as those eligible for federally subsidizedfree lunches) are roughly two years of learning behind theaverage better-off student of the same age. The povertygap appears early and persists over the lifetime of astudent; only 9 percent of freshmen in the nation’s 120 “Tier1” colleges (whose total freshman enrollment is 170,000)are from the bottom half of the income distribution (Exhibit6). At the school-wide level, moreover, schools comprisedmostly of low-income students perform much worse thanschools with fewer low-income students. As with the racialachievement gap, these income gaps remain large evenin otherwise high-performing states. Massachusetts hasamong the highest overall NAEP scores, for example, butSystem-based achievement gapsThe most striking, poorly understood, and ultimatelyhopeful fact about the educational achievement gapsin the United States involves the huge differences inperformance found between school systems, especiallybetween systems serving similar students. This situationis analogous to that found across American healthcare, where, as researchers like John Wennberg haveshown, wide regional variations in costs and utilizationof procedures and services exist that bear no relation toquality or health outcomes. In each case, these differencesprove there are substantial opportunities to improveExhibit 6Income-based gap persists from primary school through collegeFrom primary school to high school ? : ,-:A0 -, 4. :9 " )8D68@F to college ? : ,-:A0 -, 4. :9 " )8D68@F 'AF AI @6A?8'AF AI @6A?8%AI @6A?8 %AI @6A?8 ':.4:0.:9:84. ?,?@ ' ' :1 1 0 3809 49 (40 .:77020 'G?58D 5K CG4DF 8@ Only 9% of freshmenin the top colleges arefrom the bottom halfof the SESdistribution D478 D478 &0,/492D478 !,?3D478 D478 &0,/492 !,?3 4E87 A@ 4H8D4:8 E6AD8E 9AD :DAGBE I;8D8 F8@ BA @FE E DAG:; K 8CG H4 8@F FA A@8 K84D A9 87G64F A@ EFG78@FE 8 : 5 8 9AD 9D88 G@6; 4D8 4DAG@7 FIA K84DE 58; @7 @8 : 5 8 EFG78@FE 8 : @ :D478 ?4F; @ EFG78@FE 8 : 5 8 9AD 9D88 G@6; E6AD87 I; 8 @8 : 5 8 EFG78@FE E6AD87 4 7 998D8@68 A9 %AI @6A?8 E 789 @87 4E 8 : 5 8 9AD 9D88 AD D87G687 G@6; (-* '4F A@4 8@F8D 9AD 7G64F A@ F4F EF 6E 8@F8D 9AD 7G64F A@ )A 6K ' ) 74F4 9AD BG5 6 E6;AA E A 8:8 A4D7
McKinsey & Company, Social Sector OfficeThe Economic Impact of the Achievement Gap in America’s Schools13The interaction of income and racialachievement gapsExhibit AWhile blacks and Latinos are generally much poorer thanwhites in America, it is possible to parse available data todemonstrate the existence of distinct income achievementgaps within racial groups. Poor white students tend towardlower achievement than rich white students. Whites,meanwhile, significantly outperform blacks and Latinos ateach income level. In fact, white students from the secondincome quartile perform about the same as rich blackstudents (Exhibit A). In addition, the strong link revealedin Exhibit B between black child poverty rates and blackachievement levels underscores the income achievement gapamong black students as a phenomenon separate from theracial gap between all black students and all white students.As a result, low-income black students suffer from the largestachievement gap of any cohort. NAEP data suggests thatthe average non-poor white student is about three and ahalf years ahead in learning compared to the average poorblack student; this gap increases to roughly five years whencomparing top-performing New Jersey with low-performingWashington, DC. (Exhibit C).While independent racial and income gaps exist,black and Latino students underperform whitestudents at each income level ' .:294?4A0 ?0 ? 1: ?3 2 ,/0 H8D4:8 E6AD8 Q ?4F; 4@7 D847 @: 6A?BAE F8/; F8 46 ! EB4@ 65754525051494845424745 '4F A@4 H8D4:843%8EE F;4@ Q Q (:?,7 ,99@,7 1,847D 49.:80'AF8 ,;8 % F8EF E EF4@74D7 L87 I F; 4 @4F A@4 ?84@ A9 4@7 EF4@74D7 78H 4F A@ A9 (-* % '4F A@4 8@F8D 9AD 7G64F A@ F4F EF 6E E4?B 8 @6 G78E 5AF; BG5 6 4@7 BD H4F8 E6;AA EExhibit BExhibit CTest scores for black students strongly correlate toblack poverty ratesBy fourth grade, non-poor whites in the highestperforming states are roughly five years aheadof poor blacks in DC" ,/0 8,?3 .: 0 49 ;@-74. .3::7 H8D4:8 E6AD8 9AD :DAGB 5K @6A?8 " 2 ,/0 8,?3 .: 0 G-7,.6 ?@/09? H8D4:8 E6AD8234 /; F8 EFG78@FE&4EE46;GE8FFE'8I #8DE8K232 46 EFG78@FE,8J4E230",?4:9,7 A0 ,20 8 4I4D8228'A@ BAAD I; F8E @ ' # FAB EF4F8 9AD :DAGB . D: @ 4226 AD 74'ADF; 4DA @4"@7 4@4'8I 1AD 224A AD47A&4DK 4@7222220A@@86F 6GF2184 9AD@ 4",?4:9,7 @-74.'8H474 D LA@4& EEAGD 214& 6; :4@,8@@8EE88 454?4212244/; F8 4H8D4:8& @@8EAF4( 4;A?4%AG E 4@4 8@FG6 K" @A E252'A@ BAAD I; F8 4H8D4:8)8@@EK H4@ 4 AGF; 4DA @4/4E; @:FA@8AD: 4216(; A257236)AAD I; F8 4H8D4:8 D 4@E4E& EE EE BB 232'A@ BAAD 5 46 4H8D4:8 222 46 4H8D4:8/ E6A@E @218)AAD 5 46 4H8D4:8210152025303540455055 7,.6 .347/ ;:A0 ?D ,?0 )8D68@F)AAD 5 46 E @ 5AFFA? D8: A@ 9AD :DAGB 206 ;:49? )AAD 789 @87 4E 8 : 5 8 9AD 9D88 AD D87G687 BD 68 G@6;'AF8 A?8 EF4F8E 7 E6 G787 5864GE8 @AF 8@AG:; 5 46 EFG78@FE @ BABG 4F A@ 8 : "74;A (-* - ( ' ' ) G?4DK 4F4 ,45 8E @@ 8 4E8K AG@74F A@ 4@4 KE E A@ EG5E8F A9 EF4F8E &6 @E8K (-* - ( ' '4F A@4 EE8EE?8@F A9 7G64F A@4 )DA:D8EE ' ) G?4DK 4F4 ,45 8E
14productivity and performance via the adoption of bestpractices. While it is less clear how to address the racial andincome-based achievement gaps directly, understandingand acting on the lessons found in these system-basedachievement gaps will be among the most powerful toolsavailable to those who aim to achieve higher and moreequitable educational outcomes.Important performance gaps exist at every level inAmerican education: among states, among districtswithin states, among schools within districts, and amongclassrooms within
The balance of this summary report is organized into three sections. First, the report shares key findings on the international, racial, income, and systems-based gaps facing the United States. Next, the report assesses the economic impact of these gaps for the economy as a whole and for individuals. Finally, the report notes potential