Transcription
AIRLINE ECONOMICANALYSIS2017-2018 EditionAUTHORSTom Stalnaker, PartnerKhalid Usman, Vice PresidentAaron Taylor, Senior ManagerGrant Alport, Engagement Manager
CONTENTSUS CARRIERS INCLUDED AND METHODOLOGY4EXECUTIVE SUMMARY6REVENUE101.Airline Revenue versus GDP102.Airline Operating Revenue123.Revenue Driver: Capacity (Impact Rank 1)184.Revenue Driver: Passenger Yield (Impact Rank 2)215.Revenue Driver: Load Factor (Impact Rank 3)256.Revenue Driver: Ancillary Revenue and Other (Impact Rank 4)287.Revenue Driver: Cargo (Impact Rank 5)308.Unit Revenue Comparison31COST349.34Increase in Airline Costs10. Cost Driver: Labor3711. Cost Driver: Fuel3812. Other Cost Drivers3813. Unit Cost Trend and Gap3914. Domestic Airline Cost Performance41
PROFIT4615. Sustained Profitability4616. Unit Results48WORLD CAPACITY TRENDS5317. Worldwide Trends5318. Asia/Oceania Growth Trends5619. North America Growth Trends5920. Europe Growth Trends6221. Africa/Middle East Growth Trends6422. Latin America Growth Trends66WORLD HOT TOPICS6923. Brexit6924. Breaking the Business Cycle7125. Long-Haul, Low-Cost73
US CARRIERS INCLUDEDAND METHODOLOGYAll United States value carriers and network carriers are included in this analysis.1Our set of value carriers westSpiritOur set of network carriers:6. Alaska/Virgin America7. American8. Delta9. Hawaiian10. UnitedWe have divided airlines into two broad groups – network carriers and value carriers –recognizing that each group includes airlines with a range of business models. Over the pastseveral years, the ability to divide US airlines into two categories has become increasinglydifficult. The lines that once divided US carriers are blurring because of structural changeswithin both groups.Differences in unit revenue on domestic segments again narrowed during 2017 betweenthe two groups, while differences in unit cost on domestic segments remained near recentlows. Value carriers continue to add international service, especially to Latin America and theCaribbean, as they expand and diversify their service to compete against network and valuecounterparts with a shorter haul, near-international value proposition.The convergence of financial and operational differences will eventually force the industryto redefine air carrier groupings. An argument could be made that the industry is movingtowards a three-way split among airlines today: ultra low-cost (Spirit, Allegiant, andFrontier); traditional network (Delta, American, and United); and a third group that straddlesthe other two (Southwest, Alaska/Virgin America, JetBlue, and Hawaiian). However, webelieve our traditional groupings remain valid for the current analysis.1 The primary category excluded is regional carriers, which provide most of their capacity under capacity purchase agreements (CPAs).Regional carriers operated about 12 percent of domestic available seat miles (ASMs) in 2017 and have different expense paymentarrangements in the CPAs with their mainline partners. The number of expense categories paid directly by mainlines and not appearingin the regional carriers’ costs has increased over time. Fuel and aircraft ownership were among the first to be directly paid in some CPAs;more recently some mainlines have taken over payment for ground handling and engine maintenance. As a result, comparing totalCASM across regional carriers and aircraft may be misleading.Copyright 2018 Oliver Wyman4
The report has combined data for merged airlines including American/US Airways,Southwest/AirTran, Delta/Northwest, and United/Continental. This year, our reportcombines data for the merged Alaska/Virgin America airline. This report focuses largely onUS carriers based on the reported regulatory data available. In the World Capacity section,we have provided expanded sections by geographic region.A substantial part of our financial analysis is based on US Department of TransportationForm 41 data. This data includes transport-related revenue/expense. The transport categorymainly comprises revenue and expense attributable to regional partner operations andcodeshares. This report attempts to closely compare the operating airlines in the UnitedStates and, therefore, excludes transport-related categories from the revenue and costsections. However, recognizing that a substantial portion of network carriers’ businessdesign is based on regional partner feed and codeshare participation, the Profit section ofthis report includes the Form 41 Transports category.Throughout the report, we refer to the non-standard terms RASMxT and CASMxT. The “xT”portion of the term indicates that we have eliminated the transport-related revenue orexpense referenced above.Lastly, totals between charts and text throughout the report may have slight variances dueto rounding.Copyright 2018 Oliver Wyman5
EXECUTIVE SUMMARYAfter 17 straight profitable quarters, airlines based in the United States can be expectedto keep the winning streak going in 2018 and beyond. Even as the industry’s two largestoperating costs – fuel and labor – edge up, a combination of persistent demand for air travelthat’s outpacing the overall economic growth and newfound discipline on adding capacity iskeeping network and value carriers in the black.A return to growth in passenger yield – the measure of the average fare paid per mileper passenger – is an example of the industry’s enduring strength. After years in decline,year-over-year yield rose 2.3 percent in second quarter 2017, driven primarily by networkcarriers’ capacity restraint. Passenger yield fell 13.4 percent from 2014 through 2016, hittinga year-over-year quarterly low in third quarter 2016 of 13.4 cents. The systemwide yield bysecond quarter 2017 was 13.9 cents.In fact, in 2017 yield became the second biggest contributor, after new capacity, to revenuegains for US airlines – particularly for the network carriers’ domestic operations. For thoseplayers, the key to staying profitable has been resisting competitive pressures to addcapacity. While many value airlines still make their money and gain market share by addingroutes and expanding available seat miles (ASM), their network rivals have learned thatfollowing them down that path leads to lower unit revenue.As a result, a cultural gap has developed between network airlines and some of the moreaggressive value players, based on the strikingly different ways the two operate and yetremain profitable in the face of rising operating costs. Straddling that great divide arecarriers like Southwest and JetBlue, which judiciously add capacity while keeping an eagleeye on yield.Higher yield contributed 760 million of the total 2.4 billion in new revenue enjoyed bynetwork and value airlines in second quarter 2017, based on Oliver Wyman calculations.Network carriers increased revenue based on yield by 634 million; value airlines, on theother hand, added only 126 million because of higher yield.Of course, the biggest contributor to second quarter 2017’s new revenue was addedcapacity, the name of the game for most US value carriers. By increasing their numbers ofseats and routes, the value players grew revenue by 531 million, or close to 7 of every 10 of their total 736 million revenue gain. Network airlines added 609 million, or53 percent of their 1.15 billion above-the-line growth. The other major contributors wereload factor, fees, and cargo.Copyright 2018 Oliver Wyman6
Both value and network carriers remained profitable in 2017, with value airlines achievingoperating margins that exceeded 20 percent in the second quarter. But there’s no doubt thatrising costs from higher fuel prices and new labor contracts are slowing the momentum.Reversing a multiyear trend of decline, unit costs rose 5.4 percent in second quarter2017 – 6.1 percent for network players and 4.5 percent for the value contingent.Even so, the recent resilience of US airlines is an impressive reversal of fortune after theircumulative performance from 2000 through 2014, when they lost 29 billion. While profitsdeclined somewhat in 2016 and 2017, it was only in comparison with 2015, the mostprofitable year in the industry’s history.One key strategy for network carriers: collectively keeping total capacity growth fordomestic and international routes at or below the expansion rate for gross domestic product(GDP) in the United States – despite the fact that demand for air travel has been increasingfaster than GDP at home and around the world.In second quarter 2017, US GDP grew 3.1 percent, while network domestic capacityexpanded 2.4 percent year-over-year, and international capacity, three percent. Delta, forinstance, increased domestic ASMs only 0.7 percent and reduced international capacity.The decision to limit capacity meant that passenger yield rose, particularly for domestictravel, where the most capacity restraint was demonstrated. The airlines’ ability to increaseyield could help offset rising costs in the future.Value carriers also profited from higher yield internationally, despite decisions to expandcapacity, particularly in Caribbean and Latin American regions. In the year-over-year secondquarter revenue gain, value players added 96 million based on yield – almost five timeswhat network carriers achieved and three times what capacity growth contributed.Overall, the quarterly year-over-year growth in capacity by US network and value carriersamounted to the largest since the 2007-2009 worldwide economic recession. In secondquarter 2017, value airlines expanded domestic ASMs by 7.2 percent – more than doublequarterly GDP growth – and by nine percent internationally, again higher than economicexpansion in most regions.The international capacity expansions are being done in response to pent-up demand for airtravel, particularly in emerging markets like China. Worldwide, airlines added 7.3 percentmore ASMs in 2017, again marking the largest percentage increase since the economicdownturn. The growth equates to 1.7 million more departures per year.Copyright 2018 Oliver Wyman7
The real growth story for the industry has been and continues in Asia, and in particularChina. Asia, excluding China, significantly exceeded worldwide growth rates, adding closeto 72 percent more ASMs since 2008. China, where demand for air travel is expected togrow 8.3 percent in 2018, the number of ASMs has jumped close to 153 percent since 2008,a compound annual growth rate (CAGR) of 10 percent. That compares with a CAGR of5.8 percent for the rest of Asia and five percent globally.Consequently, as we saw in Oliver Wyman’s Fleet Forecast for 2017-2027, much of theexpansion in the global fleet is slated to occur in Asia. Other forecasted fast-growth areasaround the globe include Latin America and Eastern Europe.Even Brexit – the United Kingdom’s upcoming exit from the European Union – hasn’t seemedto deter the desire to travel so far. A comparison of the period leading up to and followingthe Brexit vote shows that the rolling 12-month total of passengers moving between theUK and the rest of the EU increased 34.6 percent since 2014. While some of this may beattributable to the decline in the value of the pound sterling, which made travel withinBritain cheaper, the rest of the activity may reflect an attempt to take advantage of the lastdays when the EU and UK are under the same economic umbrella. From 2014 up to the June23, 2016 referendum, passengers between the UK and the EU increased 18.9 percent, or anaverage of 0.6 percent per month. Since the vote, the number of passengers has increasedan additional 13.1 percent, or an average of 1.1 percent per month through October 2017.The bottom line: The global outlook for air travel appears healthy, thanks to persistentdemand, particularly in emerging markets. In the United States, the future looks moreclosely tied to the ability of the larger carriers to contain capacity growth.Ultimately, the strategies for success vary substantially by region and type of carrier. Forinstance, it’s hard to gauge the fundamental strength of the US value carriers, especially theultra low-cost ones, by the same metrics as their network counterparts or even larger valueplayers like JetBlue and Southwest. While network and value airlines owe their success tothe same set of factors – capacity, yield, load factor, ancillary fees, and cargo – the role eachelement plays differs dramatically across the industry, requiring airline executives to followdifferent strategies and priorities, depending on their airline and the region they serve.Copyright 2018 Oliver Wyman8
REVENUE
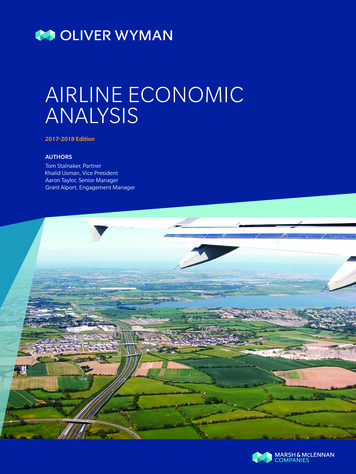
REVENUE1. AIRLINE REVENUE VERSUS GDPDriven largely by declining passenger yields, US airline revenue began to flatten andeventually decline beginning in mid-2014. The decline in passenger yield was partiallyprecipitated by capacity increases, increased competition, and rapidly falling fuel costs.Lower fuel costs helped airlines maintain record profitability. The falloff in revenue became aconcern in 2016, as the fuel market appeared to reach a floor and prices began to inch up.Fortunately, by the first half of 2017, the industry was able to stop the decline and produce asmall increase. Exhibit 1 depicts the relationship of US airline revenue to US gross domesticproduct (GDP). While airline revenue has been significantly less stable than US GDP over thepast 15 years, it has managed to outpace it. Since 2003, US airline revenue has increased ata CAGR of 4.6 percent versus 3.8 percent for GDP.Exhibit 1: US Airline Revenue and GDP, Q1 2003-Q2 2017US AIRLINE REVENUEBILLIONS (DOLLARS)250GDP (CURRENT)BILLIONS (DOLLARS)25,000Slight recovery20020,000Linear (US airline revenue)15015,00010010,000Linear (US GDP)505,00000US GDPUSairlinerevenue2003 2004 2005 2006 2007 2008 2009 2010 2011 2012 2013 2014 2015 2016 2017Source: Planestats.com Form 41 Financials P 1.2 Income StatementBeginning in mid-2014, airline revenue growth slo
REVENUE 10 1. Airline Revenue versus GDP 10 2. Airline Operating Revenue 12 3. Revenue Driver: Capacity (Impact Rank 1) 18 4. Revenue Driver: Passenger Yield (Impact Rank 2) 21 5. Revenue Driver: Load Factor (Impact Rank 3) 25 6. Revenue Driver: Ancillary Revenue and Other (Impact Rank 4) 28 7. Revenue Driver: Cargo (Impact Rank 5) 30 8. Unit Revenue Comparison 31