Transcription
elINTEGRATIVE CASE FRED'S TRAIN SHOPPaul Stone shows Fred the set of REA diagrams that he has developed to model t;;business activities for the revenue, expenditure, and payroll cycles ofFred's TrainShop.Fred verifies that Paul has correctly represented his company's business processes. Hethen says that although the diagrams "look nice," he wondered why Paul has spent somuch time developing them, instead of building Fred the database he had promised.Paul responds that the time spent up front in thoroughly understanding Fred's TrainShop's business processes is necessary to properly design a database thatwill satisfyFred's needs.Paul asks Fred whether he has a database program. Fred replies that a relationaldatabase was part of the "business applications" he had purchased as part of an officeproductivity package. Fred says that although he knows how to use the program, hehas not been able to figure out how to import data to it from his AIS and store it in amanner that will allow him to analyze his store's business activities. Paul says thatthewill doI.so byfollowinB these steps:First, he will integrate the separate REA diagrams he has develgped into asingle, comprehensive enterprise-wide data model.544
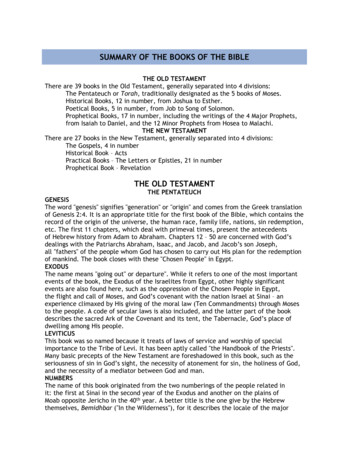
2. Second, he will use the integrated data model to design a set of relationaldat 4base tables.f:he will show Fred how he can query the resulting database to generateboth traditional financial statements as well as any custom performance reports.lhird,lhtroductionThe previous chapter introduced the topic of REA data modeling and explained how to developREA diagrams for an individual business cycle. This chapter shows how to implemelt an REAdiagram in a datlbase. We focus on relational databases because they are commonly used to suppo transaction processing systems and are likely to be familiar to most business students.Nevertheless, REA data modeling is not limited for use only in designing relational databases,but can also be used to design object- oriented databases.We begin by showing how to integrate separate REA diagrams developed for individualbusiness cycles into a single, comprehensive enterprise-wide data model. Next, we explain howto implement the resulting model in a relational database. We then describe how to use the REAdiagram to query the database to produce traditional financial statements as well as a variey ofmanagement reports.lnteErating REA Diagrams Across CyclesFigures l8-1 ,18-2, and 18-3 present REA diagrams ofFred's Train Shop's revenue, expenditure,and payroll cycles, respectively. These separate diagrams should be integmted to provide a singlecomprehensiye enterprise-wide model of thelrganization. Doing so requires undeNtanding whatthe cardinalities in each separate diagram reveal about the organization's business policies andactivities. Figure i8-l and Figure 18-2 were explained in Chapter 17, so we focus here onFigure 18-3.Figure 18-3 depicts the payroll portion of Fred's Train Shop's HR/payroll cycle activities.The basic economic exchange involves acquiring the use of each employee's time and skills inexchange for which the employee receives a paycheck. Like many small businesses, Fred's TrainShop uses an electronic time clock to record the hours worked by each employee each day. Thus,each Time Worked event records the time an employee began and ended working on a specificday. Each such event must be linked to a particular employee and his or her supervisor; eachemployee or supervisor, however, may be linked to many different events. Similarly, a paycheck545
PARTIV.THE REA DATA MODELFIGURE 18.1Fred's Train ShopRevenue CycleFIGURE 18.2Fred's Train ShopExpenditure CycleOr oshIDisbr.rrseCoshEmployee{Coshier)3is issued to a particular employee and signed by a particular cashier, but each employee andcashier may be associated with many different Disburse Cash events over time, Hence, Figure 18-3 depicts the relationships between agents and events as being 1:N. The minimum cardinality on the agent side of those relationships is always l, because each event zrst hrU linked to aspecific employee. @or example, Fred would not want to issue a paycheck and leave the payee
CHAPTER '18.IMPLEMENTING AN REA MODEL lNA RELATIONAL DATABASEFIGURE 1A-3Fred's Train ShopPayroll gyclelname blank.) The minimum cardinality on the eyent side of dre relationships is always 0 in orderto accommodate storing data about new employees prior to their beginning work and because theevent entities arqempty at the beginning of each new fiscal year.The relatioirship between ttle Time Worked and Disburse Cash events reflects the basic economic exchange of getting the use of an employee's time and paying for it. Figure 18-3 showsthat the relationship between tlese two events is 1:N. This is because Fred's Train Shop, likemost businesses, pays employees periodically but records their time worked daily. Thus, eachDisburse Cash event is linked to many daily Time Worked eYents. Like most businesses,however, Fred's Train Shop does not divide one day into two different pay periods, nor does itpay employees in installrnents; thus, each Time Worked event is linked to only 1 Disburse Cashevent. The minimum cardinalities on each side of the relatiomhip reflect the normal businesspractice ofpaying employees after they have worked, rather than in advance.The Employee Time entity requires some explanation. It rcpresents the fact that the resourcebeing acquired by the Time Worked vent is the use of an employee's skills and knowledge for aparticular period of time. Time, however, is different from inventory cash, and other tangibleresources, as \rell as from intangible resources like trade secrets or other forms of intellectualproperty, in that it cannot be stored. In addition, there are only a few relevant attributes aboutemployee time: the hours worked and how that time was used. Every organization needs to monitor how much time each employee works, in order to calculate palroll. The Time Worked event,which is an example of a "Get" resource event, serves this purpose. Chapter 19 will discuss howsome organizations, such as manufacturers and professional services firms (e.g., law firms, consulting organizations, and accounting firms) also collect detailed records of how employees usetheir time, which is an example of a "Give" resource eYent, in order to Properly bill clients forthose services. These two events (Time Worked and Time Used) capture all of the informationabout employee time that is practical to collect and monitor. Consequendy, the Employee Timeresource entity is almost never implemented in an actual database. Therefore, it is depicted withdotted lines in Figure l8-3.Finally, the cardinalities of the relationship between the cash disbursement event and thecash resource are identical to those itr the expenditure cycle (Figure 18-2): Each check or electronic funds kansfer must be linked to at least one cash account and can be linked to only onecash account, whereas the same cash account may be linked to many disbursement events.547
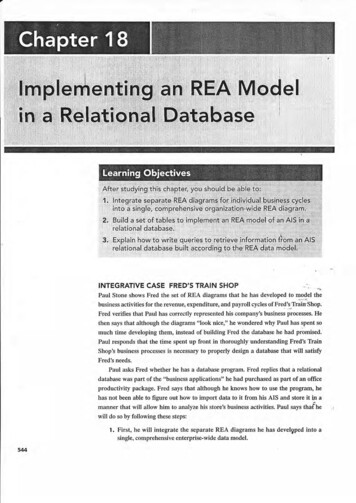
5rt8PARTIV.THE REA DATA MODELNow that we understand the business policies underlying Figures 18-1, 18-2, and 18-3 wecan proceed to merge them into one integrated REA diagram.Rulesfor Combinlng RHA DiagYou have probably noticed that Figures 18-1, 18-2, and 18-3 e{ch contain some ofthe same entities.For example, the inventory resource appears in both Figures 18-1 and l8-2. The cash disbursementsevent appears in both Figures 18-2 and 18-3. Both the employee agent and the cash resoruce appearin all three diagrarns. Such redundancies provide the basis for combining REA diagrams depictingindividual business cycles into a single, comprehensive, enterprise-wide REA model. Figure 18-4shows such a model for Fred's Train Shop. Notice that the integrated diagram merges multiplecopies of resource and event entities but retains multiple copies of agent entities. This maximizes thelegibility of the comprehensive REA diagram by avoiding the need to have relationship lfrres crossone another. I-et us now exami[le how to combine redundant resouce and event entities.Merging Redundant Resouree EntitiesRecall that REA diagrams for individual business cycles are built around basic give-to-get economic excharges. Such economic duality relationships explain why a resource is either acquiredFIGURE 18.4lntegrated REA Diagram for Fred's Train Shop
CHAPTER,I8.IMPLEMENTING AN REA MODEL INor disposelof. Tbey provide only a part of the story about each resource, however. Forexample,trgure 18-l shows that inventory is reduced (the Sales event) in exchange for cashReceivelthecash event). But Figure 18-1 does not show how that inyentory was initially acquired. Nor doesit show llow the organization uses the cas[ it receives from customers. Conversely, Figure 1g 2s[ws h6w inventory was acquired (tbe Receive Invenrory event) bf giving up cash (tire DisburseCf,"h event). Yet, Figure 18-2 does nor show whar the organizati{n does with the inyentory orhow it acquired the cash used ro pay suppliers.IThup' REA diagrams for individual business cycles provide only partial information aboutthe resobrces conholled by an organization. The complete picture would show how eachresource'is acquired and how it is used. As shown in Figure 18-4, this can be done by redrawingan REA diagram to place common resources between the events that affect them. Doing soreflects another important duality that must be depicted in a complete REA model of any organization: Every resource must be connected to at least olle eyent that increases that resource and toat least olle event that decreases it.Merging Redundant Event EntitiesREA diagrams for individual business cycles may include some events that also appear in the REAdiagrams ofanothq cycle. For example, Figures 18-2 and 18-3 both contain the Disburse Cashevent r-qqty. As was the case with resources, merging these multiple occu[ences of the sameeyent improyes the legibility of the resulting comprehensive REA diagram. Thus, Figure 1g-4s lows Ihat the Disburse Cash eyent is linked to both the Receive Inventory and the Time Workedevents.Close examination ofFigure 18-4 reveals an important difference, however, between mergredundant eventS and merging redundant resources: Merging redundant resources does notalfect any cardinalities, but merging redundant events alters the minimum cardinalities associated with the other events that are related to the merged eyent. Thus, in Figure 18-4 the cardinalities between the inventory resource and each of the four events to which it is related are the sameas those depicted in Figures 18-l and 18-2, In contast, the cardinalities between the DisburseCash event and the other evenrs with which it is linked are different in Figure l8-4 than inFigures 18-2 and 18-3.The reason for this difference lies in the underlying semantics about the nature of the relationship bbtween the merged entity and other entities. An instance of a resource entity can, andusually is, linked to multiple events. For example, a given inventory item carded by Fred's TrainShop can be linled not only to a Receive Inventory event, when it is acquired from a supplier, butalso to a Sales eyent, when it is sold to a customer. In other words, the resource entity is linked toevent entities i[ one business cycle alxd to event entities in the other cycle. Because both links arepossible, none of the cardinalities in the individual REA diagrams needs to change.The situation is different when merging an eyent across business cycles. The evelt thatappears in both individual business cycle REA diagrams may belinked, to either all event that ispart of oqe business cycle or to an event that is part of another cycle bltt cannot be linked to botheyents. For example, in Figure 18-4, a particular Disburse Cash eyent (i.e., a particular check orEFI transactiol) could be associated with a pdor receipt of inventory from a supplier or withtime worked by an employee, but the same check (or EFf transaction) cannot be lsed both topay a supplier for receipt of inventory azd to pay an employee for working the previous week.Consequently, the minimum cardinality associated with the other events ,rs, be O in the integrated REA diagram, regardless of what it was in each of the individual tansaction cycle REAdiagrams. To understand why, recall that a minimum of 1 means that each instance of that entityhas to be associated with at least one instance of the other entity. In terms ofcash disbursementsin Figure 18-4, retaining the minimum I with the Time Worked eyent, for example, would meanthat every cash disbursement must be linked to a time card transaction-which is clearly not true,because Fred may make a cash disbursement to pay a supplier. For similar reasons, the minimumcardinality from the Disburse Cash event to the Receive Inventory event must also be 0.Merging two transaction cycles on a common event may also affect the minimum cardinalities between the merged event and the agents participating in that event. For example, in Figure18-4 the minimum cardinality between the Disburse Cash event and the Supplier entity is now 0,instead of 1, as it was in Figure 18-2. The reason is that a given check (cash disbursement) may-in!A RELATIONAL DATABASE
550PARTIV.THE REA DATA MODELbewritten eirrer toasupplier as payee or to an employee as payee. but the same ch eck cannot bewdtten to both age\ts simultaneously. That is why the minimum cardinality between theDisburse Cash event and the Emplo3ee (payee) agent is also 0. Thus, whenever a merged eventinlolves different agents in each of the individual businesslcycles being merged, the minimumcardinalities betrreeu that event and those agents change f the usual 1 to 0. because the eventmay now be linked to either o[ rhe two types of agents, but hot both.llVilidating the AccuraGy of lntegratedREA DiagramsChapter 17 presented thrce basic principles for drawing REA diagrams for individual businesscycles; the preceding discussion for combining such diagrams into a single, enterprise-widemodel adds two more rules. Thus, a correcfly &awn, integrated REA diagmm must satisfy esefive rules:1, Eyery event must be linked to at least one resource.2. Every event must be linked to two agents who pafiicipate in that event.3. Every eyent that involves the disposition of a resoutce must be linked to an eYent thatinvolves the acquisition of a resource, (This reflects the cconomic duality underlying "giveto-get" economic exchanges.)4. Every resource must be linked to at least one eyent that incrcments that resource and to atleast one event that decrements that resource.5. If event A can be linted to more than one other event, but cannot be linked simultaneouslyto all of those other events, then the REA diagram should show that event A is linked to aminimum of 0 of each of those other events.Notice that these fiye rules can be used not only to develop an integmted REA diagram butalso as "check figures" to validate the accuracy of a completed REA diagram. Technically,Figure 18-4 is not complete because rule 4 is not satisfied for the Emptoyee Time resource. Wewill corect this shortcoming in Chapter 19. For now, let us ignorc it and procedd to the next stepin the database design process: implementation of an REA data model in a relational database.lmplementing an REA Diagramin a Relational DatabaseOnce an REA diagram has been developed, it can be used to design a well-structued relationaldatabase. In fact, creating a set of table; from an REA diagram automatically res-ii'lts in a wellstructured relational database that is not subject to the update, insen, and delete anomaly problems discussed in Chapter 4.There are thrce steps to implementing an REA diagram in a relational database:a table for each distinct efiity in the diagram and for each many-to-many relationship.2. Assign atftibutes to appropriate tables.3. Use foreign keys to implement one-to-one and one-to-many relationships.1. CreateRecall that even though REA diagmms for differcnt organizations may include the same entities, differences in business policies are likely and will result in differences in relationship cardinalities. For example, the REA diagram for one organization may show a l: I rclationship betweenthe Sales and Receive Cash events, whereas the REA diagram for another organization may modelthat same pair of events as being involved in a M:N relationship. Thus, the design of a datahase(number of tables, placement of attributes) is specific to the or anization being modeled'Step 1: Create Tables for Each Distinct Entity and M:N RelationshipA properly designed relational database has a table for each distinct entity and fol esh many-tomany relationship in an REA diagram. Figure 18-4 has 13 distinct entities, but as previously discussed, one, Employee Time,willnot be implemented in the database. The remaining 12 distinct
CHAPTER18.IMPLEMENTING AN REA MODEL IN A RETAT,ONALDATABASE 55,entities thatFre depicted in Figure 18-4 need to be implemented as tables in a relational database.Seven tables will represent the eyent entities in the diagram: Order Inventory Receive InyentoryDisburse Cash, Time Worked, Take Customer Ordel Sales, and Receive Cash. There are twotables for resource entities: Inventory and Cash. Tbrce tables are needed to implement theldistinlt agent entities: Employees, Customers, and Sirpptiers (supervisors are labeled separateiy tom e the diagram easier to read, but are lhemselvss employees).Figure t 8-4 also depicts five M:N relationsilips. Three are from the revenue cycle: fakeCustomer Orders-Inventory, Sales-Inventory arfd Sales-Receive Cash. Ttvo others are ftomthe expenditure cycle: Inventory-Order Invenrory and hventory-Receive tnventory. Therefore.the 17 tables listed in Table 18-1 must be creat d to accurately implement Figure 18-4 in aTABLE 18-1 Table Names and Attribute Placement for Figure 18-4Attributes,TABLESPrimary KeyForeign KeysOther Attributesorder InventoryPurchase order numberSupplier number, employee numberDate, time, rcasonReceive InventoryReceiving report numberSupplier number, employee lurnber,purchase order numbet checknumberDate, time, rcmarks, vendor invoice lumberDisbuNe CashCheck numberSupplier number, employee numbei(payee), employee number (signer),account numberAmount, descriptioD, dateTake Customer OrderSales order numberCustomer flumber, employeeDate, time, special remarksnumberInvoice numberCustomer number, employeenumber. sales order numberDate, time, invoice sent (Y/N)Remittance numberCustomer number, employeenumber, account numberDate, time, method ofpaymentTime WorkedTimecard numberEmployee number, superyisornumbe( paycheck numberDate, time in, time outInventoryProduct lrumberDescription, list price, sEndard cost, beginningquantity-on-hand, beginning quantity-available,reorder quafltity, rcorder poi,tCashAccount numberBeginring-balance, type of accountEmployeesEmployee numberName, date hired, date of birth, pay rate,jobSalesReceive Cash\tideCustomersCustomer numbe!Name, addressa, beginning account balance,credit tory-lnventoryTake CustomerOrder-InventorySales-InventorySupplier numberName, adfuessa, beginning account balance,performance ralingPuchase order number,product numberQuantity odered, actual lrnit costReceiving report number,prcduct numberQuantity received, conditionSales order number,product numberQuantiqy orde.edInvoice number, prcductnumberQuantity sold, actual sale priceSales-ReceiveCash InvoiceDumber,Amount applied to invoicercmittance numberaAcoally, only the street ad&ess and zip code would be stored in these tables. In both tables Zip code would beprimary key ofan "address Hble. which ould also includechy aid srate as o er altdbures.aforeigt key. Zip code would alsobe the
552PARTIV.THE REA DATA MODELrel
5rt8 PART IV .THE REA DATA MODEL Now that we understand the business policies underlying Figures 18-1, can proceed to merge them into one integrated REA diagram. 18-2, and 18-3 we Rules for Combinlng RHA Diag You have probably noticed that Figures 18-1, 18-2, and 18-3 e{ch contain some ofthe same entities. For example, the