Transcription
The REA Data ModelChapter 17Database Design Using the READata ModelChapter 1 8lmplementing an REA Modelin a Relational DatabaseChapter 19 Special Topics in REA Modeling511
UsingdelINTEGRATIVE CASE FRED'5 TRAIN SHOPFred Smith is frustrated. Business in his model train shop is booming. But the simpleaccounting software that he uses to run the business has only limited reportingcapabilities. Consequently, he often has to manually reYiew transaction data to preparecustom reports. The process is time-consuming and prone to error. For example, Fredspent the past weekend poring over sales records for the prior three months to try toidentify which combinations of items were most frequently purchased together' Heplans to use the information to offer a special sales promotion but is concerned aboutthe quality of his analysis.At lunch, Fred explains his frustrations to his CPA, Paul Stone. Paul mentions thathe has just completed a training course on database design. He suggests that he couldcreate a relational database for Fred that would interface with his accounting softwareand that would provide Fred with the ability to easily design reports to analyzer.hisbusiness. Fred likes the idea and hires Paul to design a relational database for histrain store.s12
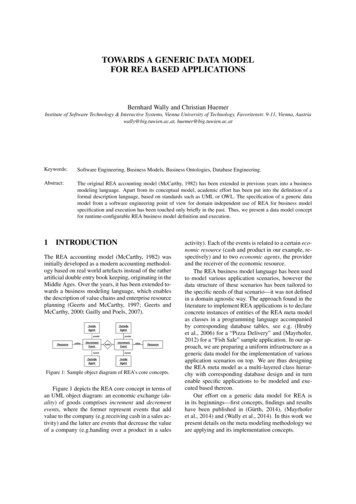
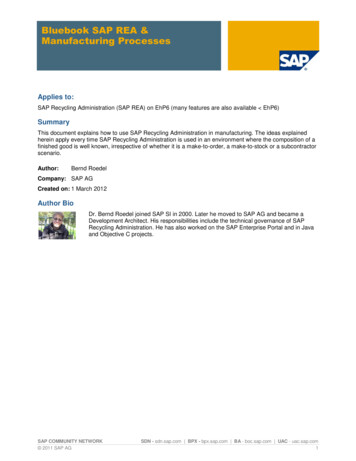
lntroductionchapters in thisChapter 4covered the fundamental principles of rclational databases The ntandsecti on will teach you how to chthattherewillseefrationxystem. You(DBMS) Building accuratethe syntax of how to use a particular database management systemyou even sit down at thedatabases requires a.great deal of carefut planning and desigt beforecomputerthatchapter introduces the topic of data modeling, one aspect of database desigotheREAand(E-R)diagramsaccountants should understand. We discuss entity-relationshipmodel of an AIS' Thenaccounting model and demonstrate how to use these tools to build a dataabout anofdocumentationasourcewe discus's howpuch REA models can also serve asimplementtohowexplainwill18organizatiol's business activities and policies. Chapterretuieve informationan-REA data model in a database and how to query the resulting database to19 concludesChapteractivitiesbusinessto effectiYely manage an organization'sthisneededthis three-chapter seition by examining a number of advanced data modeling and databasedesign issues.Design ProcessDatabase.:.::.:.:::conshows the five basic steps in database design. The fiIst stage (systems analysis)Thissystemanew,iri, ofir]itiuf pfunning to determine the need for and feasibility of developingfeasibileconomicandstage includes preliminary judgments about the proposal's technologicalItyIIt utro in otr", identifying user information needs, defining the scope of the proposed newFieurel7-lvolumes tosistem, and using information about the expected number of users and fransactionstage (conTheseconddecisions about hardware and software requirements'make preliminarfconceptual'ceptual design) includes developing the different schemas for the new system at )uniirt"-nl levels. Thi third hatlevel schema into the actual database oped.is also the stage when new applicationssystems toconversion) includes all the actiYities associated with transferring data from existingit'The finaltousehowemployeesandtrainingnewsystem,the new database AIS, testing thenewstage is using and maintainingforiran"" und user satisfaction to determine the need for making system enhancements anddevelmodihcations. Eventually, changes in business stmtegies and practices or signiltcant newthe hnoLgyininformationopments513
514PARTlV.THE REA DATA MODELFIGURE 17-IData Modeling in theDatabase Desion ProcessDoto ModelUsed Hereof developilga new system, and the entire process sta.rts again (note thearro* retuming to thesystems analysis stage).Accountants can and should pa icipate in every stage of the database desigu process,although the level of their inyolvement is likely to vary across stages. Durilg the systems analysis phase, accountants help evaluate project feasibility and identify user infomation needs In theconceptual design stage, accountants participate in deyeloping the logical schemas, designing thedata dictionary, and specifying important controls. Accountants with good database skills maydirectly participate in implementing the data model during the physical design stage. Durillg the,implementation and conversion stage, accountants should be involved in testing the accuracy ofthe new database and the application progmms that will use that data, as well as asses ing theadequacy of controls. Finally, many accountants arc regular users of the organiz4tign's daiabaseand sometimes even have responsibility for its management.Accountants may proyide the greatest yalue to their organizations by taking responsibility fordata modeling. Dard modeling is the process of defining a database so that it faithfully representsall aspects of the organization, including its interactions with the extemal enyironment. As shownin Figure 17-1, data modeling occurs during both the systems analysis and conceptual designstages of database design. Next, we discuss two impo ant tools that accountants can use toperform data modeling: entity-relationship diagramming and the REA data model.RelationshipAtentitt-relationship @-R) iliagram is a graphical technique for portraying a darab&eschema. It is called an E-R diagram because it shows the various enririeJ being modeled and theimportant relationshrps among them. An entit! is anythirrg about which the organization wantsrThe materialin this section is based on P Chen, "The Enrity Retationship Modet-Toward a Unified ViJw of Data,,,Transactions on Database S}Jrel,,s (March 1976, l:l): 9-36.
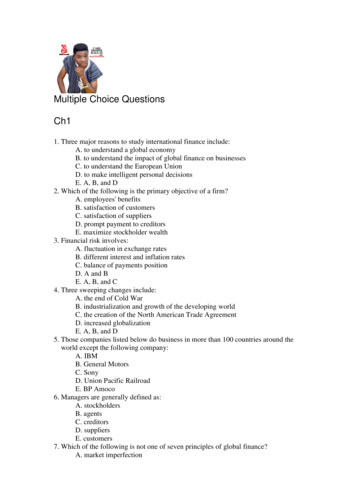
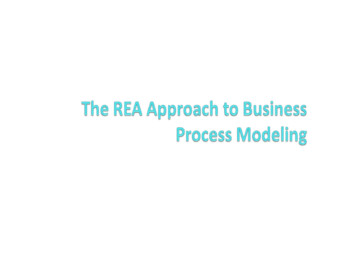
'CHAPT R 17.oATABAS OESGN USNG rsE R A oATAMoorLto collect and store information. For example, Fred's Train Shop's database would includeentities for employees, customers, suppliers, inventory and for business events such as sales tocustomers and deliveries from suppliers. In a relational database, separate tables would be created to store informati]on about each distinct entity; in an object-odented database, separatecla-sses would be creatdd for each distinct entity.i In an E-Rentities arc depicted as rectangles. Unfortunately, however, there are nocts of E-R diagrams. Some (ata modelers and authors useindustry standards for]other aspects(Figure 17-2, panel A) where[s others do not (Yrgure 17-2,diamonds to depictpanel B). Sometimes (he attributes associated with each entiti are depicted as named ovals(Figure 17-2, panel C), whereas othef times the attributes associatedconnected to eachwith each entity are listed in a separate table (Figure 17 -2, panel D). In this book, we will becreating E-R diagrams with a large number of entities and relationships, Therefore, to reduceclutter and improve readability, we omit the diamonds for relationships and list the attributesassociated with each entity in a separate table. Thus, our diagrams look like panels B and D inFig:re11-2-E-[diagrams can be used to represent the contents of any kind of database. For example,the E-R diagram of aII intramural sports database might include students, teams, and leaguesas entities, whereas an E-R diagram for a school might include students, teachers, and coursesas entities. Iq"this book, our focus is on databases designed to support an organization's business aj?tivities. Consequently, we will show how E-R diagrams can be used not only to designdatabases but also to document and understand existing databases and to redesign businessD{ocesses. Business process management is covered in Part V; in this chapter we focus onusintE-R diagrams for database design and for understanding the contents of existingdatabases.' As noted, E-R'diagrams can include many diff'erent kinds of entities and relationshipsamong those entities. An important step in database design, therefore, entails deciding whichentities need to be modeled. The REA data model is useful for making that decision.FlGURE 17.2E-R Diagram VariatiPonel A: Relotionrhips depicted by diomondsPqnel B: Relotionships depicted withoul diomondsPonel C:Atlibufer otto(hed to entitiesPqnel D: Attributes listed inEnlity NomeAttribuiesSaleslnvoice number, date, amounilnventoryItem number, description, list price115
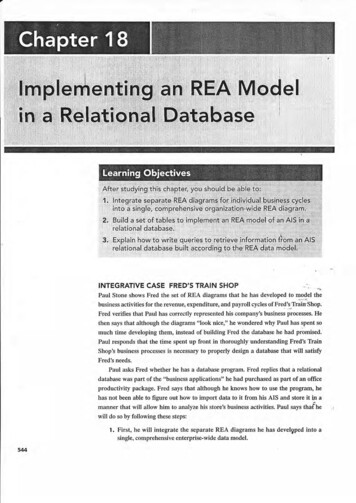
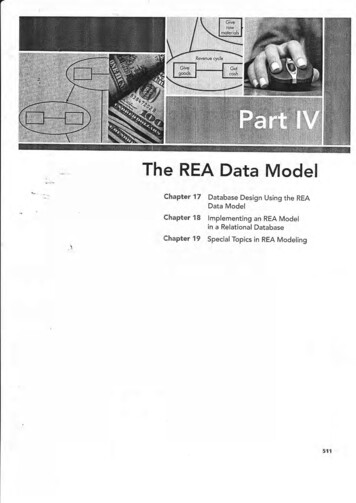
516PARTIV.THE REA DATA MODELThe REA Data Model2T\e REA datafocuses on theguidance forand bymodels arechapter anddata model aswas developed specifically for use f[ aesigning AIS. The REA data modelsemantics underlying an organization's value-chain activities. It providesLse design by identifuing what entities should be included in the AIS databasehow to structure relationships among fhe entities in that database. REA datadepicted in *re form of E-R diagrams. 'Coosequently, in the remainder of thisthe book, we will refer to E-R diagmms developed according to the REAdiagrams.Three Basic Types of EntitiesThe REA data model is so named because it classifies entities into three distinct categories: theresources the organization acquires and uses, the ?yents (business activities) in which the organization engages, and the agents panicipating in these events.3 Figure l7-3 provides exdmplei ofthese three types of entities.Resources are those things that have economic value to the organization. Figure 17-3includes two resource entities: cash and inventory. Events arc the various business activitiesabout which management wants to collect information for planning or contlol porposes.4 Thereare two event entities in Figure l7-3: Sales and Receive Cash.dents are the people and organizations that participate in events and about whom information is desired for planning, control,and evaluation purposes. Figure l7-3 includes two types of agent entities: Employees andCustomers.FIGURE 17-3Basic Elements of anREA Diagram2lhe material inthis section is adapted from William E. Mccarrhy, . An Enriry-Relationship View of AccountingThe Accounting Reyiew (Octobet 19'79): 667-686; William E. Mccarthy, .The REA Accounting Modil:A Generalized Framework for Accourting Systems in a Shar d Dara Environ mentj' The Accounting Retiw(July 1982): 554-578; and Guido L. Geerts and W. E. Mccarthy, .An Ontological Analysis of rhe primitives of rheExtended-REA Enterprise Informarion AlchitectIIe:' Internationat toumal ofAcco ntin Infot nation Slnems3(March 2002): l-16.'Some RIA data modelers have proposed a fourth type of entity, which they call locadons. Stores ard warehouseswould be examPles of this founh typ of eDtity. However, such "location" entities are usually also resources controll alModels:'by the organization. Therefore, the anrhors of this text s e no compelling reason to crcale yei another type of entity indmodel locations as resources. If an organization does not want or need to store informatjon about locatior.identify where an evenr occuned,locadon can be an attribute for each evenr."*""pitoaThediscussion of events in rhis section is based on the work of Julie smirh David, "Three 'Bvents' That Define anREA Methodology for Systems Analysis, Design, and Implemenrarion," Working pap r, Arizona State Universiry,August 1997, and cuido L. ceerts and W. E. Mcca(hy, .An Ontologicat Analysis of iie primitives of rt*Extended-REA Enterprise Infomation Architedure:' Intemationnl Joumat olAccounting tnfonnation Slstell.s 3(March 2002): I 16.
CHAPTERStructuring Relationships: The BasicREA17.DATABASE DESTGN USING THE REA DATAMODEL517TemplateThe REA data model prescribes a basic pattern for how the three types of entities (resources,events, and agents) should relate to one another. Figure 17-4 presents this basic pattern. Theessential features of th patlem are as follows:-l Each event is link{df.to at least one resource that it affects.2- Each event is linkdd lo at least one other event.3. Each event is linked to at least tn o participating agents.RULE 1: EVERY EV;NT ENTITY MUST BE LINKID TO AT LEAST ONE RESOURCE ENTITY EVENTSmus, be linked to at least one resource that they affect. Some events, such as the one labeled "Get17-4, increase the quantity of a resource' Common examples of such"Get" events include the receipt of goods ftom a supplier (which increases the quantity on handof inventory) and the receipt of payment ftom a customer (which increases the arnount of cash).Other eyents, such as the one labeled "Give Resource B" in Figure 17-4, directly decrease thequantity. of a resource. Common examples of such "Give" events include paying suppliers andselling merchandise, which decrease the amount of cash and quantity on hand of inventory,ResourceA" in FigurerespectiYely.Relatioqslips that affect the quantity of a resource are sometimes referred to as stocffiowrelationships because they represelrt either an inflow or oudlow of that resource. Not every eventd ectlratem the quantity of a resource, however. For example, orders from customers representeom tments that will eventually result in a future sale of merchandise, just as orders tosuppliers represent commitments that will eventually result in the subsequent purchase ofinventory. For simplicity, Figure 17-4 does not include any such commitment events.Olgadzations do, however, need to track the effects of such commitments, both to provide betterservice and for planning purposes. For example, customer orders reduce the quantity available ofthe speci{ic inventory items being ordered. Sales staff need to know this information to be able toproperly respond to subsequent customer inquiries and orders, Manufacturing companies mayuse inforrnation about customer orders to plan production. Later in the chapter we will see howto add commitmAnt events to
The REA data model focuses on the semantics underlying an organization's value-chain activities. It provides guidance for and by models are chapter and the book, we will refer to E-R diagmms developed according to the REA data model as diagrams. Three Basic Types of Entities The REA data model is so named because it classifies entities into three distinct categories: the