Transcription
Follow the Pill:Understanding theU.S. CommercialPharmaceutical Supply ChainPrepared for The Kaiser Family Foundation by:The Health Strategies Consultancy LLCMarch 2005
Table of ContentsI.Executive SummaryII.The Flow of Goods from Manufacturers to Consumers in the U.S.Pharmaceutical Supply ChainPharmaceutical ManufacturersWholesale DistributorsPharmaciesPharmacy Benefit Managers (PBMs)III.The Flow of Money and Key Financial Relationships in the U.S.Pharmaceutical Supply ChainPharmaceutical ManufacturersWholesale DistributorsPharmaciesPharmacy Benefit Managers (PBMs)IV.ConclusionV.AppendixA. Special Pricing Rules Applicable to Federal ProgramsMedicaidDepartment of Veteran Affairs, Department of Defense, Public HealthService, Coast GuardSection 340B Drug Pricing ProgramB. Other Stakeholders in the U.S. Commercial Supply ChainPhysiciansLarge EmployersHealth PlansVI.Key Acronyms and Glossary of Key Terms
I. Executive SummaryThe pharmaceutical supply chain is the means through which prescription medicines aredelivered to patients. Pharmaceuticals originate in manufacturing sites; are transferred towholesale distributors; stocked at retail, mail-order, and other types of pharmacies;subject to price negotiations and processed through quality and utilization managementscreens by pharmacy benefit management companies (PBMs); dispensed by pharmacies;and ultimately delivered to and taken by patients. There are many variations on this basicstructure, as the players in the supply chain are constantly evolving, and commercialrelationships vary considerably by geography, type of medication, and other factors.The intent of this paper is to demystify the U.S. pharmaceutical supply chain. The firstsection of the paper describes each of the key players (i.e., industry segments) involved inthe process of supplying prescription drugs to consumers. The section begins with adiscussion of what each player does and the role that it plays in the flow ofpharmaceuticals from manufacturer to patient. The second section of the paper describesthe financial relationships between each of these key players and how the dollars flowbetween and among the segments, including the consumer.Highlights from this paper about the key players and their financial relationships include:Pharmaceutical Manufacturers: A relatively few large, multinational firms comprise the bulk of the brandpharmaceutical manufacturing industry today – the 10 largest pharmaceuticalcorporations, as measured by U.S. sales, accounted for almost 60 percent of totalU.S. sales in 2004. Pharmaceutical manufacturers have the most influence over pharmaceuticalprices, assessing expected demand, future competition, and projected marketingcosts to establish the wholesale acquisition cost (WAC), which is the baselineprice at which wholesale distributors purchase drug products. Discounts andrebates may be applied, based on market share, volume, and prompt payment.Wholesale Distributors: The wholesale distribution industry has consolidated in the last 30 years, with thenumber of wholesale distributors in the U.S. declining from approximately 200 in1975 to fewer than 50 in 2000. The top 3 wholesale distributors account foralmost 90 percent of the wholesale market. Wholesale distributors typically sell drugs to pharmacies at WAC plus somenegotiated percentage. They may facilitate discounts negotiated betweenmanufacturers and other customers.Pharmacies: Although comprising a small overall percentage of total prescriptions filled(approximately 6.1 percent in 2004), mail-order pharmacy sales were the fastestgrowing sector of the U.S. prescription drug retail market in 2004, increasing by18 percent over the previous year.Page 1
Pharmacies may negotiate with manufacturers or wholesalers for discounts andrebates based on volume sales or market share, and they may negotiate withPBMs for inclusion in their networks and for their reimbursement (drug cost plusdispensing fee).Pharmacy Benefit Managers (PBMs): Approximately two-thirds of all prescriptions written in the U.S. are processed bya PBM. PBMs may achieve savings for their customers by negotiating discounts andthrough cost containment programs, including use of formularies and cost sharing.The Appendix briefly describes: (A) special pricing rules applicable to Medicaid andsome other federal programs, and (B) the roles physicians, large employers, and healthplans have in the pharmaceutical supply chain.The pharmaceutical supply system is complex, and involves multiple organizations thatplay differing but sometimes overlapping roles in drug distribution and contracting. Thiscomplexity results in considerable price variability across different types of consumers,and the supply chain is not well understood by patients or policymakers. Increasedunderstanding of these issues on the part of policymakers should assist in making rationalpolicy decisions for the Medicare and Medicaid programs.Page 2
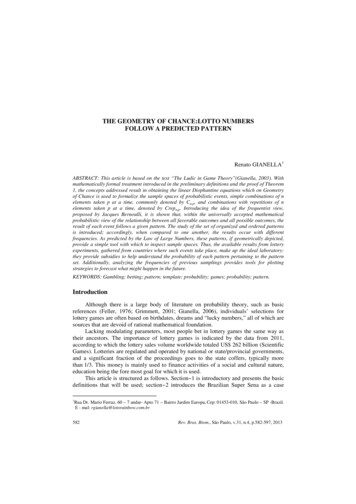
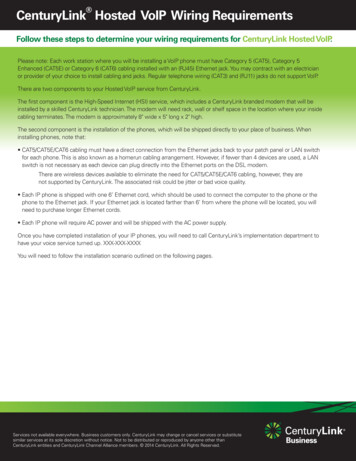
Exhibit 1. Flow of Goods and Financial Transactions Among Players in the U.S.Commercial Pharmaceutical Supply ChainCONSUMERPremiumPayment FlowRebate FlowProduct flowEMPLOYER/PLANSPONSOR ORHEALTH INSURERMember Cost Share orPayment for Drug if Cash Y(Retail, Mail-order)DRUGWHOLESALER/DISTRIBUTORPrompt Pay,y,Volume DiscountsNegotiatedPaymentDRUGMANUFACTURERSource: The Health Strategies Consultancy LLCPage 3
II. The Flow of Goods from Manufacturers to Consumers in the U.S.Pharmaceutical Supply ChainPharmaceutical ManufacturersManufacturers are the source of the prescription drugs in the pharmaceutical supplychain. The pharmaceutical manufacturing industry is composed of two distinct businessmodels: manufacturers of brand-name drugs (e.g., Pfizer, Merck, and Novartis) andmanufacturers of generic drugs (e.g., Mylan, Roxane, and Barr). There are a fewpharmaceutical companies that participate in both the branded and generic parts of theindustry, and both models focus on the manufacturing and packaging of pharmaceuticalproducts, but there are other important differences. Most brand manufacturers devote aportion of their expenses to the scientific research and development of new drugtherapies. Generic drug manufacturers typically do not develop new drug therapies, butinstead manufacture generic compounds that compete directly with the original brandedversion of a drug once the brand product’s patent protection has expired.Manufacturers manage the actual distribution of drugs from manufacturing facilities todrug wholesalers, and in some cases, directly to retail pharmacy chains, mail-order andspecialty pharmacies, hospital chains, and some health plans. Manufacturers may alsodistribute products directly to government purchasers, such as the VeteransAdministration, AIDS Drug Assistance Programs (ADAPs), and Vaccines for Children(VFC), which typically receive the largest price discounts. In a few rare cases, amanufacturer may distribute drugs directly to a self-insured employer with an on-sitepharmacy, but the typical employer-sponsored plan does not follow this path. Wholesaledistributors are the manufacturers’ largest purchasers. Very few drugs are distributeddirectly to consumers.At the most basic economic level, a pharmaceutical manufacturer supplies a quantity ofits products that is equal to the demand for its products from consumers/patients (ofcourse, consumer demand in this market is expressed through the medium of aprescribing physician or other licensed health care provider). Manufacturers also playroles in stimulating demand for drug products through underwriting clinical studiesdesigned to demonstrate the value proposition of pharmaceutical treatments compared toone another or compared to no clinical treatment at all; by engaging in the promotion andmarketing of products to health care providers (including health plans and PBMs) anddirect-to-consumer advertising; and by administering patient assistance programs thatprovide the firm’s products at nominal cost to low-income consumers.Manufacturers also play an important role in ensuring the safety of the pharmaceuticalsupply chain by producing informational labeling for prescribers and consumers that isconsistent with the terms and conditions of a drug’s approval by the U.S. Food and DrugAdministration (FDA), and by using electronic bar-coding technology on drug packagingthat may be used to track individual production lots, and to prevent prescribing errors.Page 4
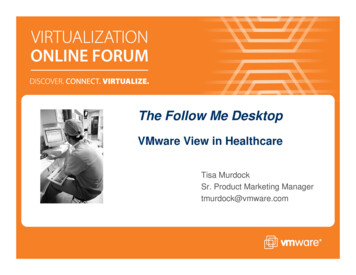
Overview of Pharmaceutical Manufacturing IndustryPharmaceutical manufacturing is a large global industry. In 2003, worldwidepharmaceutical industry sales totaled 491.8 billion, an increase in sales volume of 9percent over the preceding year.1 The U.S. represents the largest single national marketfor pharmaceuticals, accounting for 44 percent of global industry sales in 2003, or a totalof 216.4 billion, which was an increase of approximately 12 percent from the previousyear’s figure.2After a decade of significant mergers and acquisitions by drug companies, a relativelyfew large, multinational firms comprise the bulk of the brand pharmaceuticalmanufacturing industry today. The ten largest pharmaceutical corporations, as measuredby U.S. sales, accounted for almost 60 percent of total U.S. sales in 2004:Exhibit 2. Top 10 Pharmaceutical Corporations by U.S. Sales, 2004U.S. Sales % Growth Over% Market( Billions)Previous YearShareCorporationPfizer 30.7513.1GlaxoSmithKline18.818.0Johnson & Johnson16.276.9Merck & ofi-Aventis10.0134.3Amgen9.5234.1Bristol-Myers Squibb9.2-43.9Wyeth8.2113.5Total, Top 10139.1-59.3Source: IMS Health, IMS National Sales Perspectives,TM February 2005, accessed 2/28/05 eC/0,2777,6599 49695983 69891374,00.htmlRank123456789101IMS Health, “Bruised But Triumphant,” Medical Marketing and Media, May 2004, accessed athttp://www.imshealth.com/vgn/images/portal/cit 2IMS Health, “IMS Reports 11.5 Percent Dollar Growth in '03 U.S. Prescription Sales,” February 17, 2004,accessed at /0,2777,6599 3665 44771558,00.html.Prescription sales figures reported by IMS Health represent manufacturer prices.Page 5
When measured by prescription volume, the “top 10” list is similar but not identical, as afew generic drug manufacturers appear on the list:Exhibit 3. Top 10 Pharmaceutical Corporations by Total U.S. DispensedPrescriptions, 2004U.S. Prescriptions % Growth Over% MarketCorporation(Millions)Previous 21.276.3Mylan -133.9Merck & Co.129.533.7AstraZeneca100.4112.9Johnson & Johnson95.6-92.7Abbott91.5-42.6Total, Top 101754.0.49.8* Generic drug manufacturersSource: IMS Health, National Prescription AuditTMPlus, January 2005, accessed 2/28/05 eC/0,2777,6599 49695974 68913574,00.htmlRank12345678910Exhibit 4 provides a description of the generic pharmaceutical market:Exhibit 4. Top 10 Generic Manufacturers by Total Global Sales, 2003Global SalesRank Corporation( Millions)1 Sandoz 4,004.02 Teva Pharmaceutical Industries Limited3,276.43 IVAX Corporation1,420.34 Mylan Laboratories Inc.1,269.25 Alpharma Inc.1,297.36 Andrx Corporation1,046.37 Barr Pharmaceuticals, Inc.902.98 Par Pharmaceutical Companies, Inc.661.79 American Pharmaceutical Partners, Inc.351.310 Eon Labs, Inc.329.5Source: Hoover’s, Inc. Hoover’s Online, accessed 1/03/2005.% Growth OverPrevious Year30.118.615.04.835.7-24.173.426.634.9To convey the size of the pharmaceutical manufacturing industry from the perspective ofindividual products, the following tables present data on the biggest sellingpharmaceutical products in the United States in 2004, measured by prescriptionsdispensed and by sales in dollars. Exhibits 5 and 6 are for individual drug products,while Exhibits 7 and 8 are for broader therapeutic classes of drugs.Page 6
Exhibit 5. Top 10 Products by Total U.S. Dispensed Prescriptions, % Growth% MarketOver PreviousShareYear1LipitorPfizer74.892.12HYCD/APAP oloftPfizer33.110.97ZocorMerck29.610.88HYCD/APAP linTeva26.2-50.7TMSource: IMS Health, National Prescription Audit Plus, January 2005, accessed 2/28/05 eC/0,2777,6599 49695974 68913594,00.htmlExhibit 6. Top 10 Products by U.S. Sales, 2004RankProductManufacturerU.S. Sales( Billions)% Growth% MarketOver PreviousShareYear1LipitorPfizer iumAstraZeneca3.8231.65ProcritOrtho -41.38PlavixSanofi-Synthelabo3.0331.39Advair Diskus GlaxoSmithKline2.9261.210ZyprexaEli Lilly2.8-101.2Source: IMS Health, IMS National Sales Perspectives,TM February 2005, accessed 2-28-05 eC/0,2777,6599 49695983 69890133,00.htmlExhibit 7. Top 10 Therapeutic Classes by Total U.S. Dispensed Prescriptions, 2004RankTherapeutic ClassTotal% Growth% MarketPrescriptions over /SNRIs147.444.23ACE Inhibitors143.854.14HMG-COA Reductase Inhibitors (Statins)139.8114.05Beta Blockers120.673.46Proton Pump Inhibitors93.1-22.67Thyroid Hormone, Synthetic90.062.68Calcium Blockers88.402.59Seizure Disorders84.872.410Oral Contraceptives82.5-32.3Source: IMS Health, National Prescription AuditTMPlus, January 2005, accessed 2/28/05 eC/0,2777,6599 49695974 68914714,00.htmlPage 7
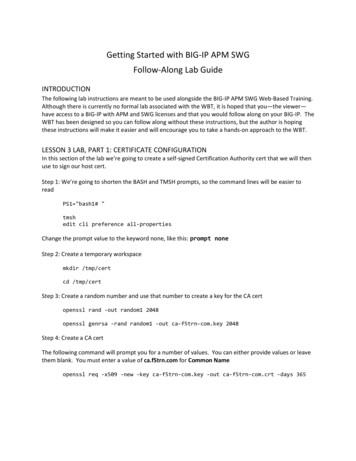
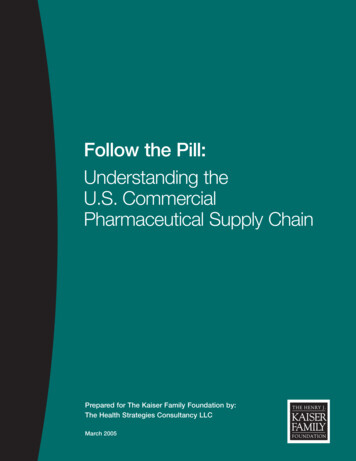
Exhibit 8. Top 10 Therapeutic Classes by U.S. Sales, 2004Rank123456Therapeutic ClassHMG-COA Reductase Inhibitors (Statins)Proton Pump InhibitorsSSRIs/SNRIsAntipsychotics, OtherSeizure DisordersErythropoietinsU.S. Sales( Billions) 15.512.511.09.18.28.0% Growth OverPrevious Year12-31121987Antiarthritics, COX-2 Inhibitors5.308Calcium Channel Blockers4.419Angiotensin II Antagonists4.42410Ace Inhibitors3.9-5Source: IMS Health, IMS National Sales Perspectives,TM February 2005, accessed 2/28/05 eC/0,2777,6599 49695983 69891394,00.html% MarketShare6.65.34.73.83.53.42.31.91.91.7Wholesale DistributorsWholesale distributors purchase pharmaceutical products from manufacturers anddistribute them to a variety of customers, including pharmacies (retail and mail-order),hospitals, and long-term care and other medical facilities (e.g., community clinics,physician offices anddiagnostic labs). SomeExhibit 9. Wholesale Distribution Industrywholesalers sell to a broadIn 2004, the wholesaler distributor industry is valued atapproximately 212 billion in annual U.S. sales. The followingrange of potential clients whilethree wholesalers represent 88% of the market:others specialize in sales ofparticular products (e.g.,1) McKessonbiologic products) or sales to Merged with health-care software giant HBO & Co. inparticular types of customers1998(e.g., nursing homes). Rolling 12-month sales as of September 2004: 72.2billion; Market Share: 34.1%2) Cardinal Health From 1999 – 2002, Cardinal merged with many otherwholesalers including Allegiance Corporation andBindley Western Industries Rolling 12-month sales as of September 2004: 63.3billion; Market Share: 29.9%3) AmerisourceBergen Began operations in August 2001 following merger ofAmeriSource Health Corporation and Bergen BrunswigCorporation Rolling 12-month sales as of September 2004: 52.4billion; Market Share: 24.8%Source: GICS Sub-Industry Revenue Share (09/04/2004).Copyright 2004 Standard & Poor's.Page 8In the past, wholesalers limitedtheir operations to a traditionaldistribution function. Theyprovided the link betweenmanufacturers and pharmacies(and other entities, e.g.,government sites andphysicians) by warehousingproducts and managinginventory. While “traditional”distribution services remain thecornerstone of the business, theindustry has developed a morecomprehensive list of servicesin response to the evolving
marketplace. Today, wholesale distributors provide a number of specialized services,including specialty drug distribution, drug repackaging, electronic order services,reimbursement support, and drug buy-back programs.3The wholesale distribution industry has gone through significant change andconsolidation in the last 30 years, due in part to the increasing pressures to lower costs.Between 1975 and 2000, the number of wholesale distributors in the U.S. declined fromapproximately 200 to fewer than 50.4 The top three wholesale distributors, McKesson,Cardinal Health, and Amerisource-Bergen, account for almost 90 percent of the entirewholesale drug market.5This consolidation has forced the industry to change its revenue model, evolving its coredistribution business into a low-margin enterprise that makes money by maximizingeconomies of scale, creating physical efficiencies in the distribution system (such as“just-in-time” deliveries to customers), and realizing financial efficiencies (such asretaining discounts for prompt payment). The industry has also extended and augmentedits business model by moving into specialty pharmacy and disease management services.PharmaciesPharmacies are the final step on the pharmaceutical supply chain before drugs reach theconsumer/patient. Pharmacies purchase drugs from wholesalers, and occasionallydirectly from manufacturers, and then take physical possession of the drug products.After purchasing pharmaceuticals, pharmacies assume responsibility for their safe storageand dispensing to consumers. Pharmacy operations include maintaining an adequatestock of drug products, providing information to consumers about the safe and effectiveuse of prescription drugs, and facilitating billing and payment for consumers participatingin group health benefit plans.Pharmacies also serve as a vital information link between PBMs, drug manufacturers, andwholesale distributors. Unlike most other sectors of the health care delivery system inthe U.S., the pharmaceutical supply chain is highly automated and virtually all claimstransactions are handled electronically, rather than on paper. Since they are the finalpoint of sale for pharmaceuticals and the interface between the supply chain and theconsumer, pharmacies generate the prescription drug claims information that PBMs, aswell as heath plans, employers, governments, and other payers, rely upon to measureconsumer activity. Other types of information, both quality-focused (e.g., drug-druginteraction warnings) and utilization management-based (e.g., formulary compliance3Drug buy-back programs are offered by manufacturers and are facilitated by wholesale distributors. Buyback programs are intended to minimize the financial risk that pharmacies must assume in stockingproducts by allowing them to sell unused products or products with near-term expiration dates back to themanufacturer.4Goldman Sachs Industry Report: Health Care Technology & Distribution, February 27, 2003.5Standard & Poor's, GICS Sub-Industry Revenue Share, September 4, 2004.Page 9
messaging) can originate from other parts of the supply chain, in particular from PBMs,to the pharmacy as a prescription is being dispensed. As the final actor in the supplychain, it is up to the pharmacy to take action based on the information provided. Forexample, the pharmacy is expected to contact the prescribing physician if the drugprescribed is not on the patient’s health plan’s formulary or if a lower-cost therapeuticalternative is available.There are several types of pharmacies, including independent pharmacies, chain drugstores, pharmacies in supermarkets and other large retail establishme
(Retail, Mail-order) PHARMACY BENEFITS MANAGER EMPLOYER/PLAN SPONSOR OR HEALTH INSURER DRUG WHOLESALER/ DISTRIBUTOR CONSUMER Payment Flow Rebate Flow Product flow Source: The Health Strategies Consultancy LLC Page 3. II. The