Transcription
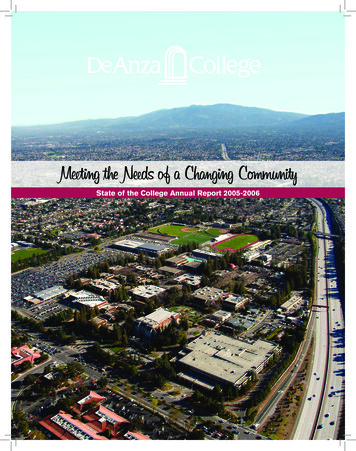
PREFACE Meeting the Needs of a Changing CommunityDe Anza College began the 2005-2006 academic year with a sense of relief at having weathered the budget and enrollment crises of 2004-2005, and with anticipation that the coming year would give us the opportunity to grow ourenrollment and deepen our commitment to the success of our students.The year began with the culmination of De Anza’s six-year re-accreditation cycle, as we hosted the visit of the WASCAccreditation team. Their formal report affirmed not only the college’s accreditation, but also our place as a premierinstitution of higher learning, and offered strong support for our enduring agendas in support of student learning andstudent equity. It was as positive an accreditation report as anyone could remember having seen for a college.We also began the year with a series of new initiatives aimed at sustaining our enrollment recovery, despite our continuing budget challenges. New tutoring programs, expanded library hours, and the development of new Job Corpssites brought us enrollment growth, but also highlighted the need for a more sustained effort at enrollment planningfor the future. We also initiated expansions in student tutorial and academic support services, fueled by an outpouringof student and faculty volunteer tutors and the opening of a new student reading and writing center.In these and a myriad other ways the college demonstrated its particular genius in designing projects aimed at meetingthe particular and diverse needs of our students – and doing so with extraordinarily limited funding. De Anza facultyand staff proved over and over again that they hold student success at the very heart of the enterprise, and are preparedto do new things, devise new programs and make enduring commitments to our students.This report details the results of much of that work. It reports the numbers by which we assess critical elements ofour success. It uses the metrics established by the college’s Educational Master Plan to explore how well we continueto meet our obligations. In these metrics we will judge ourselves largely successful, and be proud that we can do somuch with so little.This report will also detail the accomplishments of the Academic and Classified Senates as well as our fine studentgovernment. It will also report on the continued physical renovation of the campus as we enter the final phases of ourMeasure E build-out. We began the fall quarter with the opening of the new Student and Community Services Building, providing an elegant entrance to a full array of student support services, and offering an entirely new face of thecollege to our neighbors on Stevens Creek Boulevard. The P.E. Quad and new playing fields for soccer and softballwere completed, as was much of the reconstruction of the S-Quad. Construction began on the redesigned Administration Building, soon to open with several new classroom spaces. And then there will be new pathways, lighting and thedesign of a new performance hall and gallery space for the arts.Just as the year was marked by new construction, so it was marked by a renewed commitment to the broader publicpurposes of our work. The Task Force on Community and Civic Engagement completed its report to the campus,providing a host of good suggestions that would deepen the college’s commitment to developing the civic skills of ourstudents. The college continued its partnership with the New York Times, as the paper brought several correspondentsto campus for presentations, and the campus newspaper, La Voz, initiated a new section on community service opportunities for our students. The campus was also host to its usual array of speakers and public forums, as students andfaculty debated a variety of issues from Iraq to the impact of journalism on history. The campus was animated as wellby music and art and dance, as De Anza continues to be a cultural resource for our students and our neighbors.Finally, as I will detail in my concluding remarks for this report, the college initiated a new strategic planning process,framed by an excellent planning proposal drafted by several of our own faculty and staff. This State of the College Report will conclude with “The Case for Planning” that initiated the strategic planning process. At the heart of both thisreport and the planning effort is a common thread: De Anza College will honor its traditions of service and excellence,renew its commitment to student equity and success, and devise ever-new innovations in our programs and projects.Our students and their communities deserve no less, and our faculty and staff demand it.De Anza College State of the College Annual Report 2005-2006
Meeting the Needs of a Changing CommunityTable of ContentsPart I.Where We Are TodayEnrollment and Demographics.1Student Success and Outcomes.12Faculty and Staff Development.28Fiscal Resources.31Part II.Accomplishments for 2005-2006Organizational Charts.38Academic Senate, Classified Senate, DASB.40Students, Faculty and Staff.45Part III.Community and Civic Engagement Institute PlanSummary of Proposal.52Committee Members and Plan Authors.53Part IV.Measure E ProgressPart V.Summary and President’s MessageResponding to Change in 2006-2007.63The Case for Planning.64De Anza College State of the College Annual Report 2005-2006
Meeting the Needs of a Changing CommunityPART I.Where We Are TodayThis section provides a statistical overview of De Anza College using the latest data available.Graphs and numerical data are presented on students, faculty and staff, and college financial trends.The information is meant to present a snap shot view of trends important for college planning thatcan be used throughout the year. The trends form the basis for discussions on how well the collegeis doing in meeting its goals for student access and success.De Anza College State of the College Annual Report 2005-2006
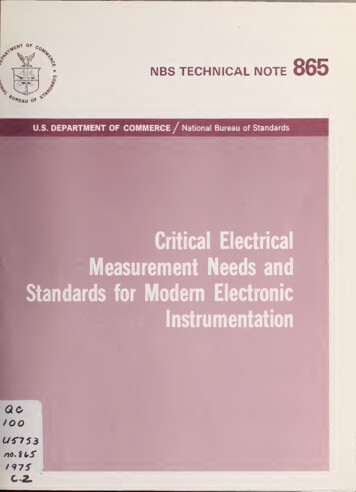
Meeting the Needs of a Changing CommunityEnrollment and DemographicsThis section includes information on De Anza College students and their enrollment trends. The college has experiencedconsiderable change in its student population over the past five years. Enrollment in on-campus programs is down. Asmaller percentage of local high school graduates is attending the college than in previous years. Despite the declinein on-campus enrollment the college continues to serve an increasingly diverse student body in terms of ethnicity andstudent needs. Taken together, these changes paint a picture of a dynamic campus that will continue to change in theyears ahead.Figure 1 Santa Clara County Adult Population and De Anza Headcount (HC) as a Percent of Populationmeasures the college’s fall enrollment as a percentage of adults who live in Santa Clara County. The percentage drawhas remained fairly consistent for the past several years at just below 2% of the adult population.Figure 1De Anza CollegeSanta Clara County Adult Populationand De Anza HC as a % of 01.0%1,0500.5%1,000Percent of Population3.5%Adult Population (Thousands)1,3500.0%200120022003Adult Population20042005HC as a % of PopFrom 2004 to 2005 the adult population of Santa Clara County increased about 1% while the college fall headcountremained constant.De Anza College State of the College Annual Report 2005-2006
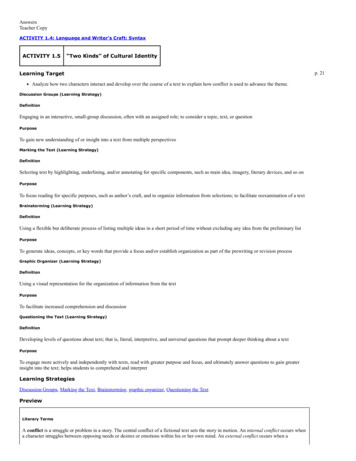
Meeting the Needs of a Changing CommunityFigure 2 Santa Clara County June High School Graduates Enrolled the Following Fall at De Anza portrays thecollege’s draw of students from feeder high schools as of June 2005. (Note: High school data for 2006 was not availableat the time of this report’s publication and has been estimated based on 12th grade enrollment.) The number of June highschool graduates increased slightly from 2004 to 2005. During the same period De Anza fall enrollment of these studentsdecreased slightly from 1,850 to 1,795. These changes have resulted in a decline in the percent of June graduates enrolling atDe Anza in the fall to about 12%.Figure 6,0008.04,0006.02,0004.002.0200120022003June HS Graduates2004Percent Enrolled in FallNumber HS GradsDe Anza CollegeSanta Clara County June High School GraduatesEnrolled the Following Fall2005Percent Enrolled* Public schools only.During the fall terms of 2001-2003 the percent of high school graduates attending De Anza (the “draw” rate) wasabout 14%. A 2% difference in draw rate amounts to nearly 300 recent high school students who are not attendingDe Anza in the fall. De Anza College State of the College Annual Report 2005-2006
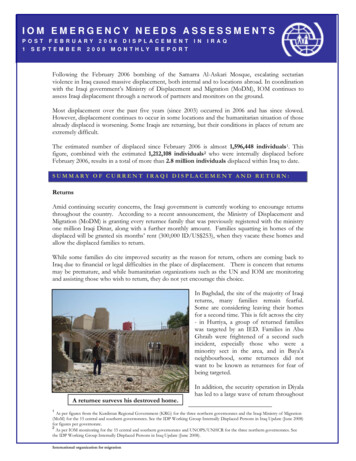
Meeting the Needs of a Changing CommunityFigure 3 Santa Clara County Adult Population and De Anza Students by Ethnicity compares De Anza fall 2005enrollment by ethnicity (not including the “Unknown” / “Decline to state” category) to Santa Clara’s adult populationin 2005. Since about 15% of De Anza students select “Decline to state” as their ethnicity and county figures do notinclude this category, comparisons with county figures must be made with caution. By recalculating the De Anzapercentages without the “Unknown” and “Decline to state” categories, we are assuming that the students in thesecategories have ethnicities proportional to the overall student body.Figure 3Santa Clara County Adult Population andDe Anza College Students by Ethnicity100%90%80%70%60%50%40%30%20%49%48%24%3% 6%10%0%Asian/ PI /Filipino30%22%16%Black0% 1%HispanicSanta Clara CountyAmer Ind.WhiteDe Anza Fall 2005Note: Unknown/Decline to state not included in the De Anza figures to be consistent with Santa Clara County figures.Even with these cautions, it is apparent that the college enrolls proportionally more Asian students than are found inthe overall adult county population. White and Hispanic students are underrepresented at De Anza when compared tocounty population estimates. The non-adult population in Santa Clara County has a higher percentage of individualsof Hispanic origin than the adult population, which suggests that in the years ahead there may be a higher percentageof Hispanic students who will or could attend De Anza than at present.De Anza College State of the College Annual Report 2005-2006
Meeting the Needs of a Changing CommunityFigure 4 Fall Headcount Percentage Distribution by Ethnicity gives a longitudinal picture of the college’s ethniccomposition. In 2004 a new selection process for ethnicity on the online student application was initiated. As a result,fewer new students are selecting “Decline to state.” In 2005 there was little change in the percentage of students ineach ethnic group, with Hispanic students showing a slight increase in percentage share.Figure 4De Anza CollegeFall Headcount Percentage Distribution by Ethnicity100%90%80%70%60%50%40%30%20%10%0%Asian / PI /FilipinoBlack2001Hispanic2002Native Am20032004WhiteOther /Unkn2005Taken together, students who identified themselves as members of the Asian, Pacific Islander and Filipino ethnicgroups comprise the largest percentage of De Anza students – about 40%. White students represent the next largestgroup at about one quarter. Hispanic students make up about 14% of De Anza’s student population, with Black andNative American students each making up less than 5% of the overall student body. De Anza College State of the College Annual Report 2005-2006
Meeting the Needs of a Changing CommunityFigure 5 Asian Fall Headcount Distribution shows the enrollment change of the Asian student subgroups over thelast five years.The Asian/Other Asian category declined from 2002 to 2005, primarily because the two categories were merged toOther Asian in the online application for students in fall 2004. Some of the increase in the other ethnic groups is dueto this change in available categories. The number of Chinese students increased by more than 200 or 7% from 2004to 2005.Figure 5De Anza CollegeAsian Fall Headcount DistributionAsian IndianAsian/Other 2002Japanese2003Korean2004Laotian2005Other Pac IslrPacific IslanderSamoanVietnamese01,0002,000 3,000 4,000De Anza College State of the College Annual Report 2005-2006
Meeting the Needs of a Changing CommunityFigure 6 Fall Headcount Distribution by Gender shows the percentage of the fall headcount made up of female andmale students over the last five years. Women currently make up about 52% of the De Anza population.Figure 6De Anza CollegeFall Headcount Distribution by Gender100%90%80%70%60%50%40%30%20%10%0%Male2001 Female20022003De Anza College State of the College Annual Report 2005-200620042005
Meeting the Needs of a Changing CommunityFigure 7 Fall Headcount Percentage Distribution by Age Group describes student access to the college as a functionof various age groupings. In 2005, 61% of the college’s students were less than 25 years old, a 3 percentage pointincrease over fall 2004. Ten years ago, in 1996, only 51% of De Anza College Students were under 25 years old.Figure 7100%De Anza CollegeFall Headcount Percentage Distribution by Age Group90%80%70%60%50%40%30%20%10%0%19 or less20 - 2425 - 2930 - 3435 - 3940 - 492001200220032004200550 De Anza College State of the College Annual Report 2005-2006
Meeting the Needs of a Changing CommunityFigure 8 FTES Enrollment by Division displays the college’s full-time equivalent student enrollment across 14 areasof the college. Over the years 2000-2001 and 2004-2005, the Applied Technologies Division (due mainly to Job Corps)experienced a significant enrollment increase while the Business/Computer Systems Division (due mainly to computerinformation systems and computer applications and office systems enrollments) had decreased enrollments.Figure 8De Anza CollegeFTES by DivisionApplied TechnologiesBiological & Health SciencesBusiness/Computer ScienceCreative Arts2000-01Intercultural/International Studies2001-02Language Arts2002-032003-04Library2004-05Physical EducationPhysical Sci/Math/EngineeringSocial Sci/Child DevSpecial EducationStudent Services0 5001,000 1,500 2,000 2,500 3,000 3,500 4,000 4,500 5,000De Anza College State of the College Annual Report 2005-2006
Meeting the Needs of a Changing CommunityFigure 9 Distance Learning Headcount and Enrollment, Fall Quarter, illustrates access to the college certificateand degree programs through distance delivery via the Internet, televised and video formats. Distance learning atDe Anza began in the 1970s. Approximately 110-120 sections of 80-90 courses are offered online each quarter.Enrollment showed a slight increase from fall 2004 to fall 2005.Figure 94,000De Anza CollegeDistance Learning Headcount and Enrollment, Fall 003Enrollment20042005HeadcountDe Anza College State of the College Annual Report 2005-2006
Meeting the Needs of a Changing CommunityWorkforce and EconomicDevelopment Enrollment and FundingDe Anza operates a number of entrepreneurial, self-supporting, revenue generating programs for business, industry,and the community. As of 2003-2004, the self-supporting Workforce and Economic Development programs includedthe following: The Occupational Training Institute provides intensive occupational training and job placement for arearesidents who are unemployed or underemployed. Professional and Workforce Development gives local employers access to cost-effective, customizedwork-site training and provides consulting and technology transfer services to manufacturers in the regionto help them compete globally. Community Education offers outstanding services and programs to community members, in educational,recreational, cultural, and community development beyond those offered by the regular college programfor students who are not seeking college credit or degrees. Community Education fee-based programsinclude the Planetarium programs, Short Courses and the Extended Year Summer Enrichment Program.Chart A 2003-2004 Enrollments in Workforce and Economic Development Programs lists the number ofindividuals participating in each program.Chart ADe Anza College 2004-2005Enrollments in Workforce and Economic Development ProgramsOccupational Training Institute607Professional and Workforce Development5,5006,107Community EducationPlanetarium25,148Extended Year Summer Enrichment Programs3,276Short Courses11,5321039,956Total46,063De Anza College State of the College Annual Report 2005-2006
Meeting the Needs of a Changing CommunityA major component of the Community Education Program is the Planetarium, which serves as a unique resource forspace science and astronomy education for all of Silicon Valley. The Planetarium offers a dynamic environment wherestudents learn to integrate principles of science, mathematics and technology. The educational programming providedby the Planetarium improves the level of science literacy for our community and fulfills a regional need.More than 25,000 students from 455 schools throughout Santa Clara County visit the Planetarium to view starshows that supplement their space science education. Another 8,000 community members attend the Planetarium onweekends to view public programming and stay current with the latest astronomical discoveries. More than 2,500De Anza students enroll in astronomy courses (which are presented in the Planetarium dome) every year. Twenty-fivepercent of the enrolled college students state that their first exposure to astronomy was via a school field trip to thePlanetarium when they were children.To date, funds have been secured to purchase and install the new star projector, a new state-of-the-art 50-foot dome,new seats and carpeting, and an upgrade for some of the lighting, electrical and mechanical infrastructure in thePlanetarium dome. Funding sources include: Federal Appropriations dollars, California State Capital Outlay Funds,Measure E Bond Funds and Community Education Program revenues.The college is actively seeking private and corporate funding to complete the project and replace several major piecesof equipment critical to the daily operation of the Planetarium, including a Full Dome Digital Visualization System, acomprehensive projection system, a sound system and educational lobby exhibits. The purchase and installation of aFull Dome Digital Visualization System will offer a unique educational opportunity for students of all ages to literallyfly through seamless virtual worlds exploring everything from DNA creation to the edge of the physical universe.De Anza College State of the College Annual Report 2005-200611
Meeting the Needs of a Changing CommunityStudent Success and OutcomesThis section includes information on student success and outcomes as measured by course success rates, transfers anddegrees obtained. De Anza continues to be a leader in the state in transfer to the University of California and remainsabove the statewide average in course success rates. The college consistently appears on the Community CollegeWeekly list of top 100 degree-granting community colleges in the country. Unfortunately, the data in this sectionalso paints and uneven picture of student success based on ethnicity. The reasons f
De Anza College State of the College Annual Report 2005-2006 PREFACE De Anza College began the 2005-2006 academic year with a sense of relief at having weathered the budget and en-rollment crises of 2004-2005, and with anticipation that