Transcription
ETF Rotation StrategiesJackie Ann PattersonEditor, BackTesting Report Own Mountain Trading Company 20121
Required Disclaimers Trading involves risk of loss and may not be suitable for everyone. The author actively trades stocks and ETFs. She may or may not hold a positionin any instrument discussed. This presentation is for educational purposes and is not a recommendation to buyor sell securities. HYPOTHETICAL OR SIMULATED PERFORMANCE RESULTS HAVE CERTAIN LIMITATIONS. UNLIKEAN ACTUAL PERFORMANCE RECORD, SIMULATED RESULTS DO NOT REPRESENT ACTUALTRADING. ALSO, SINCE THE TRADES HAVE NOT BEEN EXECUTED, THE RESULTS MAY HAVEUNDER-OR-OVER COMPENSATED FOR THE IMPACT, IF ANY, OF CERTAIN MARKET FACTORS, SUCHAS LACK OF LIQUIDITY. SIMULATED TRADING PROGRAMS IN GENERAL ARE ALSO SUBJECT TOTHE FACT THAT THEY ARE DESIGNED WITH THE BENEFIT OF HINDSIGHT. NO REPRESENTATION ISBEING MADE THAT ANY ACCOUNT WILL OR IS LIKELY TO ACHIEVE PROFIT OR LOSSES SIMILARTO THOSE SHOWN.
I’m Jackie Ann Patterson –Editor of BackTesting ReportThe computer engineer who back-teststrading strategies and indicators
Shout Out to Fidelity Investments Funded my back-testing research thatbecame the basis for this presentation Published article -hold-sector-rotation Disclosure: Independent contractor forFidelity
Sector Rotation: How to GetRespectable Gains with Low Overhead What does THAT mean? System Design Decisions Timeframes Applicable Markets Types of Rotation Selection Criteria Example Sector Rotation Trading Plan5
Sector Rotation Definitions GOAL: Get in areas of market poised todeliver best performance NOT: intra-day trading NOT: Buy and Hold6
Respectable Gains 10% annually7
Minimal OverheadLimited time / effort Limited / no commissions Limited / no taxes (in IRA, see your accountant)8
Note Differences9
“Manage” Risk Historical drawdowns Stop loss10
System Design Decisions Timeframe Applicable Markets Types of Rotation Selection Criteria BackTesting Report 201211
System Design Decisions Timeframe Applicable Markets Types of Rotation Selection Criteria BackTesting Report 201212
Time Frame: Monthly or Daily From BackTesting with Wealth Lab Pro : RSI Rotations worked better DAILY RoC Rotations worked better MONTHLY WEEKLY rotation might have merit Personally, I like to work 1 day per monthWealth Lab Pro is a registered trademark of FMC, LLC.13
System Design Decisions Timeframe Applicable Markets Types of Rotation Selection Criteria BackTesting Report 201214
Markets Tested SPDR Sector ETFs XLB, XLE, XLF, XLI, XLK, XLP, XLU, XLV, XLY iShares ETFs, including Styles (e.g. small cap growth to large cap value) Fixed Income International Stocks, e.g. Dow 30SPDR is a registered trademark of S&P Financial Services, LLC. iShares is a registered trademark of Blackrock.15
Markets Tested SPDR Sector ETFs XLB, XLE, XLF, XLI, XLK, XLP, XLU, XLV, XLY iShares ETFs, including Styles (e.g. small cap growth to large cap value) Fixed Income International Stocks, e.g. Dow 30SPDR is a registered trademark of S&P Financial Services, LLC. iShares is a registered trademark of Blackrock.16
System Design Decisions Timeframe Applicable Markets Types of Rotation Selection Criteria BackTesting Report 201217
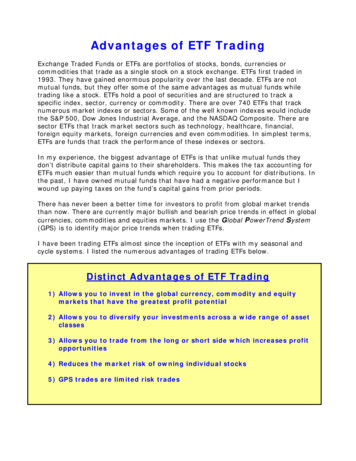
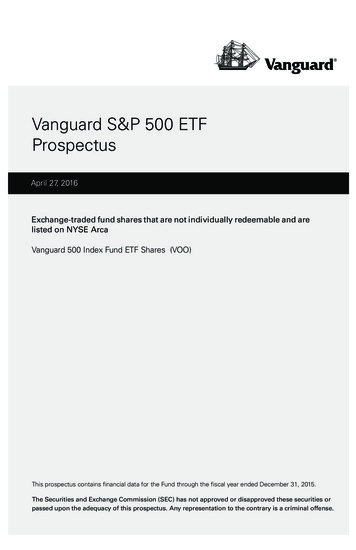
Types of Rotation Follow Economic Cycle thru sector ETFs T%5b Source: Sam Stovall’s Chart on StockCharts.com18
Types of Rotation Select beaten-down bargain ETFs19
Types of Rotation Select ETFs with highest momentum20
System Design Decisions Timeframe Applicable Markets Types of Rotation Selection Criteria BackTesting Report 201221
Selection Criteria K.I.S.S. Rank-able and continuously available Able to back-test RSI vs. RoC Dividends for Dogs of Dow22
Original Back-tests onWealth-Lab Pro for 2001 - 2011 S&P Sectors lagged in almost every test iShares High RoC rocked! Dow Stocks with low RSI moreconsistent due to daily trades Long/Short didn’t helpWealth Lab Pro is a registered trademark of FMC, LLC.23
Buy and Hold BaselineBuy & HoldiShares AllS&P500 (IVVComparison forSPDRs: 930 Fidelity Dow - Equal iShares ETF12/31/2001 - Select Sector Commission- Weight of 30tracking12/31/2011ETFsFree ETFsStocksfund)Starting Capital 100,000 100,000 100,000 100,000Net Profit 60,029 52,798 62,063 30,430Net Profit %60.0%52.8%62.1%30.4%Annualized Gain4.8%4.3%5.0%2.7%Total Commission( 72)( 231)( 239)( 8)Dividends Received 23,684 21,456 27,565 20,377Number of Trades929301Win Rate88.9%82.8%60.0%100.0%Maximum Drawdown( 84,414)( 79,755)( 76,261)( 78,159)Sharpe Ratio0.390.380.400.25Source: Wealth Lab Pro portfolio simulation for 2001-201124
1st Pass Performance StatsBacktest 2001-2011SPDR Sectors14-Day RSIiShares High30- day RoCDow 3014-Day RSISelection and Sizing3 lowest, 33.3%each3 highest,33.3% each3 lowest, 33.3%eachStarting Capital 100,000 100,000 100,000Net Profit 122,130 222,150 245,147Net Profit %122%222%245%Annualized Gain8%12%13%Total CommissionDividends ReceivedNumber of TradesAverage Bars HeldWin RateMaximum Drawdown( 22,220) 32,2581,3996.3459%( 88,087) 0 43,20216246.562%( 67,605)( 32,126) 39,0592,0224.6961%( 153,644)Sharpe Ratio0.550.890.66Source: Wealth Lab Pro portfolio simulation for 2001-201125
Long / Short Not HelpfulSPDRSectorsLong / Short on 30-Day RoC RoC (L/S)iShares RoC(L/S)Dow 30 (L/S)Selection and Sizing for 2Long and 1 Short45% each,1.5 margin45% each, 1.5margin45% each, 1.5marginStarting Capital 100,000 100,000 100,000Net Profit( 153) 128,881( 25,396)Net Profit %0%129%-25%Annualized Gain0%9%-3%Total CommissionDividends ReceivedNumber of TradesAverage Bars HeldWin RateMaximum Drawdown( 2,759) 8,49817543.1250%( 35,207) 0 11,75318341.2851%( 42,615)( 3,156) 10,96920037.8648%( 82,881)Sharpe Ratio0.070.72-0.02Source: Wealth Lab Pro portfolio simulation for 2001-201126
Dow 30 Survivorship BiasC and AIG Dropped from IndexStarting CapitalNet ProfitNet Profit %Ideal Dow Now 100,000.00 394,824.70394.82%Real Dow with C, AIG 100,000.00 143,848.00143.85%Annualized Gain17.35%9.33%Total Commission( 32,666.55)( 31,823.85)Dividends ReceivedNumber of TradesAverage Bars HeldWin Rate 46,728.262,0564.6360.60% 30,874.342,0034.7358.06%Maximum Drawdown( 124,441.49)( 107,296.36)Sharpe Ratio0.890.47Source: Wealth Lab Pro portfolio simulation for 2001-201127
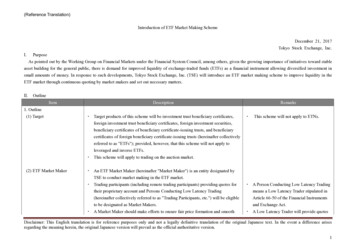
30-Day RoC Not ResilientiShares High RoC Varying Start DatesSource: Wealth Lab Pro portfolio simulation for 2001-201128
Optimizing RoC and Stop LossFor Free iShares RotationSource: Wealth Lab Pro portfolio simulation for 2001-201129
RoC Look-Back Period vs. ProfitiShares High MomentumSource: Wealth Lab Pro portfolio simulation for 2001-201130
Stop Loss vs. ProfitWealth-Lab Pro Simulation31
Longer RoC More ResilientBigger Profits TooiShares ETFs with Top 2 70-day RoC and 15% StopSource: Wealth Lab Pro portfolio simulation for 2001-201132
What I’m Trading Now Prune commission-free iShares ETFs IWB,IWD,IWF,IWM,IWN,IWO,IWV,LQD,MUB,SCZ,TIP 70-day RoC Monthly, pick top 2 high RoC ETFs Size 50% each 15% fixed stop loss33
Historical Performanceof 70-Day iShares ETF RotationStarting Capital 100,000Net Profit 278,688Net Profit %279%Annualized Gain14%Total CommissionDividends ReceivedNumber of TradesAverage Bars HeldWin RateMaximum Drawdown 0 47,8238158.9160%( 91,590)Sharpe Ratio0.91Source: Wealth Lab Pro portfolio simulation for 2001-201134
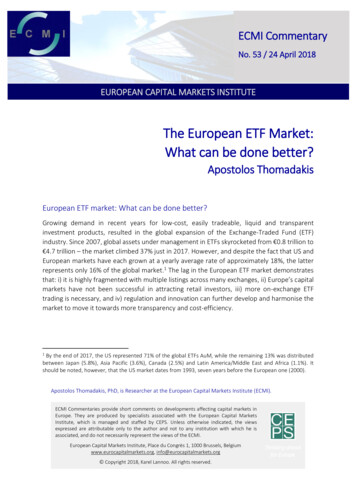
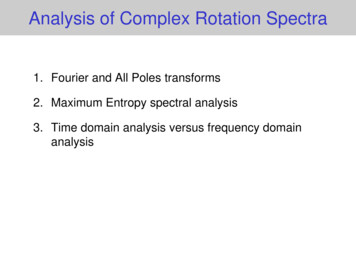
Simulated Equity CurveETF Rotation vs. S&P500 HoldSource: Wealth Lab Pro portfolio simulation for 2001-201135
My Tools36
Continuing Research Liquid ETFs Options Enhancement Finesse Ranking and Stops37
What It Takes to Succeed WithETF Rotation PlanSimple numeric comparison: counting 1 hour per month A little bit of self-discipline Show up for that hour per month Enter automatic stop loss orders Don’t mess with positions otherwiseWillingness to sell holdings on cue Market cooperation 38
Survey / Prize Drawing Please complete survey to be entered indrawing Fill in email address legibly Check YES or NO to receive more info39
Thank You!For more information see www.backtestingblog.com/signals/etfrotation Published article 0
of 70-Day iShares ETF Rotation 34 Starting Capital 100,000 Net Profit 278,688 Net Profit % 279% Annualized Gain 14% Total Commission 0 Dividends Received 47,823 Number of Trades 81 Average Bars Held 58.91 Win Rate 60% Maximum Drawdown ( 91,590) Sharpe Ratio 0.91