Transcription
Interbank network analysis
Key Question:If one bank were to face an adverse shock, howwould the rest of the banking / financial system beaffected?Potential Solution:Analysis using network modelling tools2
Outline Introduction Why network models? Approaches to network analysis Constructing a network graph3
Introduction ULTIMATE GOAL: A model to examine the role offinancial contagion in the banking system, which alsoseeks to obtain the aggregate losses for the financialsystem. Using network theory, we study the structure of thebanking system which is composed of banks thatare connected by their interbank bilateralexposures.4
Introduction Where are network models used? Intelligence agencies identify criminal and terroristnetworks from traces of communication that theycollect; and then identify key players in these networks. Social networking websites like Facebook identify andrecommend potential friends based on friends-offriends. Epidemiologists track spread of diseases. Central banks for mapping interlinkages between FIs.5
Introduction Among central banks, who is using them? Most central banks favour network analysis because Bank of England , Deutsche Bundesbank, European Central Bank,Reserve Bank of India, South African Reserve Bank etc.Visual understanding Uncover patterns in relationships or interactions which may not be readilyclear in the numbers. Follow the paths that information (liquidity, panic) follows in financialsystems.Once data is mapped as a network, it is easy to simulate thepropagation of systemic shocks and crises due to contagion.6
Why network models? Interconnectedness within the banking system proved tobe a key driver of systemic risk in the 2008 global financialcrisis. The crisis emphasised how network linkages andinteractions between banks are critical to understandingsystemic risk. It is important for financial stability analysts to have asound understanding of the level of and changes infinancial interconnectedness.7
Why network models? Viewing the banking system as a network is useful in analysing theeffects that the failure of a bank may produce. It is important to understand how the risk of systemic breakdownrelates to the type and number of institutions that comprise thebanking system. Furthermore, a study of the concentration of the banking system helpsus to focus on: the role of direct interbank connections as a source of systemic risk, the potential for knock-on defaults that are created by such exposures, how adequately capital regulation would address the risk of systemicbreakdown that arises in the banking sector.8
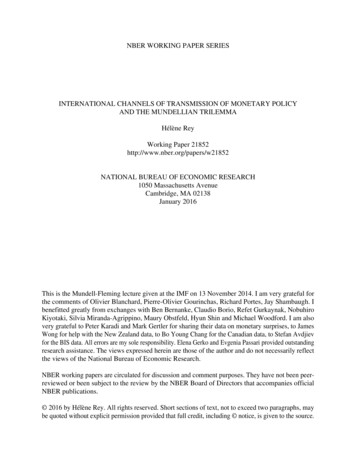
Why network models?Causes of simultaneous bankfailure, Nier (2008)feedback effectsfrom endogenousfire-sale of assets bydistressedinstitutionsdirect bilateralexposuresbetweenbankssimultaneousfailure ofbankscorrelatedexposures ofbanks to acommon sourceof riskinformationalcontagion9
Approaches to network analysis Allen and Gale (2000) Examine the different types of networks by completeness andinterconnected. The connections created within interbank system can guard againstliquidity shocks, although these same interlinkages may act ascatalyst for multiple bank failures in the event of default by a singleinstitution. In addition to investigating the response of different networkstructures to the risk of contagion, they conclude that completeclaims structures are shown to be more robust than incompletestructures.10
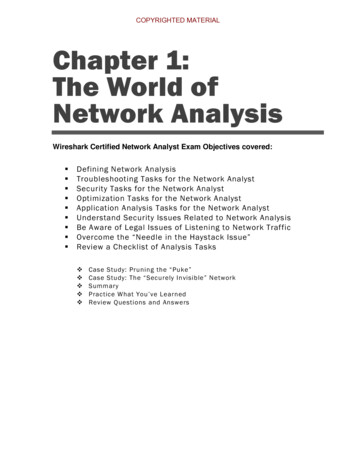
Approaches to network analysisTypes of networks, Allen and Gale (2000)Complete marketIncomplete marketstructurestructureDisconnectedincomplete marketstructure11
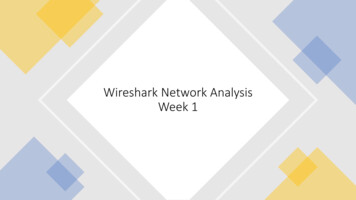
Approaches to network analysis Sachs (2010) Makes assumptions such as maximum entropy regarding thestructure of interbank exposures . Finds that the stability of a financial system depends not only onthe completeness and interconnectedness of the network, but alsoon the distribution of interbank exposures within the network. A network with money centres with asset concentration amongcore banks is likely to be more unstable than systems with banks ofhomogeneous size in a random network. A money centre is a network system where few large banks are stronglyinterconnected and a large number of small banks in the periphery areonly connected to one core bank but not to other banks in the network.12
Approaches to network analysisA money centre model with 3 core banks, Sachs (2008)13
Approaches to network analysis Minou and Reyes (2012): Analyse the global banking network for 184 countries during 1978-2010. Density of the global banking network defined by cross-border banking flows is pro-cyclical,expanding and contracting with the global cycle of capital flows. Connectedness in the network tends to rise before banking and debt crises and fall in theaftermath. Iori et al (2008), Nier et al (2008) and Li et al (2010) apply the theory of complexnetworks in describing the interbank market. Bank of Uganda: Define the credit lending relationships of banks in the Ugandan interbank market using networktheory, enabling the study of various degrees of connectivity in the network over time in asystematic way. Examine how small changes in the underlying parameters can have a significant impact on thestability of networks.14
Constructing a network graph Type of data for interbank network analysis varies; Direct interbank market bilateral exposures For different types of markets and transactions e.g. secured andunsecured lending, FX exposures, swaps, securities Data from payments systems Vary by size of transactions Analysis can be performed for varied frequencies e.g. daily,weekly or monthly. Data is arranged in an adjacency matrix to reflect bilateralexposures.15
Constructing a network graph Each bank is represented by a node on the network,and the bilateral interbank exposures of each bankdefine the links with other banks. These links may be directed or undirected Directed network: interbank connections comprise bothassets and liabilities; no netting of exposures isassumed. Undirected networkAlso, network may be weighted or unweighted.16
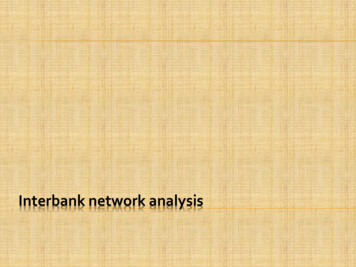
Constructing a network graphUnweighted 10G00000000000000H0000000000000017
Constructing a network graphUnweighted networks18
Constructing a network graphWeighted 0000000019
Constructing a network graphWeighted networks20
Properties of the interbank network In order to gain a deeper understanding of the dynamic’s of theinterbank system, we consider a range of commonly used indicators ofcohesion, centrality and distribution as aggregate network measures. These indicators are used to investigate the statistical and structuralproperties of the interbank system. Centrality measures enable us to study the distribution of banks withinthe network and determine their power, influence and control; Cohesion measures reveal key relationships within the interbank market interms of connectivity, Distance measures offer insight into the span of the network and howdifferent types of information may flow through the interbank market.21
Centrality and distribution Degree centrality: The degree of a node is the number of edges connectedto that node. In terms of the interbank network, this indicates thenumber of other banks that a given bank has lending andborrowing relationship with. The greater the total degree of a bank, the higher is theinterconnectedness of the bank to other banks in thesystem through interbank lending.22
Centrality and distribution Average network degree 11123127300033001231231225121100000623
Centrality and distribution Clustering coefficient: Measures the density of connections around a single node andenables us to determine the proportions of nearest neighbours of anode that are linked to each other. A measure of connectedness between a node’s neighbours The clustering co-efficient is used to check if a certain group ofbanks transact or interacts within itself, and more importantly howthis behaviour changes over time. A high network clustering coefficient means that any two banksthat already transact with a third bank are more likely to maintainthis relationship than to establish new connections with any otherbank in the network.24
Centrality and distributionBANK Average clusteringcoefficient 0.027ABCDEFGHIJKLMNCLUSTERING 00.0000.0000.0000.0000.0000.04825
Centrality and distribution Neighbouring banks that share mutual relationsare more likely to share the burden of a potentialdefault and are at the same time more likely tosuffer from contagion. However,no benchmark for this measure so it’s bestto analyse it over time.26
Centrality and distribution Betweenness centrality: Definedas the number of shortest paths from allvertices to all others that pass through that node. Capturesthe frequency with which a given bank lieson the shortest path between all sets of possiblebank pairs within the sample.27
Centrality and distributionBANKABCDEFGHIJKLMNBETWEENNESS 0000.0002.3336.9000.0001.40039.60028
Centrality and distribution Betweenness centrality: Presumably, if a bank is part of many paths that connectother banks to each other, then it is likely to haveinformational or relational importance within thenetworks since it is vital in connecting banks to eachother. Captures the importance of a bank not only in the firstdegree (direct) links but also in the multiple-degree(indirect) links that connect any given pair of banks.29
Centrality and distribution Closeness centrality: Closeness can be regarded as a measure of how long itwill take to spread information from one node to allother nodes sequentially Ameasure of the speed with which information spreadsthrough the network from a specific bank In the interbank network, this bank would facilitate theefficient spread of liquidity, as well as the rapid spread ofshocks.30
Centrality and distributionBANKABCDEFGHIJKLMNCLOSENESS 0.0280.0330.0380.0270.0360.05031
Centrality and distribution Strength: Defined as Determinethe sum of a bank’s assets and liabilities.the actual weight of each node, that is,the size of the trades through that node. Fordirected network, compute in-strength and out-strength: Abank with high in-strength is a strong borrower, while abank with high out strength is a strong lender.32
Centrality and 3.5137.5148.433
Cohesion and connectivity Network density: 0.2088 An aggregate measure of connectivity, represents theprobability of any two random banks within the markettransacting with each other. It is computed as the number of links observed in thenetwork at a given time divided by the total number ofpossible links. For the interbank liability network, a high densitytherefore reflects a very active interbank market withmany lending relationships amongst participants.34
Cohesion and connectivity Network density: 0.2088 While high network density holds the benefits of greater riskdiversification, this may not hold if the exposures exceed the level ofconnectivity, thus increasing contagion risk. The cohesion between banks that is beneficial in normal times can lead tocontagion during stressed periods. Nevertheless, a certain level of network density must be maintained inorder to guard against the impact of contagion risk While high density increases the network’s vulnerability to shocks,allowing them to spread through network faster, it is possible thatdepending on banks’ capital levels, the impact of the shock would bequickly absorbed.35
Cohesion and connectivity Simple measures of cohesion and connectivity: Number of nodes Number of links (edges) Cohesion measures best compared across timesince there are no widely accepted benchmarks.36
Distance measures Average path length and networkdiameter help to identify howquickly information is spreadthrough an entire network.A reduction in these indicatorswould mean two things; Increased market efficiency regardsdistribution of funding or, Increased vulnerability to contagionrisk as a sudden shock would betransmitted through fewer banks.AVERAGEPATH LENGTH2.1DIAMETER4.037
Conclusion The level of completeness and connectivity in the interbank marketmay vary over short periods as market participants adjust to severalfactors including their level of available funding, interest rates in theinterbank market, financial performance of banks, among others. Further explore the network topology of the interbank market for bothsecured and unsecured claims, Determine the source and likelihood of initial shocks to the market andstudy the distribution of losses. Work on interbank network analysis should contribute to thedevelopment of a stress testing framework for assessing systemic risk.38
Network analysis aides Gephi https://gephi.org/ An interactive visualization and exploration open-sourceplatform for all kinds of networks and complex systems,dynamic and hierarchical graphs.NodeXL http://nodexl.codeplex.com/ Open-source template for Microsoft Excel 2007, 2010 and(possibly) 2013 that makes it easy to explore network graphs39
REFERENCES Allen, F and Gale, D (1998), ‘Optimal financial crises’, Journal of Finance, Vol.53 (4), pages 1,245-84 Allen, F and Gale, D (2000), ‘Financial contagion’, Journal of Political Economy, Vol.108 (1), pages 1-33 Anand, K, Gai, P, Kapadia, S, Brennan, S, Willison, M (2011), ‘A network model for financial system resilience’ Babus, A (2005), ‘Contagion risk in financial networks’, Tinbergen Institute, Erasmus Universiteit Rotterdam Canedo, J.M.D, Martinez-Jaramillo, S, ‘Financial contagion: a network model for estimating the distribution of losses forthe financial system’ De Masi, G, Iori, G, Caldarelli, G (2008), ‘The Italian interbank network: statistical properties and a simple model’,Department of Economics, City University, London, England Gai, P, Haldane, A and Kadapia, S (2011), ‘Complexity, concentration and contagion’ Li, S, He, J, and Zhuang, Y (2010), ‘A network model of the interbank market’ Mistrulli, P.E (2008), ‘Assessing financial contagion in the interbank market: maximum entropy versus observedinterbank lending patterns’ ‘Newman, M.E.J, ‘Random graphs as models of networks’, Santa Fe Institute Nier, E, Yang, J, Yorulmazer, T, and Alentorn, A (2008), ‘Network models and financial stability’, Working Paper No.346,Bank of England Sachs, A (2010), ‘Completeness, interconnectedness and distribution of interbank exposures – a parameterised analysisof the stability of financial networks’ Deutsche Bundesbank40
unsecured lending, FX exposures, swaps, securities Data from payments systems Vary by size of transactions Analysis can be performed for varied frequencies e.g. daily, weekly or monthly. Data is arranged in an adjacency matrix to reflect bilateral exposures. 15