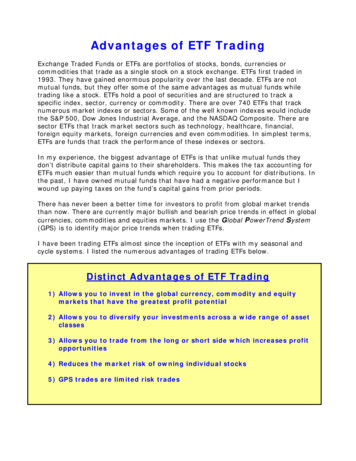
Transcription
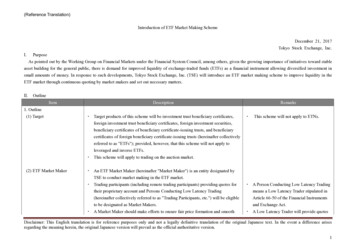
ECMI CommentaryNo. 53 / 24 April 2018EUROPEAN CAPITAL MARKETS INSTITUTEThe European ETF Market:What can be done better?Apostolos ThomadakisEuropean ETF market: What can be done better?Growing demand in recent years for low-cost, easily tradeable, liquid and transparentinvestment products, resulted in the global expansion of the Exchange-Traded Fund (ETF)industry. Since 2007, global assets under management in ETFs skyrocketed from 0.8 trillion to 4.7 trillion – the market climbed 37% just in 2017. However, and despite the fact that US andEuropean markets have each grown at a yearly average rate of approximately 18%, the latterrepresents only 16% of the global market.1 The lag in the European ETF market demonstratesthat: i) it is highly fragmented with multiple listings across many exchanges, ii) Europe’s capitalmarkets have not been successful in attracting retail investors, iii) more on-exchange ETFtrading is necessary, and iv) regulation and innovation can further develop and harmonise themarket to move it towards more transparency and cost-efficiency.1By the end of 2017, the US represented 71% of the global ETFs AuM, while the remaining 13% was distributedbetween Japan (5.8%), Asia Pacific (3.6%), Canada (2.5%) and Latin America/Middle East and Africa (1.1%). Itshould be noted, however, that the US market dates from 1993, seven years before the European one (2000).Apostolos Thomadakis, PhD, is Researcher at the European Capital Markets Institute (ECMI).ECMI Commentaries provide short comments on developments affecting capital markets inEurope. They are produced by specialists associated with the European Capital MarketsInstitute, which is managed and staffed by CEPS. Unless otherwise indicated, the viewsexpressed are attributable only to the author and not to any institution with which he isassociated, and do not necessarily represent the views of the ECMI.European Capital Markets Institute, Place du Congrès 1, 1000 Brussels, Belgiumwww.eurocapitalmarkets.org, info@eurocapitalmarkets.org Copyright 2018, Karel Lannoo. All rights reserved.Thinking aheadfor Europe
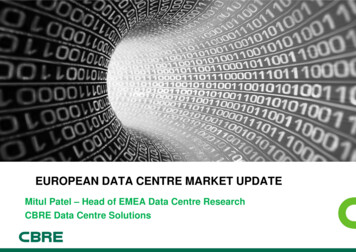
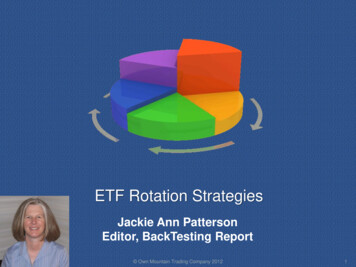
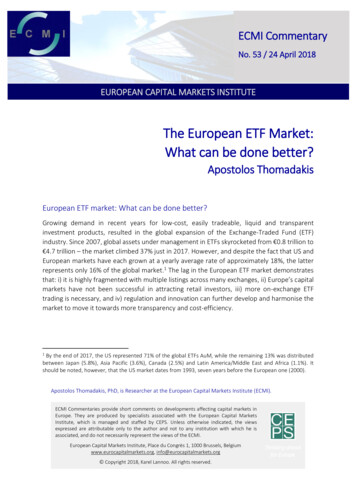
2 APOSTOLOS THOMADAKISFigure 1. ETFs’ assets under management ( 132014201520162017GlobalSource: ETFGI.What is an ETF?An ETF is a fund that seeks to replicate the performance of a benchmark index, by buying thesecurities that make up that index or through synthetic replication using derivatives.2 ETFs havebeen described as “genuine financial innovation” (Madhavan, 2016), as they combine thecharacteristics of both traditional open-end mutual funds (OEMFs) and those of closed-endfunds (CEFs).3 The special feature of an ETF is that its shares can be created or redeemed at theend of the day (like an OEMF), but at the same time can be bought and sold on the exchangeintraday (like a CEF). In other words, it combines primary dealing with secondary trading; theformer happens at the fund’s net asset value, while the latter at a mutually agreed spot price.2According to the Markets in Financial Instruments Directive (MiFID II, Directive 2014/65/EU) an ETF is “ a fundof which at least one unit or share class is traded throughout the day on at least one trading venue and with atleast one market maker which takes action to ensure that the price of its units or shares on the trading venue doesnot vary significantly from its net asset value and, where applicable, from its indicative net asset value”.3In an OEMF, individual investors interact with the fund directly and buy/sell (i.e. subscription/redemption) sharesat the end of the day at the fund’s net asset value (NAV). If more investors subscribe to the fund, its assets andthe number of shares outstanding increases. This process of creation and redemption is called primary process.On the other hand, in a CEF, investors buy/sell shares on the exchange intraday. Given that the size of the fund isfixed (i.e. closed-end) both in terms of asset and shares, secondary market liquidity determines the price at whichshares are bought or sold.
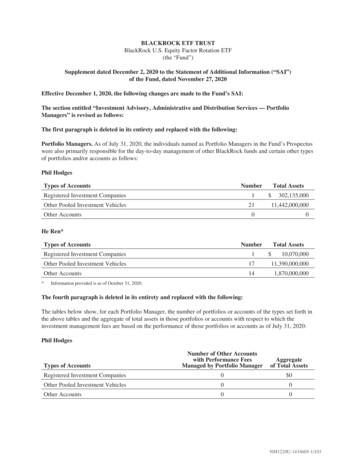
THE EUROPEAN ETF MARKET: WHAT CAN BE DONE BETTER? 3Table 1. Key characteristics of fundsCharacteristicExchange-tradedOpen-end fundNoDirectly from the fundAvailabilityPortfolio disclosureShares outstandingMonthly or quarterlyChanges due toissuances andredemptionsEnd-of-day NAVPricingLiquidityEnd-of-day only(primary market)Closed-end fundNoFrist through IPO andthen on exchange (openmarket)Monthly or quarterlyFixedExchange-traded fundYesOn exchange/From the fundMarket price(determined by supplyand demand)Primary market: NAVIntraday: at premium ordiscount to NAV(secondary market)Daily (real-time)Changes due to issuancesand redemptionsSecondary market: marketpriceIntraday (secondary market)End of day (primary market)Source: Author’s elaboration based on BlackRock (2017).However, only a small number of pre-approved institutional investors have the right to investdirectly in the fund (i.e. end-of-day trades) – they known as participating dealers (PDs) orauthorised participants (APs). This implies that PDs deal directly with ETFs while retail or otherinstitutional investors access the ETF by trading on exchange or over-the-counter (OTC)through a secondary market. Therefore, PDs are acting as intermediaries between the ETF andsecondary market investors, and thus are contributing to secondary market liquidity.4How are ETFs regulated?From a regulatory perspective, ETFs are traded on the main market and are therefore regulatedunder the Markets in Financial Instruments Directive. MiFID I, implemented in 2007,established a regulatory framework for the provision of investment services in financialinstruments by credit institutions and investment firms and for the operation of regulatedmarkets by market operators (though pre- and post-trade transparency requirements).5However, ETFs were not considered as MiFID instruments and thus there were no legalrequirements to make trading volumes public. This is what MiFID II is trying to achieve byextending the transparency regime to all trading venues for shares and certain equity-likeinstruments, such as ETFs.6 Since the beginning of this year, when MiFID II came into effect, allETF trades have to be reported, meaning investors are able to gain a clear picture of the depthand breadth of ETF trading activity across all European trading venues.4They can generate returns from: i) the difference between the NAV of the ETF and the aggregate price of theunderlying basket of securities, ii) the bid-ask spread of ETF shares traded on the secondary market, or iii)commissions and fees paid by clients for creating and redeeming ETF shares.5Directive 2004/39/EC.6Directive 2014/65/EU.
4 APOSTOLOS THOMADAKISAdditionally, the majority of European ETFs comply with the provisions of the Undertaking forCollective Investment in Transferable Securities (UCITS) Directive.7 The UCITS authorisation,which is recognised globally, is a guarantee of high and effective standards of disclosure andinvestor protection. The three most important provisions of a UCITS ETF are: i) diversification,so that no single holding is worth more than 20% of the fund’s NAV, ii) segregation, so thatfund’s assets are separated from those of the ETF provider under the supervision of anindependent custodian, and ii) liquidity, so that the ETF is liquid and open-ended and aninvestor can redeem his shares at any time.The first major regulatory initiative specifically directed at ETFs, occurred in 2012. The EuropeanSecurities and Markets Authority (ESMA) conducted a public consultation and establishedguidelines, which were then revised in 2014 and will be reviewed in 2018.8 These specific panEuropean rules for ETFs aim at further enhancing investor protection by requiring disclosure inthe prospectus (as well as in the key investor information document (KIID) and any marketingcommunication) of: i) the policy regarding portfolio transparency and where information maybe obtained and ii) specific risks related to secondary market investors (e.g. shares of the UCITSETF are generally not redeemable from the UCITS ETF itself).9What is the current situation?In Europe, ETF turnover totalled 721 billion in December 2017, up by 63% over Too many ETFsin too many2013. Despite the impressive performance, European turnover is equivalent toexchangesonly 5.5% of US market turnover at end-2017 ( 13.2 trillion). With regard tothe number of ETFs, an all-time high of 6,607 European ETFs were admitted forlisting on 23 exchanges, while the US had 2,085 ETFs on just three exchanges. However, just amere handful of exchanges dominate trading activity. Together, Euronext Paris, LSE andDeutsche Börse generate more than 85% of total European ETF turnover.The European Commission’s Capital Markets Union (CMU) Mid-term Review Participation ofretail investors(EC, 2017) acknowledged that the engagement of retail investors in capitalis limitedmarkets remains very low, and highlighted the need to encourage ETFinvestments. Capital market participation of retail investors is suffering from ahigh degree of risk aversion and a heavy reliance on pay-as-you-go pension systems. As a result,currency and bank deposits (35%), insurance and pension fund reserves (32%) and equity (20%)make up the lion’s share of household financial assets, while just 10% is held in investment7Directive 2009/65/EC.8Consultation paper: ESMA’s guidelines on ETFs and other UCITS issues (ESMA/2012/44); Report and Consultationpaper: Guidelines on ETFs and other UCITS issues (ESMA/2012/474); Guidelines for competent authorities andUCITS management companies: Guidelines on ETFs and other UCITS issues (ESMA/2014/937); 2018 WorkProgramme (ESMA20-95-619).9Except cases where the stock exchange value of the shares of the UCITS ETF significantly varies from its net assetvalue, for example in cases of market disruption leading to the absence of a market maker. Therefore, the UCITSETF is required to disclose the process for this direct redemption option in its prospectus, as well as the potentialcosts involved.
THE EUROPEAN ETF MARKET: WHAT CAN BE DONE BETTER? 5funds.10 In contrast, 22% of the household financial assets in the US are held in investmentfunds (ICI, 2017). Particularly for ETFs, while retail accounts for around 45% of the US market,in Europe it is estimated at between 10-15% (Euroclear, 2017).Much of theETF tradingtakes placeoff-exchangeIn order for retail investors to participate in capital markets, they need access to attractiveinvestment propositions on competitive and transparent terms. While ETFs are successful indelivering the former, they fail – so far – to deliver the latter. MiFID I, implemented in 2007, didnot recognise ETFs as an asset class, and therefore not all transactions had to be reported. Thisled to most of the market being traded bilaterally. It is difficult to tell exactly how much ETFtrading takes place off-exchange, as figures are not publicly available, but estimates indicatethat around 70% of all European ETF trading is taking place over the counter (OTC) and only30% on-exchange, while the proportions are reversed in the US (AMF, 2017).Much of theon-exchangeactivity isdue toinstitutionalinvestorsGiven the small share of European ETF trading that takes place on-exchange, as well as the verylow participation of retail investors in the market, it is natural to think that much of the onexchange activity is due to the participation of retail investors. However, this does not appearto be entirely correct. Although the average trade size in EU exchanges ( 48,395) is nearlydouble that on their US counterparts ( 25,922), its distribution between electronic order book(EOB) and negotiated deals (ND), is very lop-sided.11 On European exchanges, the average sizeof EOB transactions is just 12% ( 30,420) of the average size of ND ( 256,000). In stark contrast,the average size of EOB and ND transactions on US exchanges is almost identical ( 27,642 and 23,698, respectively).12Bilaterally negotiated trading involves no exchange costs and allows for much bigger trades(larger deals) – in direct interactions, investors can agree to trade any level of ETF shares, asopposed to being subject to minimum clip sizes in the case of exchange trading. However, whiletrading through an electronic order book incurs commission costs and brokerage fees, itbenefits from the transparency and better execution implicit in being subject to regulation andtherefore EOB transactions are typically used by retail investors. Larger trades – often part ofinstitutional portfolio rebalancing or dealer inventory management (liquidity trades) – aretypically negotiated bilaterally, so it appears that either institutional investors or large retail10Equity includes listed/unlisted shares and other equity. Debt securities account for 3% of financial assets. Datarefer to 2017Q3. ECB Statistical Warehouse.11Trades through an electronic order book (EOB) are placed by trading members and are usually exposed to allmarket users. They are automatically matched according to precise rules set up by the exchange, generally on aprice/time priority basis. On the other hand, trades carried out through negotiated deals are confirmed through asystem managed (directly or indirectly) by the exchange, where both seller and buyer agree on the transaction(price and quantity). This system checks automatically if the transaction is compliant with the exchange’s rules,and in most cases if there is consistency with the EOB price. Figures are author’s elaboration using data from FESEand WFE.12Off-exchange venues, which serve institutional investors, are becoming important players in the market. Forexample, Tradeweb – one of the largest institutional ETF trading venues in Europe – reports that more than 165billion in European-listed ETFs were traded through its electronic request for quote (RFQ) system in 2017, with anaverage trade size of 2.5 million.
6 APOSTOLOS
value, for example in cases of market disruption leading to the absence of a market maker. Therefore, the UCITS ETF is required to disclose the process for this direct redemption option in its prospectus, as well as the potential costs involved. Too many ETFs in too many exchanges Participation of retail investors is limited . THE EUROPEAN ETF MARKET: WHAT CAN BE DONE BETTER? 5