Transcription
WHAT IS A STATISTICAL QUESTION?TEACHER VERSIONSubject Level:Middle School MathGrade Level:6Approx. Time Required:60-75 minutesLearning Objectives: Students will be able to distinguish between statistical questions and other types of questions. Students will be able to formulate and answer their own statistical questions, drawingconclusions based on those answers. Students will be able to understand the concept of variability within a data set.
WHAT IS A STATISTICAL QUESTION? TEACHER VERSIONActivity DescriptionStudents will identify which questions about a data set are statistical questions andwhich are not. Then they will generate, answer, and draw conclusions from their ownstatistical questions.Suggested Grade Level:6Approximate Time Required:60-75 minutesLearning Objectives: Students will be able to distinguish between statistical questions and other types of questions. Students will be able to formulate and answer their own statistical questions, drawing conclusionsbased on those answers. Students will be able to understand the concept of variability within a data set.Topic: Statistical questionsCENSUS.GOV/SCHOOLS Skills Taught: Creating statistical questions Identifying statistical questionsMATH PAGE 1
WHAT IS A STATISTICAL QUESTION? TEACHER VERSIONMaterials Required The student version of this activity, 10 pagesActivity ItemsThe following items are part of this activity. The items, their sources, and any relevant instructions for viewingthem online appear at the end of this teacher version. Item 1: Radio Set Ownership Map Item 2: Map of U.S. Regions and the Land Areas of the 50 U.S. States and District of ColumbiaFor more information to help you introduce your students to the U.S. Census Bureau, read“Census Bureau 101 for Students.” This information sheet can be printed and passed out to your students as well.Standards AddressedSee charts below. For more information, read“Overview of Education Standards and Guidelines Addressed in Statistics in Schools Activities.”Common Core State Standards for 16 SP – Statistics &ProbabilityRecognize a statistical question as one that anticipatesvariability in the data related to the question and accountsfor it in the answers. For example, “How old am I?” is nota statistical question, but “How old are the students in myschool?” is a statistical question because one anticipatesvariability in students’ ages.CENSUS.GOV/SCHOOLS ClusterDevelop understanding ofstatistical variability.MATH PAGE 2
WHAT IS A STATISTICAL QUESTION? TEACHER VERSIONCommon Core State Standards for Mathematical PracticeStandardCCSS.MATH.PRACTICE.MP1. Make sense of problems and persevere in solving them.Students will examine census data to create and answer their own statistical questions.CCSS.MATH.PRACTICE.MP3. Construct viable arguments and critique the reasoning of others.Students will share their questions, explain why they are good statistical questions, and critique each other’sreasoning.National Council of Teachers of Mathematics’ Principles and Standards for School MathematicsContent StandardStudents should be able to:Expectation for Grade BandData Analysis andProbabilityFormulate questions that can beaddressed with data and collect,organize, and display relevant datato answer them.Formulate questions, design studies, andcollect data about a characteristic shared bytwo populations or different characteristicswithin one population.Guidelines for Assessment and Instruction in Statistics EducationGAISEFormulate QuestionsLevel ALevel BLevel CXCollect DataAnalyze DataXInterpret ResultsXCENSUS.GOV/SCHOOLS MATH PAGE 3
WHAT IS A STATISTICAL QUESTION? TEACHER VERSIONBloom’s TaxonomyStudents will apply what they know about statistical questions and analyze questions to determine whether theyare erstandingRememberingCENSUS.GOV/SCHOOLS MATH PAGE 4
WHAT IS A STATISTICAL QUESTION? TEACHER VERSIONTeacher NotesBefore the ActivityStudents must understand the following key terms: Statistical question – a question that can be answered by collecting data and that anticipates variability inthose data Statistics – the science of collecting, reviewing, and analyzing dataStudents should have a basic understanding of the following concept: Categorical data (e.g., colors, ice cream flavors) are different from numerical data (e.g., heights, weights,measures of time).During the ActivityTeachers will ask students what makes a good statistical question and lead a discussion about their responses.Teachers should help students understand that there are two main features of statistical questions: that theycan be answered by collecting data and that there will be variability in those data.Teachers should closely monitor students as they complete the activity, stopping the class after each part tolead a discussion about the answers. It is especially important that teachers reveal the correct answers to thequestions in part 1 so that students can complete parts 2 and 3 successfully.Teachers should understand that part 4 is optional because it extends well beyond recognizing statisticalquestions; however, teachers may find that it is appropriate for advanced students. If teachers do decide toinclude part 4, which adds 10–15 minutes to the total activity time, they may want to make sure each studenthas a straight edge to read the data across years.After the ActivityTeachers will have students share their questions from part 3 with the class, encouraging them to explain whythey are good statistical questions and to critique each other’s reasoning.Extension Ideas Teachers could have students choose a topic that interests them, formulate statistical questions aboutthat topic, and collect and analyze their own data. To adapt this activity to GAISE Level A, teachers could: Create the questions for part 3 that students must determine are or are not statistical. Create nonstatistical questions that students must turn into statistical questions for part 3.CENSUS.GOV/SCHOOLS MATH PAGE 5
WHAT IS A STATISTICAL QUESTION? TEACHER VERSIONStudent ActivityClick here to download a printable version for students.Activity ItemsThe following items are part of this activity and appear at the end of this student version. Item 1: Radio Set Ownership Map Item 2: Map of U.S. Regions and the Land Areas of the 50 U.S. States and District of ColumbiaStudent Learning Objectives I will be able to distinguish between statistical questions and other types of questions. I will be able to formulate and answer my own statistical questions, drawing conclusions basedon those answers. I will be able to understand the concept of variability within a data set.A statistical question is a question that can be answered by collecting data that vary. For example, “How oldam I?” is not a statistical question, but “How old are the students in my school?” is a statistical question. Thisis because to answer the second question, you would need to determine the ages of all students in your schooland there would be variability in those data (since not all students are the same age).CENSUS.GOV/SCHOOLS MATH PAGE 6
WHAT IS A STATISTICAL QUESTION? TEACHER VERSIONPart 1 – Determine If Questions Are StatisticalImagine you want to find out about the height of students in your class using statistics. Read each questionbelow and decide if it is a statistical question. Then explain your answer.QuestionIs itstatistical?(Yes/No)ExplanationNoThe answer is just my height so there is novariability in the data.How tall, in inches, was Marco on hislast birthday?NoThe answer is just Marco’s height on his lastbirthday so there is no variability inthe data.3How tall are the students in your class,in centimeters?YesThe students in my class are not all thesame height so there would be variabilityin the data.4Is Preston taller than 60 inches?NoTo answer this question, you just haveto know Preston’s height, so there is novariability in the data.5How do the heights of the students inyour class compare with the heights ofall sixth-graders in your school?YesTo answer this question, you would need toknow the heights of all the students in myclass and the heights of all the sixth-gradersin the school, so there would be variability inthe data.YesTo answer this question, you would need toknow the heights of all the sixth-graders andthe heights of all the seventh-graders in ourschool, so there would be variability inthe data.YesTo answer this question, you would need toknow the heights of all the sixth-graders inthe school and the heights of all the sixthgraders in a school in another country, sothere would be variability in the data.1How tall are you?267How do the heights of the sixth-gradersin your school compare with the heightsof the seventh-graders in your school?How do the heights of the sixth-gradersin your school compare with the heightsof sixth-graders in a school in anothercountry?CENSUS.GOV/SCHOOLS MATH PAGE 7
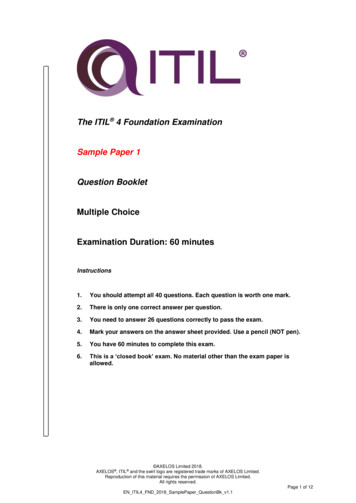
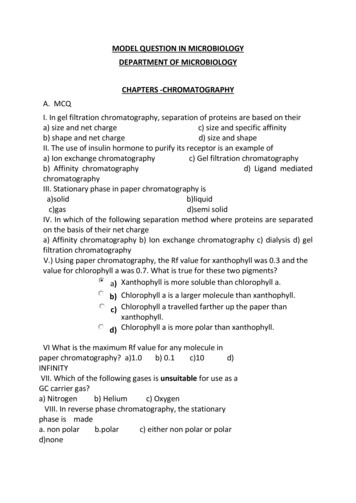
WHAT IS A STATISTICAL QUESTION? TEACHER VERSIONPart 2 – Look at Data and Statistical Questions1. Review Item 1: Radio Set Ownership Map, which shows the percentage of families that owned a radio ineach U.S. state in 1930, and record any observations about the data.Student answers will vary but could include: Northern states had higher percentages of familieswith radios than southern states in 1930.2. Determine which questions in the table below are statistical and if they could be answered using the datain Item 1. (You don’t have to actually find the answers to the questions!)Question1What percentage of familiesin Florida had a radio set in1930?2 Which region of the UnitedStates had the lowest rates ofradio set ownership in 1930?3In 1930, how much did theradio ownership rates fordifferent states vary?4 In 1930, why did a greaterpercentage of families inCalifornia own a radio setcompared with families innearby states?CENSUS.GOV/SCHOOLS Is itstatistical?(Yes/No)NoYesYesYesCould it beanswered withdata from Item1? (Yes/No)YesExplanationThe answer is just the percentagefor Florida from Item 1, so there is novariability in the data.YesTo answer this question, you wouldneed to look at the percentage ineach state for the different regions inItem 1, so the data would vary.YesTo answer this question, you wouldneed to look at the percentages offamilies with radios for all statesin Item 1, and there is variability inthose data.NoTo answer this question, you wouldneed to look at different reasons thatfamilies in California and in otherstates owned a radio (like how muchmoney they have), and there wouldbe variability in those data. However,this question could not be answeredusing data from Item 1 because thosedata are not shown.MATH PAGE 8
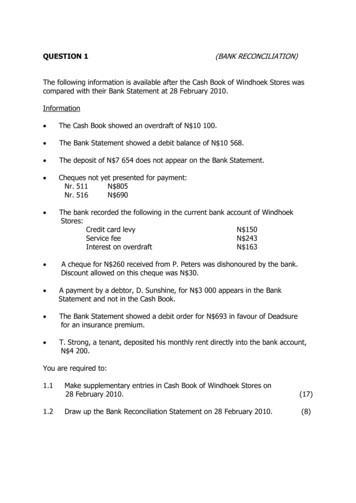
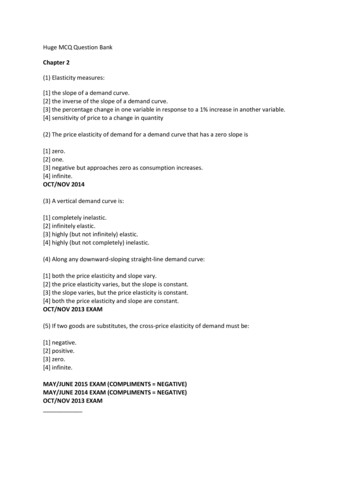
WHAT IS A STATISTICAL QUESTION? TEACHER VERSIONPart 3 – Write Your Own Statistical QuestionsUse Item 2: Map of U.S. Regions and the Land Areas of the 50 U.S. States and District of Columbia, wherestates are listed in order from largest to smallest area, to complete the following prompts: Write three statistical questions that you could answer using data from Item 2. Use data from Item 2 to actually answer each question. Explain how you found each answer. Draw a conclusion about what your answer means for the larger data set. Write a related question for each of your statistical questions (but don’t answer this one).ExampleQuestion: How do the areas of each of the three states on the West Coast vary?Answer: Washington 71,298 square miles; Oregon 98,379 square miles;California 163,695 square milesExplanation: I found these areas by locating each state in the table.Conclusion: Each of the three states on the West Coast has a different area, ranging from about 71,000 to164,000 square miles.Related Question: How do the areas of the states on the West Coast compare with the areas of the stateson the East Coast?Student responses below will vary.Question 1:Answer:Explanation:Conclusion:Related Question:CENSUS.GOV/SCHOOLS MATH PAGE 9
WHAT IS A STATISTICAL QUESTION? TEACHER VERSIONQuestion 2:Answer:Explanation:Conclusion:Related Question:Question 3:Answer:Explanation:Conclusion:Related Question:CENSUS.GOV/SCHOOLS MATH PAGE 10
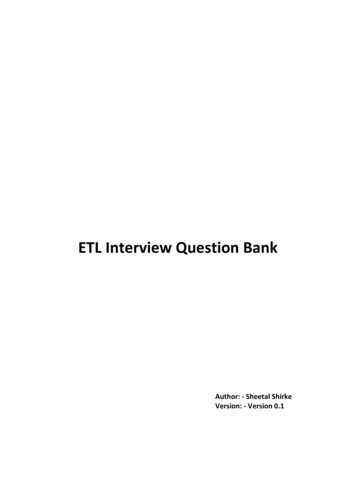
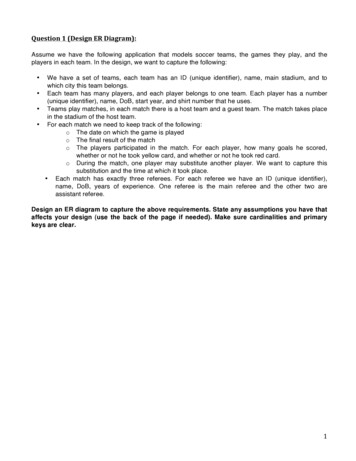
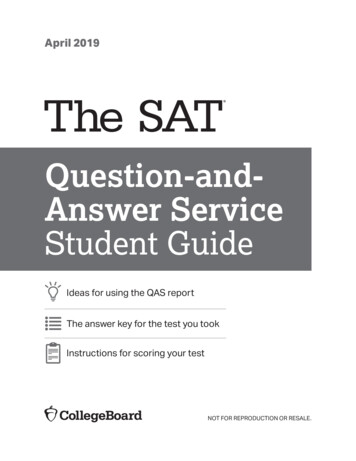
WHAT IS A STATISTICAL QUESTION? TEACHER VERSIONPart 4 – Draw Conclusions From a Graph (Optional)The following graph shows the percentages of people aged 3 and older in the United States who were enrolledin school at different levels — ranging from nursery school (pre-K) to college — from 1955 to 2016.Distribution of School Enrollment of the U.S. Population 3 Years and Older, by Level:Figure A-1. Distribution of School Enrollmentof the U.S. Population 3 Years and Over, by1955 to 2016Level, 1955 to 2016100%College90%80%70%High School60%50%40%Elementary School30%20%10%0%1955KindergartenNursery 2016Data on nursery school enrollment not available from 1955 to 1963Source: U.S. Census Bureau, Current Population gure%20A-1 2016.pdfCENSUS.GOV/SCHOOLS MATH PAGE 11
WHAT IS A STATISTICAL QUESTION? TEACHER VERSION1. Examine the graph and write down any observations about the data or the graph.Student answers will vary but could include: The percentage of people attending college increased overall. The college enrollment rate spiked in the early 1990s. The percentage of people enrolled in high school stayed about the same overall. The percentage of people in nursery school/pre-K increased. All the different-colored bands added together make 100 percent. The graph does not show the actual numbers of people enrolled in school at the various levels. It appears that no one went to nursery school before about 1963, or maybe the nursery schooldata just weren’t collected before that year.2. Write a statistical question that can be answered using data in the graph, answer your question, explainhow you found the answer, and write a concluding statement about your answer:Student responses below will .GOV/SCHOOLS MATH PAGE 12
WHAT IS A STATISTICAL QUESTION? TEACHER VERSIONItem 1: Radio Set Ownership c/housing/radios.pdfCENSUS.GOV/SCHOOLS MATH PAGE 13
WHAT IS A STATISTICAL QUESTION? TEACHER VERSIONItem 2: Map of U.S. Regions and the Land Areas of the 50 U.S. States and District of /maps/reference/us regdiv.pdfCENSUS.GOV/SCHOOLS MATH PAGE 14
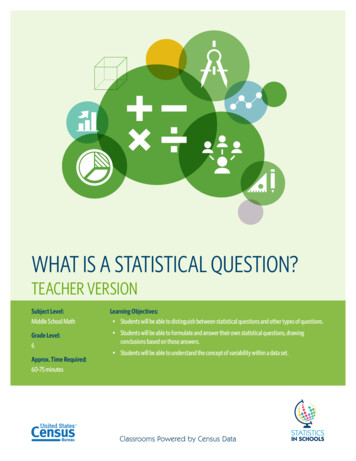
WHAT IS A STATISTICAL QUESTION? TEACHER VERSIONItem 2: Map of U.S. Regions and the Land Areas of the 50 U.S. Statesand District of Columbia (Continued)StateUnited States1Area in Square MilesStateArea in Square Miles3,796,742Iowa56,273Alaska665,384New York54,555Texas268,596North na147,040Alabama52,420New o83,569South Carolina32,020Kansas82,278West ,93210,554South Dakota77,116Washington71,298MassachusettsNorth Dakota70,698Vermont9,616Oklahoma69,899New Hampshire9,349Missouri69,707New 5,496Delaware2,489Georgia59,425Rhode Island1,545Illinois57,914District of Columbia168Includes all 50 states and the District of nce-files/2010/geo/state-area.htmlClick on the link above to view the 2010 source data online.CENSUS.GOV/SCHOOLS MATH PAGE 15
states are listed in order from largest to smallest area, to complete the following prompts: Write three statistical questions that you could answer using data from Item 2. Use data from Item 2 to actually answer each question. Explain how you found each answer. Draw a conclus