Transcription
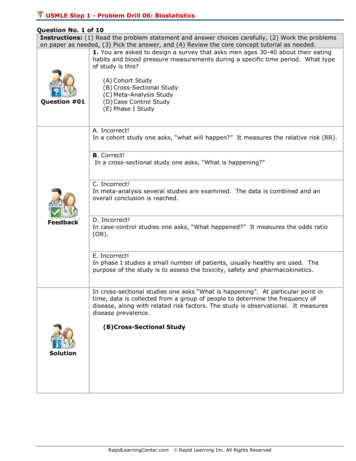
USMLE Step 1 - Problem Drill 06: BiostatisticsQuestion No. 1 of 10Instructions: (1) Read the problem statement and answer choices carefully, (2) Work the problemson paper as needed, (3) Pick the answer, and (4) Review the core concept tutorial as needed.1. You are asked to design a survey that asks men ages 30-40 about their eatinghabits and blood pressure measurements during a specific time period. What typeof study is this?Question #01(A) Cohort Study(B) Cross-Sectional Study(C) Meta-Analysis Study(D) Case Control Study(E) Phase I StudyA. Incorrect!In a cohort study one asks, “what will happen?” It measures the relative risk (RR).B. Correct!In a cross-sectional study one asks, “What is happening?”C. Incorrect!In meta-analysis several studies are examined. The data is combined and anoverall conclusion is reached.FeedbackD. Incorrect!In case-control studies one asks, “What happened?” It measures the odds ratio(OR).E. Incorrect!In phase I studies a small number of patients, usually healthy are used. Thepurpose of the study is to assess the toxicity, safety and pharmacokinetics.In cross-sectional studies one asks “What is happening”. At particular point intime, data is collected from a group of people to determine the frequency ofdisease, along with related risk factors. The study is observational. It measuresdisease prevalence.(B)Cross-Sectional StudySolutionRapidLearningCenter.com Rapid Learning Inc. All Rights Reserved
Question No. 2 of 10Instructions: (1) Read the problem statement and answer choices carefully, (2) Work the problemson paper as needed, (3) Pick the answer, and (4) Review the core concept tutorial as needed.2. You have divided a study population into subgroups based on blood pressure.Now you want to sample within these subgroups while minimizing bias. What kindof sampling involves using subgroups that are randomly sampled?Question #02(A) Prevalence(B) Systematic assignment(C) Randomization(D) Self-selection(E) StratificationA. Incorrect!Prevalence is the total cases in a population at a given time.B. Incorrect!In systematic sampling, every kth person is selected.C. Incorrect!Randomization is just simple random sampling. Subjects are chosen randomly vianumber generators or simply by slips taken from a hat.FeedbackD. Incorrect!In self-selection individuals select themselves to be part of the study.E. Correct!In stratification, subgroups are randomly sampled.There are several sampling methods that can be used. In stratification, subgroupsare randomly sampled to reduce com Rapid Learning Inc. All Rights Reserved
Question No. 3 of 10Instructions: (1) Read the problem statement and answer choices carefully, (2) Work the problemson paper as needed, (3) Pick the answer, and (4) Review the core concept tutorial as needed.3. You have a data set from a population of 300 adults (n 300). The data has anormal distribution. How much of the data can you expect to fall within one sigmaof the mean?Question #03(A) 1%(B) 50%(C) 68%(D) 95%(E) 99.7%A. Incorrect!Try a higher percentage.B. Incorrect!Try a higher percentage.C. Correct!In the normal, or Gaussian distribution, 68% of the population lies within “onesigma” of the mean.FeedbackD. Incorrect!95% will be within two sigma, not one.E. Incorrect!99.7% will be within three sigma, not one.The sample size of a population is defined as n. The standard deviation of apopulation is defined as, , and is the square root of its variance. It shows howmuch variation there is from the mean. In the normal, or Gaussian distribution,68% of the population lies within “one sigma”, 95% of the population lies within“two sigma” and 99.7% of the population lies within “three sigma”. The standarderror of the mean, SEM, is defined as divided by the square root of n. Thestandard error of the mean is less than and decreases as the sample size, n,increases.(C)68%SolutionRapidLearningCenter.com Rapid Learning Inc. All Rights Reserved
Question No. 4 of 10Instructions: (1) Read the problem statement and answer choices carefully, (2) Work the problemson paper as needed, (3) Pick the answer, and (4) Review the core concept tutorial as needed.4. In reviewing a data set, you become concerned that the data may be imprecise,that is, have low consistency and reproducibility. What type of error would this be?Question #04(A) Negative skew(B) Systematic error(C) Type I error(D) Random error(E) Selection biasA. Incorrect!In negative skew the mean is less than the median which is less than the mode.B. Incorrect!Systematic error leads to reduced accuracy.C. Incorrect!Type I error is the error of rejecting the null hypothesis given that it is actually true.FeedbackD. Correct!In a test, random error leads to reduced precision.E. Incorrect!In selection bias the assignment to a study group is non-random.In a test there can be 2 types of errors that can occur; random error leads toreduced precision whereas systematic error leads to reduced accuracy. Precision in atest refers to (1) consistency and reproducibility, i.e. the reliability and (2) theabsence of random variation.(D)Random errorSolutionRapidLearningCenter.com Rapid Learning Inc. All Rights Reserved
Question No. 5 of 10Instructions: (1) Read the problem statement and answer choices carefully, (2) Work the problemson paper as needed, (3) Pick the answer, and (4) Review the core concept tutorial as needed.5. You hypothesize that a daily regimen of an experimental new drug will have noeffect on tumor progression in a patient population. How do you measure theprobability of rejecting the null hypothesis when it is, in fact, false?Question #05(A) n(B) CI(C) (D) 1 - β(E) 2A. Incorrect!The sample size of a population is defined as, n.B. Incorrect!A confidence interval gives an estimated range of values which is likely to include anunknown population parameter, it may be abbreviated CI.C. Incorrect!The standard deviation of a population is defined as .FeedbackD. Correct!Power is defined as 1 - .E. Incorrect!The chi-squared ( 2) test is used most commonly to compare observed data with theexpected data from a scientific hypothesis.Power is defined as 1 - . It is the probability of rejecting the null hypothesis whenit is in fact false. As power increases, the chances of a Type II error decrease.(D)1 - βSolutionRapidLearningCenter.com Rapid Learning Inc. All Rights Reserved
Question No. 6 of 10Instructions: (1) Read the problem statement and answer choices carefully, (2) Work the problemson paper as needed, (3) Pick the answer, and (4) Review the core concept tutorial as needed.6. You conduct a study comparing five groups receiving different treatments for thesame disease. What is the best statistical test to compare the mean responses ofthe five groups?Question #06(A) T-test(B) ANOVA(C) Chi-squared test(D) Standard deviation(E) Correlation coefficientA. Incorrect!The t-test checks whether the means of two groups are statistically different fromeach other.B. Correct!In its simplest form ANOVA generalizes the t-test to 3 or more groups; it checks thedifference between the means of 3 or more groups.C. Incorrect!The chi-squared test checks the difference between 2 or more percentages orproportions of the outcomes.FeedbackD. Incorrect!The standard deviation of a population is the square root of its variance. It showshow much variation there is from the mean.E. Incorrect!The correlation coefficient, r, ranges from -1 to 1. It compares two variables; thecloser r is to the absolute value of 1, the stronger the correlation between the twovariables.In its simplest form ANOVA generalizes the t-test to 3 or more groups; it checks thedifference between the means of 3 or more groups. The means of 3 or more groupscould also be compared by conducting multiple t-tests, but this increases the chanceof committing a type I error. ANOVA stands for Analysis Of Variance of 3 or com Rapid Learning Inc. All Rights Reserved
Question No. 7 of 10Instructions: (1) Read the problem statement and answer choices carefully, (2) Work the problemson paper as needed, (3) Pick the answer, and (4) Review the core concept tutorial as needed.7. Which of the following infectious diseases does not need to be reported by federalregulation?Question #07(A) Hep A(B) Chagas(C) Syphilis(D) Hep B(E) chickenpoxA. Incorrect!Hep A is an infectious disease that is required to be reported.B. Correct!While Chagas disease is an infectious disease, it is not required to be reported. It isa tropical parasitic disease.C. Incorrect!Syphilis is an infectious disease that is required to be reported.FeedbackD. Incorrect!Hep B is an infectious disease that is required to be reported.E. Incorrect!Chicken pox is an infectious disease that is required to be reported.In all states the infectious diseases that are required to be reported includes, AIDS,chickenpox, gonorrhea, hepatitis A and B, measles, mumps, rubella, salmonella,shigella, syphilis and TB. Other diseases vary by state.A helpful mnemonic is: Hep, Hep, Hep, Hoorary, the SSSMMART Chick is Gone,which stands for Hep B, Hep A, Hep C, HIV, Salmonella, Shigella, Syphilis, Measles,Mumps, AIDS, Rubella, Tuberculosis, Chickenpox and Gonorrhea.(B)ChagasSolutionRapidLearningCenter.com Rapid Learning Inc. All Rights Reserved
Question No. 8 of 10Instructions: (1) Read the problem statement and answer choices carefully, (2) Work the problemson paper as needed, (3) Pick the answer, and (4) Review the core concept tutorial as needed.8. You want to compare the mean responses of two groups receiving different bloodpressure medications. Analysis of the data suggests normal distribution. What isthe best statistical test in this scenario?Question #08(A) Confidence interval(B) Gaussian distribution(C) Power(D) Standard error of the mean(E) T-testA. Incorrect!The confidence interval gives the estimated range of values which is likely to includean unknown population parameter.B. Incorrect!In the normal, or Gaussian distribution, 68% of the population lies within “onesigma”, 95% of the population lies within “two sigma” and 99.7% of the populationlies within “three sigma”.C. Incorrect!The power is the probability of rejecting the null hypothesis when it is in fact false.FeedbackD. Incorrect!The standard error of the mean, SEM, is defined as divided by the square root ofn.E. Correct!The t-test checks whether the means of two groups are statistically different fromeach other.The t-test checks whether the means of two groups are statistically different fromeach other. A t-test is appropriate for comparing the means of two groups. Itassumes that the two groups are independent from one another and that thepopulations in both groups are normally distributed. The Student's t-distributionconfidence intervals can be used to determine the significance level at which twogroups differ. A mnemonic to remember the function of a t-test is: Mr. T. is mean.Solution(E)T-testRapidLearningCenter.com Rapid Learning Inc. All Rights Reserved
Question No. 9 of 10Instructions: (1) Read the problem statement and answer choices carefully, (2) Work the problemson paper as needed, (3) Pick the answer, and (4) Review the core concept tutorial as needed.9. You are testing a new ELISA test for HIV. You are concerned the test isidentifying patients as HIV positive when in fact they are not. If true, what type oferror is taking place?Question #09(A)(B)(C)(D)(E)NullOdds ratioType II errorNegative skewType I errorA. Incorrect!The null hypothesis is a statement that you want to test.B. Incorrect!For case control studies the odds ratio is defined as the following, the odds of havinga disease in an exposed group, divided by, the odds of having a disease in anunexposed group.C. Incorrect!Type II error, also known as an error of the second kind, a β error, or a falsenegative.FeedbackD. Incorrect!In negative skew the mean is less than the median which is less than the mode.E. Correct!Type I error is also known as a false positive.Type I error, also known as error of the first kind, error, or a false positive, occurswhen no effect or difference exists but it is started that there is an effect ordifference. It is the error of rejecting the null hypothesis given that it is actuallytrue.(E) Type I errorSolutionRapidLearningCenter.com Rapid Learning Inc. All Rights Reserved
Question No. 10 of 10Instructions: (1) Read the problem statement and answer choices carefully, (2) Work the problemson paper as needed, (3) Pick the answer, and (4) Review the core concept tutorial as needed.10. Graphical analysis of a data set suggests that age is positively correlated withincidence of type Ii diabetes. What statistical value would you use to measure thestrength of this correlation?Question #10(A) 1 - (B) Incidence multiplied by disease duration(C) Mean – Z(SEM)(D) Stratification(E) rA. Incorrect!Power is defined as 1 - .B. Correct!Prevalence is approximately equal to the incidence multiplied by disease duration.C. Incorrect!The range of the confidence interval goes from (mean – Z(SEM)) to (mean Z(SEM)).FeedbackD. Incorrect!Stratified random sampling or stratification. In this technique subgroups arerandomly sampled.E. Incorrect!The correlation coefficient, r, ranges from -1 to 1. It compares two variables; thecloser r is to the absolute value of 1, the stronger the correlation between the twovariables.The correlation coefficient, r, ranges from -1 to 1. It compares two variables; thecloser r is to the absolute value of 1, the stronger the correlation between the twovariables. In the literature, the coefficient of determination, defined as r 2, is thevalue that is usually reported.Solution(B)incidence multiplied by disease durationRapidLearningCenter.com Rapid Learning Inc. All Rights Reserved
USMLE Step 1 - Problem Drill 06: Biostatistics Question No. 1 of 10 Instructions: (1) Read the problem statement and answer choices carefully, (2) Work the problems on paper as needed, (3) Pick the answer, and (4) Review the core concept tutorial as needed. Question #01 1. You are asked to design a survey that asks men ages 30-40 about their eating

